 IST,
IST,
VI. Price Situation
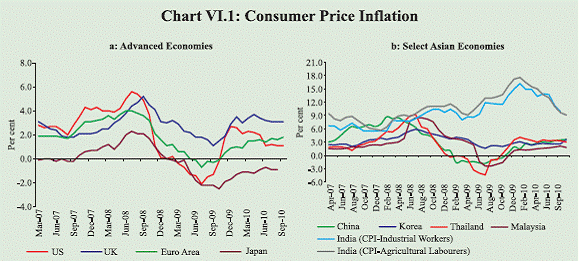
The headline inflation has started to soften after staying in double-digits for five months up to July 2010, reflecting favourable base effects and some moderation in manufacturing price pressures. Despite a normal monsoon inflation remains above the comfort level mainly led by food inflation, which seems to have assumed structural character. The new series on Wholesale Price Index (WPI), with base shifted from 1993-94 to 2004-05, gives a better representation of the more recent production and consumption pattern, without any major difference in the overall trends in inflation. The inflation pressures persist and further moderation would be necessary for easing the concerns for the conduct of monetary policy. Different measures of consumer price inflation fell below double digit levels after more than a year, but still remain elevated tracking high food and fuel inflation. VI.1 With headline inflation measured by WPI (base 2004-05) remaining in double digits for consecutive five months from March to July 2010 and the inflation process turning more generalised, the Reserve Bank’s balance of policy shifted from ‘managing the recovery’ to containing inflation and anchoring inflationary expectations. This was reflected in the calibrated normalisation of monetary policy between January and September 2010. VI.2 In the second quarter of 2010-11, headline inflation exhibited some moderation but remained elevated. The pace of increase in non-food manufactured products prices has moderated in recent months indicating some slowing down of the pace of generalisation of inflation as well as gradual stabilisation of price pressures. Food inflation, however, continues to remain high despite a normal monsoon, as price pressures have amplified for certain non-cereal items like milk, eggs, fish and meat whose output is less responsive to monsoon. Significant increase in primary articles and minerals prices along with building up pressures in a number of commodities globally pose upside risks to domestic inflation. Though various measures of consumer price inflation declined to single digits after more than a year, they continue to remain high. As headline inflation still remains elevated, containing inflation and anchoring inflationary expectations would continue to be a challenge for monetary policy during 2010-11. Global Inflation VI.3 The global inflation environment continues to remain moderate with rising divergence in inflation trends between advanced economies, which face subdued inflationary environment as recovery remains weak, and emerging and developing countries where signs of pickup in inflation coincided with their stronger recovery. The October 2010 World Economic Outlook of the IMF predicts modest increase in prices in advanced economies in 2010 with consumer price inflation expected to increase from near zero in 2009 to 1.4 per cent in 2010 and 1.3 per cent in 2011. Inflation in emerging and developing economies, however, is projected to accelerate to 6.2 per cent in 2010 from 5.2 per cent in 2009, before decelerating back to 5.2 per cent in 2011. Excess capacity in most advanced economies and sluggish labour markets with unemployment rate likely to remain over 8 per cent through 2009-11 is expected to keep price pressures subdued. Soft global inflationary environment may prevail for some more time even though most advanced economies experienced some increase in headline inflation in recent months, largely from increasing energy and food prices. Core inflation in advanced economies, however, has remained subdued, indicating absence of demand side pressures on prices. This provides them the space for continuing with expansionary monetary policy to support the recovery (Chart VI.1 a). VI.4 Year-on-year consumer price inflation in the OECD countries, which increased to 2.0 per cent in May 2010, moderated to 1.6 per cent in August 2010 following a decline in core inflation (excluding food and energy to 1.2 per cent in August 2010 from 1.6 per cent in January 2010). Private consumption demand remains relatively weak in the OECD countries, which along with lower capacity utilisation levels indicates that the low inflation conditions may continue for an extended period of time. VI.5 Inflation in most of the EMEs increased in recent months, but remains moderate (Chart VI.1b). Significant increases in international commodity prices from their historic low levels recorded in early 2009 translated into increases in inflation as the base effect of high prices in the first half of 2008 waned. The impact of any increase in international commodity prices on inflation is more in the case of developing countries as their consumption baskets have larger shares of commodities, especially food and oil. The divergent nature of the global recovery, with a relatively strong recovery and faster closing of output gaps for the EMEs, also poses a challenge for emerging markets. As international prices of commodities are now responding more to increase in growth in EMEs, stronger growth could amplify the risk of high imported inflation. VI.6 Policy rates in advanced economies
continue to remain near zero/very low levels as the concerns on sustainability of
recovery became more prominent in the
second quarter of 2010-11. Assessment of
most central banks pointed towards absence
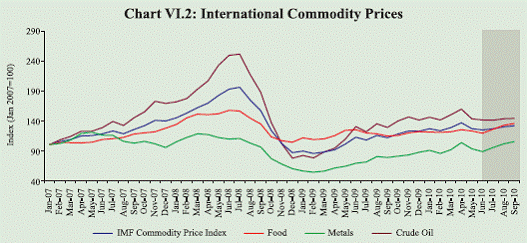
Global Commodity Prices VI.7 During August-September 2010, international commodity prices increased again on account of the supply disruptions in many commodities. Commodity prices earlier recorded some decline during May- June 2010, as concerns over euro area recovery and sustainability of high growth in demand in emerging economies spilled over to commodity markets. (Chart VI.2).
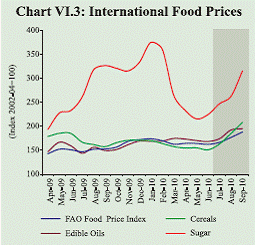
VI.8 Uncertainties in global recovery impacted significantly on crude oil prices. The average crude oil price for Q2 of 2010- 11 was US$ 75.5 per barrel, lower than US$ 78.2 per barrel recorded in Q1. However, crude oil prices firmed up in recent weeks and the WTI crude prices were at US$ 82.2 per barrel as on October 28, 2010. According to the US Energy Information Administration, despite a slight reduction in projected global demand growth, oil prices may firm up due to gradual reduction in global oil inventories. VI.9 International food prices, which moderated marginally during January- June 2010, firmed up in recent months (Chart VI.3). Weather related supply disruptions in a number of commodities contributed to the increase in prices. Wheat prices increased by 72 per cent during June-September 2010 because of weather related output losses in Russia and other producers and Russia’s subsequent ban on grain exports. Coarse cereal prices also increased on account of expected smaller crops in the US and higher export demand given the tight wheat market condition. Edible oils prices were affected due to soyabean losses from drought in the EU and the Black Sea region, and concerns regarding next season’s crop in South America. Cotton prices have increased on account of a decline in output reflecting floods in Pakistan, which is a major producer and exporter of raw cotton. Metal prices have also increased as China reduced the production. Simultaneous increase in prices of a number of commodities poses the risk of high imported inflation in those commodities, particularly where the domestic prices are more responsive to global trends. Administrative measures to mitigate the adverse impact of supply disruptions by countries could also lead to restrictive trade practices, which could further push up global prices.
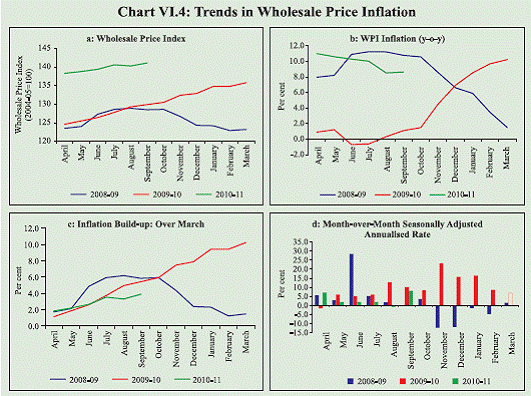
Inflation Conditions in India Wholesale Price Inflation VI.10 WPI inflation increased at a faster pace since November 2009 to reach 11.0 per cent (year-on-year) by April 2010 and remained elevated in the first quarter of 2010-11 (Chart VI.4 a and b). During May- August 2010, however, some moderation in inflation was visible, indicating that inflation might have peaked off (8.6 per cent provisional in September 2010 as per the new series of WPI with base 2004- 05=100). The pace of increase in WPI, which was secular since March 2009, also seems to have declined significantly in recent months and the financial year buildup in inflation is seen to be lower than the previous years (Chart VI.4 c). This was also reflected in low month-on-month seasonally adjusted annualised inflation, except in September 2010 (Chart VI.4 d).
New Series of Wholesale Price Index1 VI.11 On September 14, 2010, the new
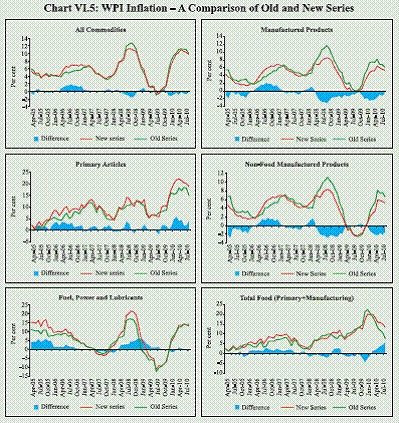
series of WPI with base year 2004-05 was
introduced replacing the 1993-94 series. The
new series reflects some shifts in the weights
towards fuel and power and manufactured
products from primary articles. Although VI.12 The average overall inflation rate,
according to the new series and the old series,
is about 5.5 per cent for the past five years
(i.e., 2005-06 to 2009-10) indicating that there
is not much difference in inflation between
the two series. Occasional divergence in the
inflation between the new and the old series
was observed during different periods and in
terms of rate of inflation (y-o-y), the
maximum difference in any month has been
about 1.8 percentage points. The differences
in inflation across commodity groups,
however, have been larger. Higher food
inflation (both primary and manufactured) in
the new series for 2010-11 is largely offset
by the lower inflation in the non-food
manufactured products, as a result of which
the magnitude of the difference in the headline
inflation remains relatively low (Chart VI.5).
The inflation in non-food manufactured
products, which is particularly significant for
assessment of generalisation and the role of
demand-side factors, suggests: (a) some
moderation in recent months as per the trends
in both series, and more importantly, (b) the
inflation as per the new series is lower, in the
range of 1.4 to 2.2 percentage points during
2010-11 (up to July), relative to the old series, which is largely due to a substantial change
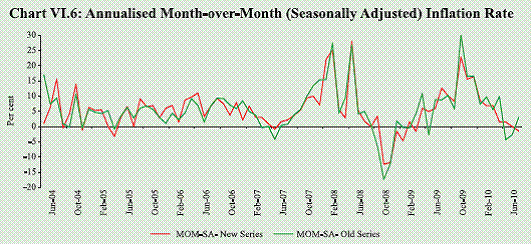
VI.13 The new series of WPI, thus, marks a major change in terms of scope and coverage of commodities and is more representative of the changing underlying economic structure. It adequately captures the present underlying economic structure, which is consistent with changes in the production and the consumption pattern. The non-food manufactured group covers a larger basket in the new series, which includes electronic items and communication equipments, whose prices have declined overtime. The food inflation in the new series is, however, higher than in the old series, which reflects significant shifts in the pattern of household consumption in favour of protein-rich items such as egg, meat and fish, milk and pulses, where price rise has been high with changing income levels and supply response does not appear to be commensurate with the rising demand. VI.14 The month-over-month momentum (seasonally adjusted, annualised) in both the series exhibits similar pattern, even though in recent months the new series showed generally softening bias, unlike the old series. However, price level again increased in September 2010 on the back of food price pressures (Chart VI.6).
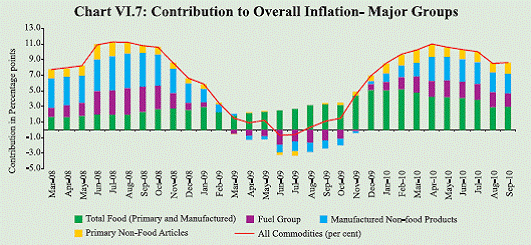
VI.15 Although the WPI inflation exhibited some decline in recent months, it still remains significantly high. The contribution of food inflation to overall inflation has declined since January 2010 as the manufactured food products inflation declined, led by sugar. The contribution of the non-food manufacturing group remained more or less the same during the last few months with marginal decline in August and September 2010 (Chart VI.7).
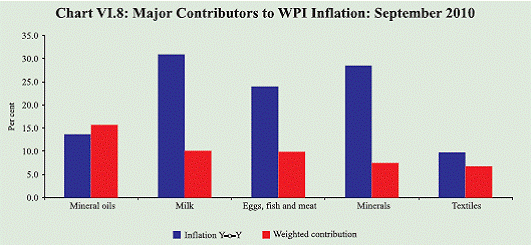
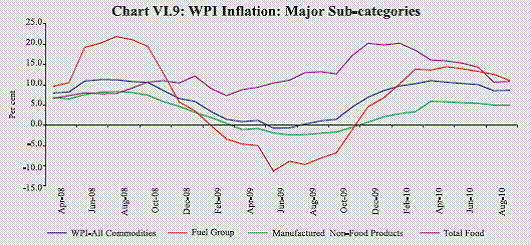
VI.16 The key commodities, which continue to contribute significantly to headline inflation, are mineral oils, food articles like milk, egg, fish and meat, minerals and textiles (Chart VI.8). Increase in food prices continues to have a significant impact on overall inflation as primary food article inflation alone contributed about 31 per cent to overall inflation in September 2010. VI.17 Inflation across different sub-groups followed the trend in headline inflation and exhibited moderation in recent months (Chart VI.9). The decline in food inflation was largely led by manufactured food products. The increase in manufactured nonfood products inflation seems to have contained and fuel inflation also exhibits moderate decline more on account of the base effect of last year’s increase in prices.
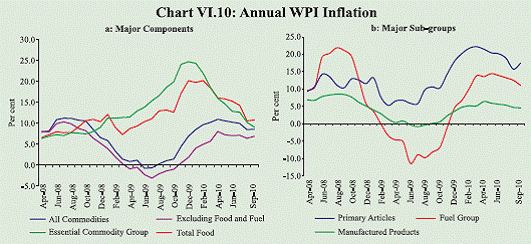
VI.18 Inflation in essential commodities group, which remained significantly divergent from the overall trend during 2009-10, has also moderated (Chart VI.10a). The convergence of different subcomponents of inflation, due to both the decline in food inflation and high non-food inflation points to the generalised nature of inflation process in recent months.
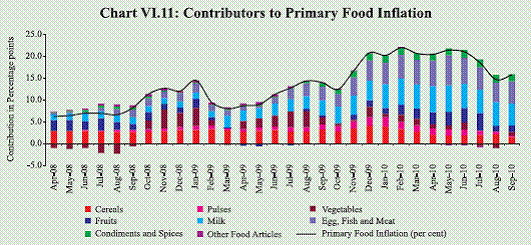
VI.19 Amongst the major groups, primary articles inflation, y-o-y, declined since February 2010 but exhibited some uptrend in September 2010 (Chart VI.10b). The decline in primary articles inflation, however, was more on account of the base effect of sharp increases in prices recorded a year ago. Primary food articles inflation (y-o-y) moderated to 13.8 per cent for the week ended October 16, 2010 from the peak of 22.9 per cent in mid- June 2010. However, since March 2010, primary articles index of WPI has increased by 8.6 per cent (as on October 16, 2010) led by food articles. VI.20 Presently, an important concern from the point of view of inflation management is the downward rigidity in the primary food articles prices even after a good monsoon. With a normal monsoon, it was expected that the prices of food articles would moderate substantially. However, food articles inflation continues to remain in double digits. It needs to be emphasised that with increase in income levels, the consumption basket is getting diversified more in favour of non-cereal items such as milk, vegetables, fruits, meat, poultry and fish, which are important from the nutritional angle. The decomposition of food inflation indicates that during the recent period the key drivers of food inflation are non-cereals. In fact, since November 2009, much of the food inflation is contributed by protein rich items like milk, eggs, fish and meat, which are less responsive to monsoon (Chart VI.11). About two thirds of the primary food inflation (y-o-y) currently emanates from the two sub-groups, milk and ‘egg fish and meat’. Inflation in pulses, however, remains moderate largely reflecting the base effect of very high prices recorded a year ago. Thus, despite a decline in the contribution of cereals and vegetables to inflation in recent months, food inflation continues to remain firm.
VI.21 The sustained high level of food
prices, especially of protein-based items,
whose share in consumption basket has
increased over time along with increases
in income, points to the risk that food price
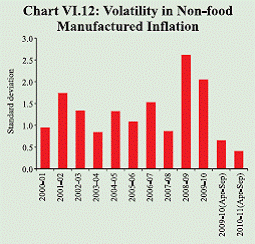
inflation could acquire a structural character VI.22 Non-food primary articles inflation also remains high at above 20 per cent, reflecting the revision in sugarcane index by about 50 per cent in March 2010 and increase in iron ore and raw cotton prices. Iron ore prices have doubled since December 2009, while raw cotton prices increased by more than 20 per cent in September 2010. Increase in raw cotton and sugar prices in recent months in the wake of increase in global commodity prices, despite significant increase in domestic production, points towards the risk of spillover even with favourable production conditions. VI.23 Fuel group inflation is influenced both by decisions of the Government on the administered prices and movements in freely priced petroleum products prices. As on a monthly average basis crude prices (Indian basket) have remained range bound between US $ 75-85 during 2010-11 so far, the non-administered prices under the fuel group remained more or less the same. Motivated by fiscal as well as fuel efficiency considerations, the Government increased the price of diesel (by Rs.2 per litre), PDS kerosene (by Rs.3 per litre) and domestic LPG (by Rs.35 per cylinder) and deregulated petrol prices on June 25, 2010. The direct impact of these measures was about 0.9 percentage point increase in WPI inflation, with the indirect impact on prices through input cost escalation with a lag likely to raise the full impact to about 2 percentage points, assuming partial passthrough. As the deregulated petrol prices remained almost constant during the period July-September 2010 tracking the trends in international crude prices, the pressure on headline inflation remained contained. Fuel group inflation, nevertheless, continues to remain in double digits (11.3 per cent as on October 16, 2010). VI.24 Manufactured products inflation has declined since April 2010, led by decline in prices of food products. The manufactured products price index, however, remains almost the same during 2010-11 so far indicating that the decline in inflation was largely contributed by the high base of the previous year. Non-food manufactured products inflation declined to 5.0 per cent in September 2010 (Table VI.3). VI.25 The inter-temporal volatility in core inflation in India, measured in terms of standard deviation of the non-food manufactured inflation, which is relevant for policy purposes, exhibited significant increase in 2008-09 and 2009-10, after a long period of relative stability (Chart VI.12). The rise in volatility in non-food manufactured inflation, to an extent, could be attributed to the global commodity shocks, as rising prices of inputs tend to cause pressure on manufactured product prices domestically. The data available for 2010-11 so far, however, suggest a significant moderation in the volatility.
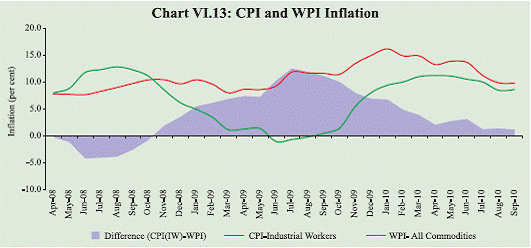
Consumer Price Inflation VI.26 Inflation, as measured by various consumer price indices, continued to moderate in 2010-11 so far. Available measures of inflation, as measured by various CPIs indicate that it remained in the range of 9.1-9.8 per cent in September 2010 (Table VI.4). The divergence between WPI and CPI inflation also reduced in recent months. (Chart VI.13).
VI.27 With strengthening of domestic
growth prospects, inflation management
assumed prime importance, which was
reflected in the normalisation of monetary
policy. Overall, the inflationary process,
which originated from supply shocks, and
then turned increasingly generalised, seems
to have now moderated but remains elevated
at beyond the comfort level. Upward revision
of administered prices and lagged reporting
of past price increases added momentum to
the uptrend in WPI. Among the positive
developments, given the expected better
agricultural output than last year, food price pressures may soften during the course of 1 The Office of Economic Adviser, Ministry of Commerce and Industry have indicated that for the purpose of research and analysis, data of the new series of WPI (Base: 2004-05) can be used from April 2005. For other than research purpose, the WPI Series (Base: 2004-05) is effective only from August 2010, its date of first release i.e., September 14, 2010. |
|||||||||||||||||||||||||||||||||||||||||||||||||||||||||||||||||||||||||||||||||||||||||||||||||||||||||||||||||||||||||||||||||||||||||||||||||||||||||||||||||||||||||||||||||||||||||||||||||||||||||||||||||||||||||||||||||||||||||||||||||||||||||||||||||||||||||||||||||||||||||||||||||||||||||||||||||||||||||||||||||||||||||||||||||||||||||||||||||||||||||||||||||||||||||||||||||||||||||||||||||||||||||||||||||||||||||||||||||||||||||||||||||||||||||||||||||||||||||||||||||||||||||||||||||||||||||||||||||||||||||||||||||||||||||||||||||||||||||||||||||||||||||||||||||||||||||||||||||||||||||||||||||||||||||||||||||||||||||||||||||||
ਪੇਜ ਅੰਤਿਮ ਅੱਪਡੇਟ ਦੀ ਤਾਰੀਖ:


