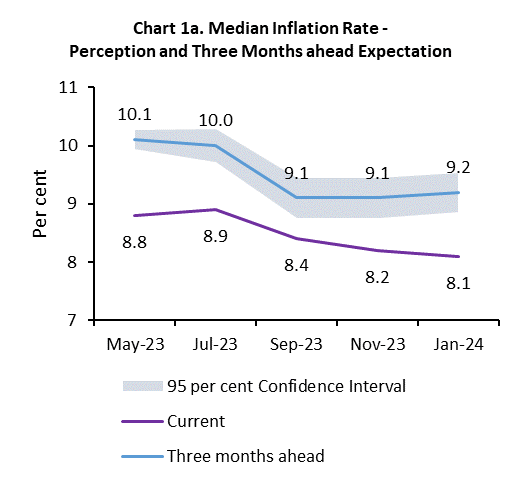
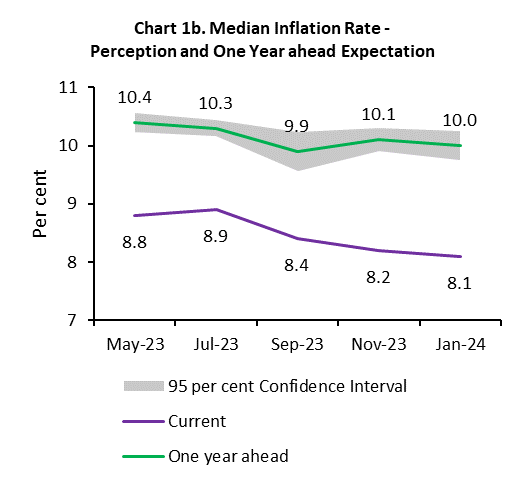
Today, the Reserve Bank released the results of January 2024 round of its bi-monthly inflation expectations survey of households (IESH)[1]2. The survey was conducted during January 2-11, 2024 in 19 major cities, with responses from 6,062 urban households. Female respondents accounted for 52.3 per cent of this sample.
Highlights:
Households’ current inflation perception declined by 10 basis points (bps) from the previous survey round to 8.1 per cent in January 2024 [Charts 1(a) and 1(b); Table 3].
Median inflation expectation for the three months ahead increased by 10 bps and stood at 9.2 per cent, while it reduced for one year horizon by 10 bps to 10.0 per cent in the latest survey round [Charts 1(a) and 1(b); Table 3].
A higher share of respondents foresees a rise in inflation in the near term but, over a one-year horizon, the share of households anticipating higher inflation has moderated as compared to the previous survey round [Tables 1(a) and 1(b)].
Majority of survey participants expect a rise in price and inflationary pressures especially for food product category for the three months horizon [Table 1(a)].
Households’ expectations on overall prices were generally aligned to their expectation on prices of cost of services, food and non-food items. This alignment is more pronounced, especially concerning food products, when looking ahead to the next year [Table 4].
Table 1(a): Product-wise Expectations of Prices for Three Months ahead
(Percentage of Respondents)
Survey period ended
Jan-23
Jul-23
Sep-23
Nov-23
Jan-24
General
Estimate
SE
Estimate
SE
Estimate
SE
Estimate
SE
Estimate
SE
Prices will increase
84.3
0.76
80.8
0.86
74.2
0.97
74.1
0.93
78.2
0.84
Price increase more than current rate
60.8
1.14
55.3
1.20
49.5
1.10
50.8
1.13
54.4
1.09
Price increase similar to current rate
20.2
0.86
21.8
0.93
20.0
0.80
19.1
0.85
19.5
0.80
Price increase less than current rate
3.4
0.36
3.6
0.39
4.7
0.47
4.2
0.42
4.2
0.43
No changes in prices
13.3
0.71
16.1
0.79
20.7
0.88
21.2
0.88
18.3
0.79
Decline in prices
2.3
0.30
3.1
0.41
5.0
0.52
4.7
0.45
3.6
0.37
Food Product
Prices will increase
84.6
0.72
84.0
0.77
75.4
0.87
75.5
0.90
80.2
0.77
Price increase more than current rate
61.1
1.08
63.5
1.04
55.1
1.05
53.7
1.04
59.3
1.00
Price increase similar to current rate
18.4
0.77
15.5
0.72
15.1
0.71
16.1
0.74
15.6
0.72
Price increase less than current rate
5.1
0.43
5.0
0.44
5.3
0.46
5.8
0.47
5.4
0.45
No changes in prices
10.2
0.59
9.0
0.60
13.2
0.68
15.5
0.76
12.3
0.65
Decline in prices
5.2
0.45
7.0
0.54
11.3
0.66
9.0
0.57
7.5
0.51
Non- Food Product
Prices will increase
81.8
0.77
75.5
0.92
69.2
0.93
73.8
0.87
74.0
0.85
Price increase more than current rate
56.4
1.08
52.2
1.16
47.1
1.04
52.4
1.04
52.3
1.03
Price increase similar to current rate
20.5
0.82
18.4
0.80
16.7
0.72
16.1
0.72
16.4
0.71
Price increase less than current rate
4.9
0.44
4.9
0.43
5.4
0.51
5.3
0.46
5.2
0.45
No changes in prices
13.4
0.67
18.3
0.80
20.5
0.77
19.5
0.77
18.6
0.76
Decline in prices
4.7
0.43
6.2
0.54
10.3
0.66
6.7
0.48
7.4
0.52
Household Durables
Prices will increase
72.4
0.90
65.8
0.97
62.2
0.99
63.8
0.98
65.5
0.93
Price increase more than current rate
50.3
1.07
45.3
1.12
43.2
1.05
45.5
1.02
46.3
1.04
Price increase similar to current rate
17.5
0.71
15.8
0.75
14.1
0.65
13.4
0.68
14.5
0.65
Price increase less than current rate
4.6
0.42
4.6
0.41
4.9
0.43
4.9
0.43
4.7
0.42
No changes in prices
21.2
0.84
25.0
0.88
26.4
0.88
25.9
0.89
25.2
0.85
Decline in prices
6.3
0.47
9.2
0.60
11.3
0.64
10.3
0.59
9.4
0.57
Cost of Housing
Prices will increase
78.0
0.86
76.8
0.94
75.1
0.95
76.8
0.88
78.4
0.83
Price increase more than current rate
58.4
1.08
56.0
1.14
54.3
1.09
57.2
1.09
58.2
1.05
Price increase similar to current rate
16.3
0.73
17.0
0.75
16.3
0.66
15.5
0.72
16.1
0.72
Price increase less than current rate
3.3
0.35
3.7
0.35
4.5
0.43
4.1
0.37
4.0
0.41
No changes in prices
18.9
0.84
20.2
0.88
20.9
0.90
20.0
0.83
18.1
0.79
Decline in prices
3.1
0.34
3.0
0.37
4.1
0.46
3.2
0.36
3.6
0.34
Cost of Services
Prices will increase
71.7
0.90
67.7
0.97
63.0
1.04
63.3
0.96
65.0
0.93
Price increase more than current rate
49.9
1.08
47.3
1.13
44.7
1.05
43.7
1.09
46.1
1.02
Price increase similar to current rate
17.6
0.71
15.9
0.72
14.5
0.68
15.5
0.70
15.0
0.69
Price increase less than current rate
4.1
0.40
4.5
0.40
3.9
0.40
4.2
0.40
3.8
0.37
No changes in prices
25.5
0.88
28.2
0.90
31.2
0.99
31.5
0.93
30.5
0.91
Decline in prices
2.7
0.30
4.1
0.43
5.7
0.54
5.1
0.48
4.5
0.41
Note:
1. The table provides estimates and standard errors for qualitative responses.
2. Constituent items may not add up to the corresponding total, due to rounding off.
Table 1(b): Product-wise Expectations of Prices for One Year ahead
(Percentage of Respondents)
Survey period ended
Jan-23
Jul-23
Sep-23
Nov-23
Jan-24
General
Estimate
SE
Estimate
SE
Estimate
SE
Estimate
SE
Estimate
SE
Prices will increase
91.6
0.53
88.6
0.68
86.2
0.74
89.0
0.65
88.7
0.63
Price increase more than current rate
70.8
1.02
65.0
1.07
62.2
1.05
67.2
1.07
66.3
1.06
Price increase similar to current rate
17.9
0.81
20.5
0.86
19.9
0.81
18.4
0.87
19.1
0.83
Price increase less than current rate
3.0
0.33
3.1
0.33
4.1
0.43
3.4
0.38
3.3
0.36
No changes in prices
5.7
0.43
8.6
0.57
9.6
0.59
8.4
0.56
8.2
0.55
Decline in prices
2.6
0.31
2.8
0.35
4.2
0.48
2.7
0.35
3.0
0.36
Food Product
Prices will increase
88.0
0.64
84.7
0.75
82.8
0.80
86.1
0.71
86.4
0.68
Price increase more than current rate
62.7
1.07
60.6
1.11
57.9
1.09
63.2
1.06
63.6
1.03
Price increase similar to current rate
20.7
0.87
20.1
0.85
19.7
0.82
18.4
0.83
18.2
0.77
Price increase less than current rate
4.5
0.42
4.0
0.38
5.3
0.48
4.5
0.41
4.7
0.43
No changes in prices
7.6
0.50
9.3
0.59
9.6
0.58
8.8
0.56
8.7
0.53
Decline in prices
4.4
0.39
6.0
0.48
7.6
0.60
5.1
0.44
4.9
0.43
Non- Food Product
Prices will increase
86.7
0.67
81.6
0.85
78.9
0.83
82.6
0.78
82.0
0.80
Price increase more than current rate
62.0
1.09
57.1
1.16
54.7
1.05
60.7
1.09
59.1
1.11
Price increase similar to current rate
20.5
0.83
20.6
0.83
19.7
0.78
17.4
0.80
18.6
0.79
Price increase less than current rate
4.3
0.41
3.9
0.38
4.5
0.44
4.5
0.42
4.4
0.41
No changes in prices
9.1
0.54
13.5
0.72
13.9
0.66
12.9
0.65
13.1
0.66
Decline in prices
4.1
0.39
4.8
0.48
7.2
0.57
4.5
0.43
4.8
0.45
Household Durables
Prices will increase
80.8
0.77
75.8
0.88
73.9
0.91
75.5
0.89
74.8
0.84
Price increase more than current rate
57.2
1.08
53.2
1.10
52.4
1.04
55.3
1.07
54.0
1.06
Price increase similar to current rate
19.3
0.79
18.4
0.80
17.3
0.71
16.3
0.77
16.7
0.69
Price increase less than current rate
4.3
0.41
4.2
0.38
4.1
0.42
3.9
0.39
4.1
0.41
No changes in prices
13.8
0.65
17.7
0.76
18.5
0.76
17.7
0.76
18.3
0.75
Decline in prices
5.4
0.43
6.5
0.48
7.7
0.56
6.8
0.50
6.9
0.49
Cost of Housing
Prices will increase
87.4
0.63
86.8
0.69
86.1
0.70
87.9
0.68
88.0
0.65
Price increase more than current rate
66.8
0.98
64.6
1.05
65.0
1.04
68.5
1.02
67.7
0.96
Price increase similar to current rate
17.2
0.77
18.5
0.79
16.9
0.73
16.3
0.78
16.7
0.74
Price increase less than current rate
3.5
0.36
3.8
0.37
4.2
0.42
3.1
0.36
3.6
0.40
No changes in prices
9.8
0.57
10.4
0.60
10.1
0.56
9.4
0.61
9.1
0.55
Decline in prices
2.8
0.30
2.7
0.34
3.8
0.43
2.7
0.34
2.9
0.34
Cost of Services
Prices will increase
84.0
0.72
80.9
0.80
78.4
0.86
80.8
0.81
79.5
0.78
Price increase more than current rate
60.2
1.08
57.3
1.12
56.2
1.05
59.2
1.08
58.8
1.03
Price increase similar to current rate
19.7
0.80
19.6
0.83
18.0
0.70
17.6
0.80
16.6
0.72
Price increase less than current rate
4.2
0.41
4.0
0.39
4.2
0.43
4.0
0.40
4.1
0.40
No changes in prices
13.1
0.65
15.5
0.72
17.1
0.74
16.3
0.74
17.0
0.72
Decline in prices
2.8
0.33
3.5
0.37
4.4
0.48
2.9
0.36
3.5
0.37
Note:
1. The table provides estimates and standard errors for qualitative responses.
2. Constituent items may not add up to the corresponding total, due to rounding off.
Table 2: Inflation Expectations of Various Groups: Jan-24
Current Perception
Three Months ahead Expectation
One Year ahead Expectation
Mean
Median
Mean
Median
Mean
Median
Estimate
SE
Estimate
SE
Estimate
SE
Estimate
SE
Estimate
SE
Estimate
SE
Overall
8.8
0.09
8.1
0.12
9.7
0.09
9.2
0.17
9.6
0.10
10.0
0.13
Gender-wise
Male
8.9
0.13
8.3
0.18
9.8
0.13
9.4
0.27
9.7
0.15
10.0
0.18
Female
8.6
0.12
8.0
0.16
9.6
0.13
9.1
0.21
9.5
0.14
9.9
0.20
Category-wise
Financial Sector Employees
8.0
0.44
7.3
0.54
8.6
0.43
7.9
0.72
9.4
0.71
9.2
0.75
Other Employees
8.9
0.18
8.3
0.23
9.7
0.19
9.3
0.34
9.5
0.23
10.0
0.22
Self Employed
9.2
0.19
8.7
0.31
9.9
0.20
9.8
0.33
9.5
0.24
9.9
0.34
Homemaker
8.6
0.14
8.1
0.17
9.7
0.14
9.2
0.23
9.6
0.17
10.0
0.18
Retired Persons
9.0
0.33
8.0
0.33
10.0
0.35
9.3
0.50
10.3
0.38
10.3
0.36
Daily Workers
8.9
0.23
8.4
0.37
9.7
0.26
9.3
0.47
9.3
0.31
9.7
0.51
Other category
8.1
0.21
7.5
0.22
8.9
0.22
8.2
0.27
9.1
0.26
9.0
0.34
Age Group-wise
Up to 25 years
7.9
0.17
7.3
0.19
8.8
0.18
8.2
0.21
9.1
0.21
9.0
0.22
25 to 30 years
8.6
0.18
8.0
0.23
9.4
0.18
8.9
0.27
9.6
0.22
9.6
0.35
30 to 35 years
8.9
0.19
8.3
0.21
9.8
0.20
9.5
0.34
9.9
0.24
10.2
0.15
35 to 40 years
9.0
0.19
8.4
0.23
9.8
0.20
9.3
0.30
9.6
0.25
10.1
0.22
40 to 45 years
9.0
0.23
8.5
0.36
9.9
0.24
9.7
0.37
9.7
0.29
10.2
0.18
45 to 50 years
9.1
0.22
8.6
0.30
10.0
0.24
9.6
0.46
9.6
0.30
10.0
0.34
50 to 55 years
8.7
0.29
8.0
0.31
9.7
0.31
9.4
0.66
9.5
0.36
9.9
0.52
55 to 60 years
8.8
0.30
8.1
0.55
9.8
0.30
9.7
0.43
9.3
0.35
9.7
0.63
60 years and above
8.9
0.29
8.2
0.35
9.7
0.29
9.5
0.49
9.6
0.34
10.0
0.43
City-wise
Ahmedabad
7.6
0.32
7.1
0.29
8.5
0.37
8.0
0.26
7.8
0.45
7.8
0.26
Bengaluru
7.7
0.21
6.0
0.31
8.7
0.20
7.5
0.43
9.5
0.25
9.3
0.62
Bhopal
7.9
0.45
6.8
0.83
8.6
0.50
7.7
0.93
7.9
0.58
7.8
0.99
Bhubaneswar
8.9
0.70
9.4
0.31
10.7
0.71
11.0
1.03
11.0
0.85
12.3
1.58
Chennai
9.2
0.32
9.6
0.60
10.4
0.39
10.4
0.40
11.6
0.42
12.3
1.27
Delhi
9.4
0.23
9.3
0.55
10.1
0.24
10.2
0.21
10.1
0.25
10.3
0.19
Guwahati
8.0
0.69
7.5
0.78
8.6
0.65
8.2
0.80
9.2
0.57
9.1
0.60
Hyderabad
7.5
0.24
6.9
0.30
8.5
0.27
7.9
0.23
8.2
0.34
8.8
0.48
Jaipur
8.2
0.66
7.9
0.70
8.7
0.57
8.3
0.51
7.6
0.68
7.6
0.84
Jammu
9.9
0.81
9.1
1.57
9.6
0.70
8.8
1.23
8.6
0.92
8.0
1.49
Kolkata
10.1
0.32
9.9
0.58
11.0
0.31
10.6
0.45
11.1
0.30
11.1
0.60
Lucknow
9.1
0.42
8.4
0.68
9.9
0.47
9.4
0.81
10.0
0.49
9.9
0.69
Mumbai
8.8
0.21
8.2
0.17
9.9
0.20
9.5
0.33
9.0
0.27
9.8
0.40
Nagpur
9.7
0.42
9.2
0.49
10.9
0.46
10.4
0.36
10.3
0.66
10.9
0.62
Patna
7.8
0.50
7.7
0.67
8.2
0.50
8.0
0.64
8.3
0.51
8.2
0.60
Thiruvananthapuram
7.5
0.75
7.0
0.93
8.8
0.73
8.3
0.81
10.3
0.94
10.3
0.89
Chandigarh
10.1
0.56
10.2
0.49
9.9
0.71
9.9
0.95
9.9
0.68
10.3
0.79
Ranchi
9.2
0.34
8.7
0.30
9.6
0.37
9.3
0.35
9.5
0.45
9.7
0.43
Raipur
9.9
0.61
9.7
0.80
10.6
0.57
10.5
0.52
10.8
0.64
11.3
0.82
Note: The table provides estimates and standard errors for quantitative responses.
Table 3: Household Inflation Expectations – Current Perception, Three Months and One Year Ahead Expectations
Current Perception
Three Months ahead Expectation
One Year ahead Expectation
Mean
Median
Mean
Median
Mean
Median
Estimate
SE
Estimate
SE
Estimate
SE
Estimate
SE
Estimate
SE
Estimate
SE
Jan-23
9.7
0.09
9.6
0.30
10.8
0.10
10.5
0.08
10.8
0.11
10.8
0.09
Jul-23
9.3
0.09
8.9
0.14
10.2
0.09
10.0
0.15
10.0
0.11
10.3
0.07
Sep-23
9.0
0.09
8.4
0.11
9.7
0.09
9.1
0.17
9.3
0.11
9.9
0.17
Nov-23
8.9
0.09
8.2
0.12
9.7
0.09
9.1
0.18
9.6
0.10
10.1
0.10
Jan-24
8.8
0.09
8.1
0.12
9.7
0.09
9.2
0.17
9.6
0.10
10.0
0.13
Note: The table provides estimates and standard errors for quantitative responses.
Table 4: Households Expecting General Price Movements in Coherence with Movements in Price Expectations of Various Product Groups: Three Months Ahead and One Year Ahead
(Percentage of Respondents)
Survey period ended
Food
Non-Food
Households durables
Housing
Cost of services
Three Months Ahead
Jan-23
65.6
67.3
62.6
66.2
66.5
Jul-23
63.1
65.5
60.9
64.5
65.7
Sep-23
62.0
64.3
60.7
63.2
66.3
Nov-23
66.5
61.8
57.0
60.7
66.4
Jan-24
65.2
65.4
60.8
64.2
65.8
One Year Ahead
Jan-23
75.2
74.8
68.4
74.7
74.0
Jul-23
73.4
73.0
66.9
73.4
73.6
Sep-23
69.8
71.2
66.8
72.2
71.5
Nov-23
74.8
73.9
68.1
75.3
73.9
Jan-24
76.5
74.1
67.9
74.9
74.6
Note: Figures are based on sample observations
The survey is conducted at bi-monthly intervals by the Reserve Bank; it provides directional information on near-term inflationary pressures as expected by respondents and may reflect their own consumption patterns. Hence, survey results reflect respondents’ views, which are not necessarily shared by the Reserve Bank.
All estimates of inflation expectations are given in the form of median, unless stated otherwise.
Results of the previous survey round were released on the Bank’s website on December 08, 2023. Unit-level data for previous rounds of the survey are available on the Bank’s ‘Database on Indian Economy’ (DBIE) portal (weblink: https://dbie.rbi.org.in/#/dbie/home) under the head ‘Unit-level Data’.
RbiTtsCommonUtility
PLAYING
LISTEN
LOADING...
0:062:49
Related Assets
RBI-Install-RBI-Content-Global
RbiSocialMediaUtility
Share this page:
Install the RBI mobile application and get quick access to the latest news!
RbiWasItHelpfulUtility
Was this page helpful?Thanks!
Would like to give more details?
Thank you for your feedback!Thank you for your feedback!