Today, the Reserve Bank released the results of the May 2018 round of its Inflation Expectations Survey of Households (IESH)1. The survey was conducted in 18 cities and the results are based on responses from 5,289 urban households covering various occupational categories (Table 1). Highlights: -
The proportion of respondents expecting prices to increase at more than the current rate in the next three months and over the year ahead rose in the May 2018 round after falling in the previous two rounds (Table 2). -
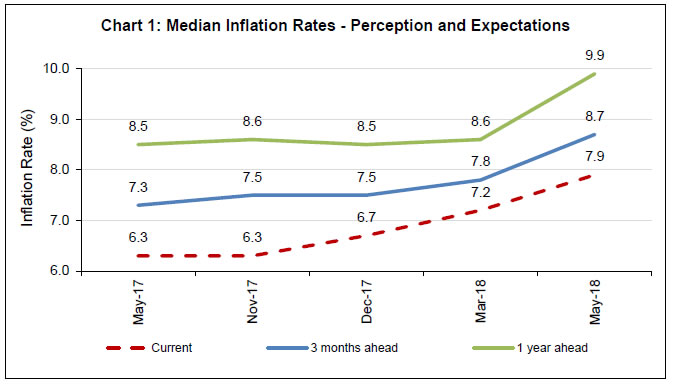
Three months ahead and one year ahead median inflation expectations rose by 90 basis points (bps) and 130 bps, respectively, as compared with the March 2018 round (Chart 1, Table 4). -
Three months ahead and one year ahead median inflation expectations increased by 140 bps each when compared with the May 2017 round. Note: Please see the excel file for time series data | Table 1: Respondents’ Profile (Category): Share in Total Sample – May 2018 | | Category of Respondents | Share in Total (%) | Target Share (%) | | Financial Sector Employees | 9.3 | 10.0 | | Other Employees | 15.5 | 15.0 | | Self-employed | 20.3 | 20.0 | | Homemakers | 29.4 | 30.0 | | Retired Persons | 9.2 | 10.0 | | Daily Workers | 10.4 | 10.0 | | Others | 6.0 | 5.0 |
| Table 2: Product-wise Expectations of Prices for Three Months ahead and One Year ahead | | (Percentage of Respondents) | | Round | May-17 | Nov-17 | Dec-17 | Mar-18 | May-18 | May-17 | Nov-17 | Dec-17 | Mar-18 | May-18 | | Options: General | Three Months Ahead | One Year Ahead | | Prices will increase | 70.2 | 81.4 | 80.5 | 80.2 | 82.3 | 80.9 | 92.7 | 92.7 | 90.8 | 91.1 | | Price increase more than current rate | 35.9 | 53.2 | 49.8 | 45.4 | 50.5 | 46.3 | 64.1 | 63.0 | 56.7 | 62.6 | | Price increase similar to current rate | 25.0 | 23.1 | 24.6 | 27.2 | 25.1 | 26.4 | 23.8 | 23.9 | 28.0 | 23.4 | | Price increase less than current rate | 9.3 | 5.1 | 6.1 | 7.5 | 6.7 | 8.2 | 4.8 | 5.8 | 6.2 | 5.0 | | No change in prices | 25.2 | 16.3 | 17.4 | 17.8 | 16.0 | 14.3 | 5.5 | 5.3 | 7.0 | 6.5 | | Decline in prices | 4.6 | 2.3 | 2.0 | 2.1 | 1.7 | 4.8 | 1.8 | 2.0 | 2.2 | 2.4 | | Options: Food Product | Three Months Ahead | One Year Ahead | | Prices will increase | 73.7 | 80.3 | 78.1 | 79.6 | 82.0 | 79.8 | 85.7 | 85.0 | 85.0 | 85.6 | | Price increase more than current rate | 38.6 | 50.4 | 45.8 | 44.0 | 48.3 | 42.1 | 54.0 | 52.1 | 47.4 | 53.4 | | Price increase similar to current rate | 23.6 | 23.2 | 23.4 | 24.9 | 24.5 | 27.2 | 25.2 | 24.9 | 28.9 | 25.2 | | Price increase less than current rate | 11.5 | 6.7 | 8.9 | 10.7 | 9.3 | 10.6 | 6.5 | 8.1 | 8.7 | 7.0 | | No change in prices | 18.2 | 12.9 | 15.5 | 15.4 | 13.5 | 11.9 | 9.0 | 10.4 | 10.2 | 9.4 | | Decline in prices | 8.1 | 6.8 | 6.4 | 5.0 | 4.5 | 8.2 | 5.3 | 4.6 | 4.8 | 5.0 | | Options: Non-Food Product | Three Months Ahead | One Year Ahead | | Prices will increase | 66.3 | 75.7 | 73.3 | 75.0 | 78.4 | 73.9 | 81.4 | 80.5 | 80.0 | 82.7 | | Price increase more than current rate | 32.4 | 47.1 | 41.2 | 39.6 | 45.8 | 37.1 | 51.2 | 48.8 | 44.2 | 51.1 | | Price increase similar to current rate | 23.4 | 21.9 | 23.3 | 25.4 | 24.0 | 25.7 | 23.5 | 23.7 | 26.8 | 25.3 | | Price increase less than current rate | 10.6 | 6.7 | 8.8 | 10.0 | 8.6 | 11.1 | 6.7 | 7.9 | 9.0 | 6.3 | | No change in prices | 26.9 | 19.5 | 21.9 | 20.8 | 18.1 | 19.1 | 14.4 | 15.4 | 15.8 | 13.2 | | Decline in prices | 6.8 | 4.8 | 4.8 | 4.2 | 3.6 | 7.0 | 4.2 | 4.2 | 4.3 | 4.1 | | Options: Household Durables | Three Months Ahead | One Year Ahead | | Prices will increase | 51.1 | 61.9 | 60.0 | 63.7 | 63.2 | 62.1 | 71.0 | 68.8 | 71.1 | 72.5 | | Price increase more than current rate | 25.1 | 38.6 | 35.0 | 34.7 | 36.7 | 31.9 | 44.5 | 42.3 | 40.1 | 45.2 | | Price increase similar to current rate | 17.1 | 17.4 | 18.6 | 20.7 | 19.9 | 21.5 | 20.7 | 19.8 | 23.4 | 21.5 | | Price increase less than current rate | 8.9 | 5.8 | 6.4 | 8.3 | 6.6 | 8.8 | 5.8 | 6.7 | 7.7 | 5.8 | | No change in prices | 33.6 | 26.8 | 28.8 | 26.2 | 26.8 | 24.9 | 20.3 | 21.7 | 19.9 | 19.2 | | Decline in prices | 15.3 | 11.3 | 11.3 | 10.1 | 10.0 | 13.0 | 8.7 | 9.5 | 9.0 | 8.3 | | Options: Housing Prices | Three Months Ahead | One Year Ahead | | Prices will increase | 57.3 | 70.5 | 69.5 | 70.0 | 71.6 | 69.7 | 78.8 | 78.3 | 80.2 | 79.8 | | Price increase more than current rate | 33.2 | 48.4 | 45.9 | 43.9 | 47.6 | 39.7 | 54.5 | 53.3 | 50.9 | 55.2 | | Price increase similar to current rate | 17.0 | 17.0 | 18.0 | 18.8 | 18.2 | 22.7 | 19.4 | 19.2 | 22.5 | 19.6 | | Price increase less than current rate | 7.1 | 5.0 | 5.6 | 7.3 | 5.8 | 7.3 | 4.9 | 5.9 | 6.8 | 5.0 | | No change in prices | 26.4 | 20.1 | 21.0 | 22.3 | 20.8 | 17.4 | 13.6 | 14.0 | 13.9 | 13.9 | | Decline in prices | 16.2 | 9.5 | 9.5 | 7.7 | 7.7 | 12.9 | 7.7 | 7.6 | 5.9 | 6.3 | | Options: Cost of Services | Three Months Ahead | One Year Ahead | | Prices will increase | 61.3 | 71.1 | 71.5 | 70.2 | 72.0 | 75.5 | 83.4 | 82.8 | 82.6 | 84.2 | | Price increase more than current rate | 29.4 | 44.3 | 41.4 | 38.3 | 42.9 | 37.3 | 51.5 | 50.5 | 45.3 | 52.9 | | Price increase similar to current rate | 21.7 | 20.7 | 23.2 | 23.5 | 22.6 | 26.8 | 25.2 | 24.3 | 28.6 | 24.4 | | Price increase less than current rate | 10.2 | 6.2 | 6.8 | 8.3 | 6.6 | 11.4 | 6.7 | 8.0 | 8.7 | 6.9 | | No change in prices | 33.0 | 25.8 | 25.6 | 26.6 | 25.6 | 19.1 | 14.0 | 14.2 | 14.9 | 13.5 | | Decline in prices | 5.7 | 3.1 | 3.0 | 3.3 | 2.4 | 5.5 | 2.6 | 3.0 | 2.5 | 2.4 | | Note: Constituent items may not add up to totals, due to rounding off. |
| Table 3: Households Expecting General Price Movements in Coherence with Movements in Price Expectations of Various Product Groups: Three Months Ahead and One Year Ahead | | (Percentage of Respondents) | | Survey period ended | Food | Non-Food | Households durables | Housing | Cost of services | | Three Months Ahead | | May-17 | 59.8 | 59.7 | 51.0 | 52.5 | 60.3 | | Nov-17 | 66.6 | 67.4 | 57.1 | 60.3 | 65.7 | | Dec-17 | 64.9 | 64.1 | 55.5 | 58.4 | 63.8 | | Mar-18 | 63.7 | 63.2 | 55.6 | 57.8 | 62.7 | | May-18 | 67.5 | 65.6 | 56.6 | 60.0 | 65.0 | | One Year Ahead | | May-17 | 66.8 | 64.4 | 56.4 | 58.7 | 67.3 | | Nov-17 | 72.7 | 70.5 | 60.9 | 66.2 | 71.3 | | Dec-17 | 70.1 | 69.0 | 58.8 | 65.1 | 70.5 | | Mar-18 | 69.0 | 66.3 | 59.6 | 64.3 | 69.2 | | May-18 | 72.4 | 70.8 | 62.5 | 67.4 | 72.1 |
| Table 4: Household Inflation Expectations – Current, Three Months and One Year Ahead | | Survey Period Ended | Inflation rate in Per cent | | Current | Three Months Ahead | One Year Ahead | | Mean | Median | Std. Dev. | Mean | Median | Std. Dev. | Mean | Median | Std. Dev. | | May-17 | 7.5 | 6.3 | 4.0 | 8.1 | 7.3 | 4.2 | 9.2 | 8.5 | 4.3 | | Nov-17 | 7.7 | 6.3 | 4.1 | 8.4 | 7.5 | 4.2 | 8.9 | 8.6 | 4.6 | | Dec-17 | 7.9 | 6.7 | 4.2 | 8.4 | 7.5 | 4.3 | 8.9 | 8.5 | 4.8 | | Mar-18 | 8.2 | 7.2 | 4.0 | 8.6 | 7.8 | 4.1 | 8.9 | 8.6 | 4.7 | | May-18 | 8.7 | 7.9 | 4.3 | 9.4 | 8.7 | 4.4 | 9.7 | 9.9 | 5.1 |
| Table 5: Factors that Explain the Total Variability | | Survey Period Ended | Current | Three Months Ahead | One Year Ahead | | May-17 | City, Gender, Category | City, Category | City, Category | | Nov-17 | City, Category, Age-Group | City, Category | City, Category | | Dec-17 | City, Category, Age-Group, Gender | City, Category, Age-Group | City, Category | | Mar-18 | City, Age-Group, Gender | City, Category, Age-Group, Gender | City, Category | | May-18 | City, Category, Age-Group | City, Category | City, Gender, Category |
| Table 6: Various Group-wise Inflation Expectations: May 2018 | | | Current | Three Months Ahead | One Year Ahead | | Mean | Median | Std. Dev. | Mean | Median | Std. Dev. | Mean | Median | Std. Dev. | | Overall | 8.7 | 7.9 | 4.3 | 9.4 | 8.7 | 4.4 | 9.7 | 9.9 | 5.1 | | Gender-wise | | Male | 8.7 | 7.9 | 4.4 | 9.3 | 8.7 | 4.5 | 9.4 | 9.4 | 5.2 | | Female | 8.7 | 7.9 | 4.2 | 9.5 | 8.8 | 4.3 | 10.0 | 10.2 | 4.9 | | Category-wise | | Financial Sector Employees | 8.3 | 7.2 | 4.3 | 8.8 | 7.7 | 4.4 | 9.1 | 8.3 | 5.0 | | Other Employees | 8.7 | 7.8 | 4.4 | 9.3 | 8.7 | 4.5 | 9.7 | 9.6 | 5.1 | | Self Employed | 8.9 | 8.4 | 4.4 | 9.5 | 9.0 | 4.5 | 9.5 | 10.0 | 5.3 | | Homemakers | 8.8 | 8.0 | 4.2 | 9.5 | 8.9 | 4.3 | 10.0 | 10.2 | 4.9 | | Retired Persons | 8.9 | 8.1 | 4.7 | 9.7 | 9.3 | 4.8 | 9.6 | 9.7 | 5.4 | | Daily Workers | 8.8 | 8.3 | 4.2 | 9.4 | 9.0 | 4.3 | 9.9 | 10.3 | 4.9 | | Other category | 8.0 | 6.8 | 3.7 | 8.6 | 7.7 | 3.9 | 9.0 | 8.8 | 4.6 | | Age Group-wise | | Up to 25 years | 7.9 | 6.9 | 4.0 | 8.6 | 7.9 | 4.1 | 9.2 | 9.1 | 4.8 | | 25 to 30 years | 8.3 | 7.7 | 4.0 | 9.0 | 8.5 | 4.1 | 9.5 | 9.7 | 4.8 | | 30 to 35 years | 8.7 | 8.0 | 4.2 | 9.4 | 8.7 | 4.4 | 9.8 | 10.1 | 5.1 | | 35 to 40 years | 8.7 | 7.9 | 4.2 | 9.4 | 8.9 | 4.3 | 9.8 | 10.1 | 5.0 | | 40 to 45 years | 9.3 | 8.7 | 4.5 | 9.8 | 9.4 | 4.5 | 9.8 | 10.2 | 5.3 | | 45 to 50 years | 9.3 | 8.6 | 4.6 | 9.8 | 9.2 | 4.6 | 9.8 | 10.1 | 5.2 | | 50 to 55 years | 9.1 | 8.3 | 4.6 | 9.7 | 9.2 | 4.7 | 9.9 | 10.1 | 5.3 | | 55 to 60 years | 9.3 | 8.4 | 4.4 | 10.0 | 9.5 | 4.6 | 9.9 | 9.7 | 5.2 | | 60 years and above | 9.0 | 8.3 | 4.5 | 9.7 | 9.3 | 4.6 | 9.6 | 10.0 | 5.3 | | City-wise | | Ahmedabad | 9.7 | 8.9 | 4.3 | 10.6 | 10.2 | 4.3 | 10.9 | 10.5 | 4.4 | | Bengaluru | 4.2 | 3.9 | 1.9 | 5.2 | 4.9 | 2.3 | 5.3 | 5.2 | 2.8 | | Bhopal | 7.4 | 5.8 | 4.7 | 7.9 | 6.9 | 4.6 | 7.6 | 8.1 | 5.4 | | Bhubaneswar | 8.4 | 8.1 | 3.6 | 10.0 | 10.2 | 3.8 | 11.8 | 12.2 | 3.8 | | Chennai | 10.9 | 10.5 | 4.0 | 12.2 | 12.6 | 4.0 | 13.4 | 15.4 | 3.9 | | Delhi | 8.4 | 7.7 | 3.9 | 9.1 | 8.5 | 4.1 | 9.8 | 9.5 | 4.4 | | Guwahati | 10.7 | 10.8 | 5.1 | 9.4 | 9.3 | 5.2 | 9.5 | 9.9 | 5.7 | | Hyderabad | 7.8 | 6.9 | 3.2 | 8.5 | 7.9 | 3.1 | 9.8 | 9.0 | 3.8 | | Jaipur | 9.4 | 9.3 | 4.7 | 9.8 | 10.2 | 4.7 | 9.6 | 10.4 | 5.9 | | Kolkata | 9.7 | 9.6 | 4.4 | 10.3 | 10.2 | 4.4 | 10.6 | 10.4 | 4.7 | | Lucknow | 8.5 | 8.3 | 3.2 | 9.6 | 9.3 | 3.5 | 10.2 | 10.3 | 4.3 | | Mumbai | 10.1 | 10.1 | 4.3 | 10.6 | 10.4 | 4.3 | 10.4 | 10.6 | 5.1 | | Nagpur | 7.6 | 6.3 | 3.9 | 8.0 | 7.1 | 4.1 | 7.3 | 7.0 | 5.1 | | Patna | 7.7 | 6.8 | 3.7 | 8.2 | 7.6 | 3.9 | 8.6 | 8.7 | 4.6 | | Thiruvananthapuram | 10.0 | 10.2 | 4.6 | 11.2 | 10.7 | 4.5 | 11.5 | 12.5 | 5.4 | | Chandigarh | 7.7 | 6.7 | 3.9 | 7.9 | 7.1 | 3.9 | 8.2 | 7.4 | 4.3 | | Ranchi | 7.5 | 6.6 | 3.5 | 8.1 | 7.4 | 3.7 | 7.4 | 7.8 | 5.0 | | Raipur | 6.2 | 5.6 | 2.8 | 6.8 | 5.9 | 3.1 | 6.3 | 6.0 | 4.4 |
| Table 7: Cross-tabulation of Current and Three Months Ahead Inflation Expectations: May 2018 | | (Number of Respondents) | | Three Months Ahead Inflation Rate (per cent) | | Current Inflation Rate (per cent) | | <1 | 1-<2 | 2-<3 | 3-<4 | 4-<5 | 5-<6 | 6-<7 | 7-<8 | 8-<9 | 9-<10 | 10-<11 | 11-<12 | 12-<13 | 13-<14 | 14-<15 | 15-<16 | >=16 | No idea | Total | | <1 | 36 | 1 | 6 | 4 | 1 | 2 | 0 | 0 | 0 | 0 | 0 | 0 | 0 | 0 | 0 | 0 | 0 | 0 | 50 | | 1-<2 | 0 | 24 | 15 | 4 | 0 | 1 | 0 | 0 | 0 | 0 | 0 | 0 | 0 | 0 | 0 | 0 | 0 | 0 | 44 | | 2-<3 | 0 | 9 | 123 | 50 | 32 | 4 | 2 | 0 | 0 | 0 | 0 | 0 | 1 | 0 | 0 | 0 | 0 | 1 | 222 | | 3-<4 | 1 | 2 | 11 | 114 | 69 | 50 | 6 | 0 | 1 | 1 | 2 | 0 | 0 | 0 | 0 | 0 | 0 | 1 | 258 | | 4-<5 | 0 | 2 | 10 | 13 | 212 | 74 | 45 | 9 | 3 | 0 | 5 | 0 | 0 | 0 | 0 | 0 | 0 | 0 | 373 | | 5-<6 | 0 | 4 | 10 | 16 | 14 | 455 | 130 | 159 | 59 | 6 | 41 | 0 | 2 | 0 | 0 | 2 | 1 | 2 | 901 | | 6-<7 | 0 | 1 | 3 | 2 | 3 | 9 | 223 | 91 | 62 | 7 | 11 | 0 | 5 | 0 | 1 | 0 | 1 | 0 | 419 | | 7-<8 | 0 | 3 | 2 | 2 | 4 | 8 | 5 | 185 | 105 | 62 | 42 | 2 | 4 | 1 | 0 | 0 | 2 | 0 | 427 | | 8-<9 | 0 | 0 | 2 | 2 | 1 | 2 | 1 | 4 | 160 | 73 | 120 | 9 | 14 | 3 | 0 | 1 | 0 | 0 | 392 | | 9-<10 | 0 | 0 | 0 | 1 | 3 | 2 | 0 | 1 | 2 | 91 | 52 | 35 | 13 | 3 | 8 | 2 | 1 | 3 | 217 | | 10-<11 | 0 | 0 | 1 | 1 | 2 | 20 | 3 | 4 | 11 | 10 | 392 | 54 | 159 | 25 | 11 | 114 | 28 | 3 | 838 | | 11-<12 | 0 | 0 | 0 | 0 | 2 | 1 | 0 | 1 | 1 | 0 | 0 | 39 | 15 | 13 | 6 | 10 | 1 | 0 | 89 | | 12-<13 | 0 | 1 | 0 | 0 | 1 | 0 | 0 | 1 | 0 | 1 | 2 | 0 | 41 | 20 | 24 | 12 | 5 | 0 | 108 | | 13-<14 | 0 | 0 | 1 | 0 | 0 | 0 | 0 | 1 | 0 | 0 | 1 | 0 | 0 | 9 | 5 | 11 | 1 | 0 | 29 | | 14-<15 | 0 | 0 | 1 | 0 | 0 | 1 | 0 | 0 | 0 | 1 | 1 | 0 | 1 | 3 | 21 | 7 | 11 | 3 | 50 | | 15-<16 | 0 | 1 | 0 | 1 | 0 | 1 | 0 | 2 | 1 | 0 | 7 | 0 | 1 | 1 | 1 | 84 | 97 | 0 | 197 | | >=16 | 0 | 0 | 0 | 0 | 1 | 3 | 3 | 2 | 2 | 1 | 14 | 0 | 1 | 0 | 1 | 21 | 612 | 14 | 675 | | Total | 37 | 48 | 185 | 210 | 345 | 633 | 418 | 460 | 407 | 253 | 690 | 139 | 257 | 78 | 78 | 264 | 760 | 27 | 5289 |
| Table 8: Cross-tabulation of Current and One Year Ahead Inflation Expectations: May 2018 | | (Number of Respondents) | | One Year Ahead Inflation Rate (per cent) | | Current Inflation Rate (per cent) | | <1 | 1-<2 | 2-<3 | 3-<4 | 4-<5 | 5-<6 | 6-<7 | 7-<8 | 8-<9 | 9-<10 | 10-<11 | 11-<12 | 12-<13 | 13-<14 | 14-<15 | 15-<16 | >=16 | No idea | Total | | <1 | 33 | 3 | 5 | 4 | 1 | 2 | 0 | 0 | 0 | 0 | 0 | 0 | 0 | 0 | 0 | 0 | 1 | 1 | 50 | | 1-<2 | 10 | 6 | 16 | 8 | 3 | 1 | 0 | 0 | 0 | 0 | 0 | 0 | 0 | 0 | 0 | 0 | 0 | 0 | 44 | | 2-<3 | 33 | 2 | 64 | 42 | 49 | 20 | 3 | 1 | 1 | 1 | 4 | 1 | 0 | 0 | 0 | 0 | 1 | 0 | 222 | | 3-<4 | 30 | 0 | 2 | 67 | 51 | 60 | 16 | 8 | 3 | 3 | 9 | 0 | 1 | 0 | 0 | 0 | 3 | 5 | 258 | | 4-<5 | 51 | 0 | 4 | 6 | 120 | 78 | 47 | 27 | 28 | 3 | 6 | 0 | 2 | 0 | 0 | 0 | 0 | 1 | 373 | | 5-<6 | 87 | 2 | 4 | 8 | 14 | 249 | 92 | 149 | 79 | 33 | 122 | 5 | 15 | 2 | 0 | 23 | 11 | 6 | 901 | | 6-<7 | 36 | 0 | 1 | 2 | 3 | 2 | 98 | 88 | 72 | 32 | 45 | 10 | 14 | 1 | 2 | 3 | 1 | 9 | 419 | | 7-<8 | 31 | 1 | 1 | 4 | 0 | 1 | 6 | 112 | 61 | 60 | 70 | 19 | 32 | 7 | 5 | 13 | 2 | 2 | 427 | | 8-<9 | 26 | 0 | 0 | 1 | 0 | 1 | 2 | 2 | 87 | 42 | 107 | 32 | 56 | 7 | 4 | 18 | 5 | 2 | 392 | | 9-<10 | 10 | 0 | 0 | 0 | 0 | 0 | 0 | 0 | 0 | 67 | 35 | 24 | 23 | 18 | 13 | 9 | 14 | 4 | 217 | | 10-<11 | 48 | 0 | 0 | 3 | 0 | 6 | 2 | 2 | 9 | 4 | 254 | 23 | 100 | 31 | 28 | 156 | 165 | 7 | 838 | | 11-<12 | 3 | 0 | 0 | 0 | 1 | 1 | 0 | 0 | 1 | 0 | 2 | 22 | 9 | 14 | 7 | 10 | 16 | 3 | 89 | | 12-<13 | 5 | 0 | 0 | 0 | 0 | 0 | 0 | 0 | 0 | 0 | 2 | 0 | 21 | 4 | 15 | 38 | 22 | 1 | 108 | | 13-<14 | 1 | 0 | 1 | 0 | 0 | 0 | 0 | 0 | 0 | 1 | 0 | 0 | 0 | 5 | 2 | 8 | 11 | 0 | 29 | | 14-<15 | 5 | 0 | 0 | 0 | 1 | 0 | 0 | 0 | 1 | 0 | 1 | 0 | 0 | 1 | 15 | 3 | 20 | 3 | 50 | | 15-<16 | 14 | 0 | 0 | 0 | 0 | 1 | 0 | 1 | 2 | 0 | 5 | 0 | 3 | 1 | 1 | 46 | 120 | 3 | 197 | | >=16 | 43 | 0 | 0 | 0 | 0 | 1 | 1 | 0 | 0 | 0 | 4 | 0 | 2 | 2 | 1 | 15 | 582 | 24 | 675 | | Total | 466 | 14 | 98 | 145 | 243 | 423 | 267 | 390 | 344 | 246 | 666 | 136 | 278 | 93 | 93 | 342 | 974 | 71 | 5289 |
|