|
Preliminary data on India’s balance of payments (BoP) for the first quarter (Q1) of the financial year 2007-08 i.e., April-June 2007, are now available. Full details of the BoP data in the standard format of presentation are set out in Statement 1 and Statement 2.
It may be recalled that, in recognition of the growing importance of services, data on a number of services such as business services, financial services and communication services, which were earlier part of the miscellaneous item, have been presented separately in the BoP press release from September 29, 2006. In order to further provide the disaggregated services data, the break-up of business services has been presented in this press release (Table 3.1).
Furthermore, the data on Non-Resident Ordinary (NRO) account were earlier included under ‘Other Capital’ in the capital account. With the reporting system to record these data separately put in place, these have now been included under the Non-Resident Indian (NRI) deposits.
The BoP developments during the Q1 of 2007-08 are set out in the following paragraphs.
April-June 2007
The major items of the BoP for Q1 of 2007-08 are set out in Table 1 and details are in Statement 1.
|
Table 1: Major Items of India's Balance of Payments
(US $ million)
|
|
Item
|
2007-08
April-June P
|
2006-07
April-June PR
|
2006-07
April-March P
|
2005-06
April-March PR
|
|
1
|
2
|
3
|
4
|
5
|
|
Exports
|
34,960
|
29,674
|
127,090
|
105,152
|
|
Imports
|
56,540
|
46,620
|
191,995
|
156,993
|
|
Trade Balance
|
-21,580
|
-16,946
|
-64,905
|
-51,841
|
|
Invisibles, net
|
16,883
|
12,379
|
55,296
|
42,655
|
|
Current Account Balance
|
-4,697
|
-4,567
|
-9,609
|
-9,186
|
|
Capital Account*
|
15,897
|
10,946
|
46,215
|
24,238
|
|
Change in Reserves
(- Indicates increase)#
|
-11,200
|
-6,379
|
-36,606
|
-15,052
|
|
*: Including errors and omissions. #: On BoP basis excluding valuation.
P: Preliminary PR: Partially Revised.
|
Merchandise Trade
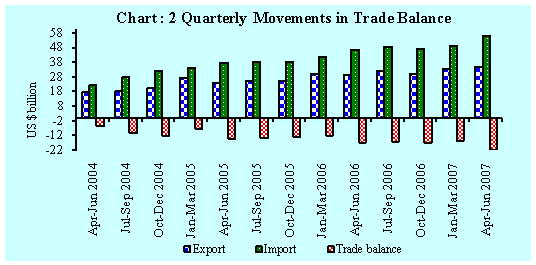
- On BoP basis, India’s Merchandise exports posted a relatively moderate growth of 17.8 per cent in Q1 of 2007-08 as compared with 23.7 per cent in Q1 of 2006-07.
- Import payments, on BoP basis, maintained the trajectory and recorded 21.3 per cent growth in Q1 of 2007-08 (22.9 per cent in Q1 of 2006-07).
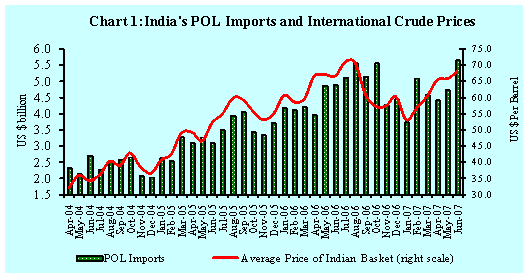
- According to the data released by the Directorate General of Commercial Intelligence and Statistics (DGCI&S), while oil imports recorded a moderate growth of 8.0 per cent in Q1 of 2007-08 (45.2 per cent in Q1 of 2006-07), non-oil imports recorded a strong growth of 47.4 per cent (8.9 per cent in Q1 of 2006-07).
- The Indian basket of crude oil prices averaged at US $ 66.3 per barrel during Q1 of 2007-08 as compared with US $ 66.8 per barrel in the Q1 of 2006-07 (Chart 1).
Trade Deficit
- On BoP basis, trade deficit, increased to US $ 21.6 billion in Q1 of 2007-08 (US $ 16.9 billion in Q1 of 2006-07) (Chart 2). According to DGCI&S data, the increase in trade deficit was mainly on account of non-oil imports.
Invisibles
- Invisible receipts, comprising services, current transfers and income, showed a steady growth in Q1 of 2007-08, while payments recorded some moderation in growth.
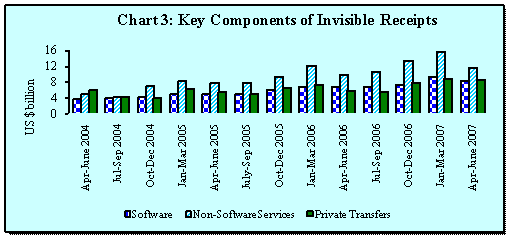
- Invisible receipts rose by 27.5 per cent in Q1 of 2007-08 (23.7 per cent in Q1 of 2006-07) mainly due to momentum maintained in the growth of software services, travel earnings, other professional and business services, along with the steady inflow of remittances from overseas Indians (Table 2 and Chart 3).
- Travel earnings showed a growth of 22.2 per cent in Q1 of 2007-08 as compared with 19.0 per cent in Q1 of 2006-07, mainly reflecting the pattern in tourist arrivals.
- Other professional and business services, which mainly comprise of services such as merchanting, trade related services, legal services, accounting, auditing, book keeping and tax consulting, business and management services, advertising, research and development services, architectural, engineering and other technical services, also witnessed the continued expansion in exports.
|
Table 2: Invisible Gross Receipts and Payments
(US $ million)
|
|
Item
|
Invisible Receipts
|
Invisible Payments
|
|
|
2007-08
April-
June P
|
2006-07
April-
June PR
|
2006-07
April-
March P
|
2005-06
April-
March PR
|
2007-08
April-
June P
|
2006-07
April-
June PR
|
2006-07
April-
March P
|
2005-06
April-
March PR
|
|
1
|
2
|
3
|
4
|
5
|
6
|
7
|
8
|
9
|
|
Travel
|
2,088
|
1,708
|
9,423
|
7,853
|
1,881
|
1,488
|
7,235
|
6,464
|
|
Transportation
|
2,208
|
1,734
|
8,069
|
6,291
|
2,692
|
2,048
|
8,857
|
7,841
|
|
Insurance
|
417
|
239
|
1,200
|
1,050
|
184
|
128
|
641
|
1,028
|
|
Govt. not included elsewhere
|
96
|
57
|
273
|
309
|
112
|
81
|
417
|
506
|
|
Transfers
|
8,760
|
5,992
|
28,861
|
25,228
|
433
|
300
|
1,446
|
944
|
|
Income
|
2,611
|
1,645
|
8,972
|
5,662
|
3,205
|
2,923
|
13,818
|
11,172
|
|
Investment Income
|
2,475
|
1,580
|
8,574
|
5,486
|
2,961
|
2,727
|
12,856
|
10,407
|
|
Compensation of Employees
|
136
|
65
|
398
|
176
|
244
|
196
|
962
|
765
|
|
Miscellaneous
|
15,252
|
13,268
|
62,365
|
45,901
|
6,042
|
5,296
|
31,453
|
21,684
|
|
Of Which: Software
|
8,441
|
7,039
|
31,300
|
23,600
|
557
|
438
|
2,502
|
1,338
|
|
Total
|
31,432
|
24,643
|
119,163
|
92,294
|
14,549
|
12,264
|
63,867
|
49,639
|
|
P: Preliminary PR: Partially Revised.
|
- Private transfer receipts comprising mainly remittances from Indians working overseas were higher at US $ 8.6 billion in Q1 of 2007-08 than US $ 5.9 billion in Q1 of 2006-07.
- Invisible payments grew by 18.6 per cent in Q1 of 2007-08 on account of surge in travel related payments, business and management consultancy services, engineering and technical services and dividend and profit payouts.
- Payments relating to travel services by the Indians travelling abroad, including categories of travel such as business, health and education related, basic travel quota, rose by 26.4 per cent in Q1 of 2007-08 as compared with 10.4 per cent in Q1 of 2006-07.
- The non-software miscellaneous receipts stood at US $ 6.8 billion in Q1 of 2007-08 as compared with US $ 6.2 billion in Q1 of 2006-07 (Table 3).
|
Table 3: Break-up of Non-Software Miscellaneous Receipts and Payments
(US $ million)
|
|
Item
|
Receipts
|
Payments
|
|
2007-08
April-
June P
|
2006-07
April-
June PR
|
2006-07
April-
March P
|
2005-06
April-
March PR
|
2007-08
April-
June P
|
2006-07
April-
June PR
|
2006-07
April-
March P
|
2005-06
April-
March PR
|
|
1
|
2
|
3
|
4
|
5
|
6
|
7
|
8
|
9
|
|
Communication Services
|
513
|
444
|
2,068
|
2,182
|
200
|
108
|
719
|
808
|
|
Construction
|
86
|
96
|
397
|
916
|
167
|
235
|
807
|
853
|
|
Financial
|
883
|
622
|
3,213
|
1,704
|
858
|
317
|
1,832
|
1,308
|
|
News Agency
|
122
|
98
|
438
|
339
|
154
|
42
|
245
|
306
|
|
Royalties, Copyrights & License Fees
|
34
|
28
|
164
|
129
|
220
|
221
|
1,164
|
729
|
|
Business Services
|
4,479
|
4,565
|
23,459
|
12,858
|
3,610
|
3,174
|
20,200
|
10,496
|
|
Personal,Cultural, Recreational
|
77
|
44
|
251
|
128
|
34
|
28
|
131
|
97
|
|
Others
|
617
|
332
|
1,075
|
4,045
|
242
|
733
|
3,853
|
5,749
|
|
Total
|
6,811
|
6,229
|
31,065
|
22,301
|
5,485
|
4,858
|
28,951
|
20,346
|
|
P: Preliminary PR: Partially Revised.
|
- Business services receipts and payments were mainly driven by trade related services, business and management consultancy services, architectural and engineering services and other technical services, and office maintenance services (Table 3.1). These reflect the underlying momentum in trade of professional and technology related services.
|
Table 3.1: Details of Business Services*
(US $ million)
|
|
Item
|
Receipts
|
Payments
|
|
|
2007-08
April-
June P
|
2006-07
April-
June PR
|
2006-07
April-
March P
|
2005-06
April-
March PR
|
2007-08
April-
June P
|
2006-07
April-
June PR
|
2006-07
April-
March P
|
2005-06
April-
March PR
|
|
1
|
2
|
3
|
4
|
5
|
6
|
7
|
8
|
9
|
|
Total
|
4,479
|
4,565
|
23,459
|
12,858
|
3,610
|
3,174
|
20,200
|
10,496
|
|
Of Which:
|
|
|
|
|
|
|
|
|
|
Trade Related
|
380
|
272
|
1,388
|
888
|
406
|
22
|
1,849
|
1,498
|
|
Business & Management Consultancy
|
1,393
|
1,424
|
8,370
|
3,721
|
939
|
621
|
5,501
|
2,120
|
|
Architectural, Engineering & other technical
|
1,297
|
1,390
|
7,704
|
4,639
|
593
|
605
|
3,833
|
1,641
|
|
Maintenance of offices
|
664
|
1,056
|
2,684
|
1,490
|
438
|
640
|
2,683
|
1,746
|
|
* The data are provisional and would subsequently get firmed up and revised.
P: Preliminary PR: Partially Revised.
|
- Investment income payments, reflecting mainly the interest payments on commercial borrowings, external assistance and non-resident deposits, and reinvested earnings of the foreign direct investment (FDI) enterprises operating in India, amounted to US $ 3 billion in Q1 of 2007-08 (US $ 2.7 billion in Q1 of 2006-07).
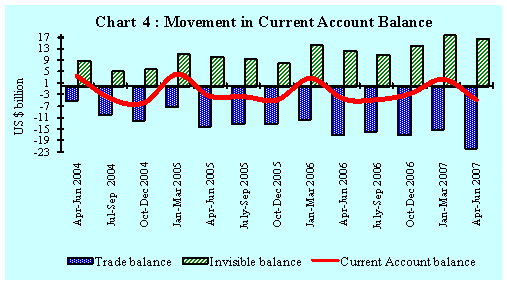
- Net invisibles (receipts minus payments), mainly led by higher growth in private transfers, at US $ 16.9 billion during Q1 of 2007-08, recorded a growth of 36.4 per cent as compared with 19.4 per cent in Q1 of 2006-07.
Current Account Deficit
- Despite large merchandise trade deficit, higher net invisible surplus mainly emanating from private transfers, contained the current account deficit at US $ 4.7 billion in Q1 of 2007-08, broadly the same as in Q1 of 2006-07 (Chart 4).
Capital Account and Reserves
- The balance of payments developments during Q1 of 2007-08 were dominated by the strong capital flows. The net capital flows at US $ 15.3 billion in Q1 of 2007-08 (US $ 10.6 billion in Q1 of 2006-07) remained buoyant reflecting the sustained momentum of domestic economic activity, better corporate performance, positive investment climate, long term view of India as the investment destination and favourable liquidity and interest rates in the global markets.
- The major sources of net capital flows were external commercial borrowings (ECBs) and equity inflows by foreign institutional investors (FIIs) (Table 4).
|
Table 4: Net Capital Flows
(US $ million)
|
|
Item
|
2007-08
April-June P
|
2006-07
April-June PR
|
2006-07
April-March P
|
2005-06
April-March PR
|
|
1
|
2
|
3
|
4
|
5
|
|
Foreign Direct Investment
|
461
|
1,416
|
8,437
|
4,730
|
|
Portfolio Investment
|
7,458
|
-505
|
7,062
|
12,494
|
|
External Assistance
|
258
|
49
|
1,770
|
1,682
|
|
External Commercial Borrowings
|
7,048
|
3,959
|
16,084
|
2,723
|
|
NRI Deposits*
|
-447
|
1,231
|
3,895
|
2,789
|
|
Short-term Credits
|
1,048
|
417
|
3,275
|
1,708
|
|
Others
|
-564
|
3,997
|
4,421
|
-2,726
|
|
Total
|
15,262
|
10,564
|
44,944
|
23,400
|
|
* Include Non-Resident Ordinary (NRO) deposits for April-June 2007.
P: Preliminary PR: Partially Revised.
|
- The net ECB inflows to India were at US $ 7 billion. ECBs inflows alone accounted for about 45.8 per cent of the total net capital flows, enabled by favourable liquidity and the interest rates in the global markets on the one hand, and rising financing requirements for capacity expansion domestically on the other hand.
- Direct investment showed strong bi-directional movement, reflecting higher FDI into India as well as overseas investments by the Indian companies.
- The inflows under FDI into India at US $ 5.9 billion during Q1 of 2007-08 (US $ 2.5 billion in Q1 of 2006-07) witnessed significant rise reflecting the continuing pace of expansion of domestic activities, positive investment climate and long term view of India as the investment destination. FDI was channelled mainly into services sector (37.3 per cent) followed by construction industry (21.9 per cent).
- Outward FDI of India also showed significant increase at US $ 5.4 billion in Q1 of 2007-08 (US $ 1.1 billion in Q1 of 2006-07) due to the appetite of Indian companies for global expansion.
- Due to large outward FDI, the net FDI (FDI to India minus FDI by India) was lower at US $ 0.5 billion in Q1 of 2007-08 than US $ 1.4 billion in Q1 of 2006-07.
- Net inflows by foreign institutional investors (FIIs) were US $ 7.1 billion during Q1 of 2007-08 reflecting the better corporate performance as well as strong domestic equity markets in consonance with the trends in Asian stock markets. The inflows under American depository receipts (ADRs)/global depository receipts (GDRs) amounted to US $ 308 million for April-June 2007. Net portfolio flows by India were at US $ 53 million. Taken together, net portfolio flows amounted to US $ 7.5 billion in Q1 of 2007-08.
- Among the components of banking capital, Non-Resident Indian (NRI) deposits witnessed a net outflow of US $ 447 million in Q1 of 2007-08, a turnaround from net inflow of US $ 1,231 million in Q1 of 2006-07, reflecting the impact of two downward revisions in ceiling interest rates during January 2007 and April 2007. While there were net inflows under Foreign Currency Non-Resident (Banks) [FCNR(B)] deposits, the higher magnitude of outflows under Non-Resident External Rupee Account NR(E)RA deposits resulted in overall net outflows.
- The data on Non-Resident Ordinary (NRO) account were earlier included under ‘Other Capital’ in the capital account. With the reporting system to record these data separately put in place, these have now been included under the Non-Resident Indian (NRI) deposits. NRO deposits in Q1 of 2007-08 amounted to US $ 116 million (Table 5).
|
Table 5: Net Inflows under Non Resident Ordinary (NRO) Deposits
(US $ million)
|
|
Year
|
Amount
|
|
1
|
2
|
|
2005-06 (April-March)
|
931
|
|
2006-07 (April-March)
|
427
|
|
2007-08 (April-June )
|
116
|
|
2006-07 (April-June )
|
70
|
- ‘Other capital’ comprises mainly difference between the custom data and the banking channel data, funds held abroad, and the residual item of other capital transactions not included elsewhere (n.i.e.). The residual item of other capital transactions n.i.e. mainly include suppliers’ credit up to 180 days, flows arising from cross-border financial derivative and commodity hedging transactions, migrant transfers (i.e., the movement of personal effects and financial assets arising from the change in residence status) and sale of intangible assets such as patents, copyrights, trademarks, etc. amounted to US $ 1.2 billion in Q1 of 2007-08. The details of other capital are set out in Table 6.
|
Table 6: Details of Other Capital
(US $ million)
|
|
Item
|
2007-08
(April-June) P
|
2006-07
(April-June) PR
|
2006-07
(April-March) P
|
2005-06
(April-March) PR
|
|
1
|
2
|
3
|
4
|
5
|
|
Total
|
1,152
|
305
|
6,391
|
-738
|
|
Lead and Lags in Exports
|
1,627
|
-523
|
1,772
|
-572
|
|
ADR/GDR/FCCB Repatriated
|
26
|
54
|
420
|
125
|
|
Net Funds Held Abroad
|
-493
|
-884
|
-2,053
|
-2,471
|
|
Advance Payments Imports
|
-1,692
|
-74
|
-59
|
-2,090
|
|
Other capital receipts not included elsewhere*
|
1,684
|
1,732
|
6,311
|
4,270
|
|
*: Includes suppliers’ credit up to 180 days, migrant transfers, derivatives, hedging, capital transfers.
P: Preliminary PR: Partially Revised.
|
Reserves Accretion
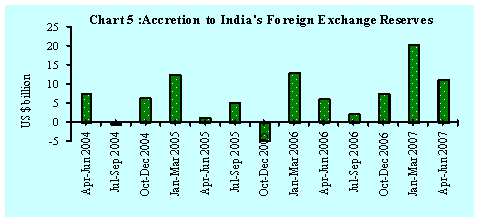
- Net accretion to foreign exchange reserves on BoP basis (i.e., excluding valuation) at US $ 11.2 billion in Q1 of 2007-08 was led mainly by strong capital inflows (Chart 5). Taking into account the valuation gain of US $ 3.0 billion, foreign exchange reserves recorded an increase of US $ 14.2 billion in Q1 of 2007-08 (US $ 11.3 billion in Q1 of 2006-07). [A Press Release on the sources of accretion to foreign exchange reserves is separately issued].
- At the end of June 2007, with outstanding foreign exchange reserves at US $ 213.4 billion, India held the fifth largest stock of reserves among the emerging market economies and sixth largest in the world.
Alpana Killawala
Chief General Manager
Press Release :2007-2008/438
|
 IST,
IST,


