 IST,
IST,


Developments in Co-operative Banking
The consolidated balance sheet of urban co-operative banks expanded moderately in 2018-19 on the back of robust deposit growth which financed the pick-up in lending. Although their asset quality and provisions improved, a fall in interest income adversely affected profitability. Among short-term rural co-operatives, the financial health of state co-operative banks and district central co-operative banks weakened on account of an increase in the non-performing assets and slowdown in profitability. The soundness indicators of long-term co-operatives remained fragile. 1. Introduction V.1 In keeping with their ‘grassroots’ integration into the life and ethos of the widest sections of society, co-operative banks in India are invested with developmental goals among which financial inclusion has assumed crucial importance. These institutions play a critical role in last-mile credit delivery and in extending financial services across the length and breadth of the country through their geographic and demographic outreach.  V.2 At the end of March 2019, credit co-operatives comprised 1,544 urban co-operative banks (UCBs) and 96,248 rural co-operative banks (end-March 20181), with the latter accounting for 64.7 per cent of the total assets of co-operatives (Chart V.1). V.3 UCBs and among the rural co-operatives, the State Co-operative Banks (StCBs) and the District Central Co-operative Banks (DCCBs) are registered either under the Co-operative Societies Act of the state concerned or under the Multi State Co-operative Societies Act, 2002. Banking laws were made applicable to co-operative societies since March 1, 1966. Currently, there is duality of control over StCBs/DCCBs/UCBs between the Registrar of Cooperative Societies (RCS) or the Central Registrar of Cooperative Societies (CRCS) and the Reserve Bank. While the mandates of the RCS/CRCS encompass incorporation, registration, management, recovery, audit, supersession of Board of Directors and liquidation, the Reserve Bank is invested with regulatory functions. The Reserve Bank is also entrusted with the responsibility of supervision of UCBs, entailing prescription of prudential norms for capital adequacy, income recognition, asset classification and provisioning, liquidity requirements and single/group exposure norms. In addition, it also helps in capacity building of employees and assist in implementation of IT infrastructure in UCBs. V.4 Primary Agricultural Credit Societies (PACS) and long-term co-operatives are outside the purview of the Banking Regulation Act, 1949. The NABARD has been given power under Section 35 (6) of the Banking Regulation Act to conduct inspections of StCBs and DCCBs. The NABARD also conducts voluntary inspections of State Co-operative Agriculture and Rural Development Banks (SCARDBs). V.5 The growth of these co-operative institutions has not been commensurate with that of other constituents of the banking sector in India. At the end of March 2018, the combined assets of urban and rural co-operatives were 10.6 per cent of the total assets of scheduled commercial banks (SCBs), down from 19.4 per cent in 2004-05. Several operational and governance-based impediments have operated as drags on their performance, stunting their growth. V.6 In this milieu, this chapter examines the performance of the urban co-operatives and rural credit co-operatives in the remaining five sections. Section 2 addresses the activities of UCBs from the point of view of their financial performance and asset quality. Section 3 reviews the performance of State Co-operative Banks (StCBs), District Central Co-operative Banks (DCCBs) and PACS. A brief description of long-term co-operatives is provided in section 4, notwithstanding the fact that they are outside the purview of the Reserve Bank’s regulation. Section 5 concludes with some overall perspectives. Detailed tables on balance sheets, financial performance indicators, asset quality and other salient indicators are presented in the appendix. V.7 Despite their large number, UCBs account for 3.6 per cent of the total assets of SCBs. Most of them are single branch entities, with limited avenues to raise capital. Successful international co-operative models highlights the role of umbrella organisation in strengthening the performance of co-operatives by providing a range of services like liquidity and capital support (Box V.1). V.8 Enabled by a liberal licensing policy, the period 1991-2004 saw phenomenal growth in UCBs’ number and asset size. Subsequently, this expansion turned unsustainable and some of them became weak and unviable over time. The Reserve Bank’s Vision Document 2005, adopted a multi-layered approach for bolstering the UCBs, including merger of weak UCBs with stronger ones and exit of unviable ones that has resulted in the state of consolidation that exists today (Chart V.2).
V.9 Maharashtra—which has the largest number of UCBs across states—accounted for the highest number of mergers (Chart V.3) V.10 Notwithstanding the fall in the number of UCBs, however, their combined asset size has continuously increased (Chart V.4). V.11 UCBs are classified for regulatory purposes into Tier-I and Tier-II categories, based on their depositor base6. Tier II UCBs have larger depositor bases and wider geographical presence than their Tier I counterparts. During 2018-19, the number of Tier II UCBs increased sharply (Table V.1).  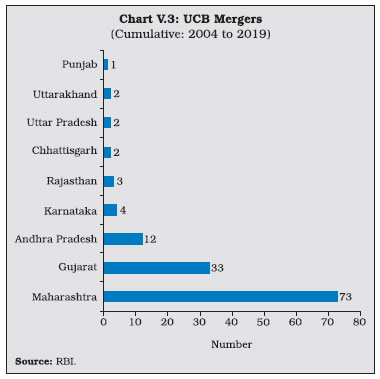 2.1 Balance Sheet V.12 The combined balance sheet of UCBs witnessed robust expansion underscoring the effectiveness of measures taken to strengthen their financials. However, in the recent years, UCBs’ assets growth has moderated (Chart V.5). V.13 In 2014-15, the distribution of UCBs became bi-modal, with concentration in two asset brackets viz., ₹ 25 crore to ₹ 50 crore and ₹ 100 crore to ₹ 250 crore. Since 2016-17, however, the distribution has become uni-modal, with the largest frequency concentrated at the ₹ 100 crore to ₹ 250 crore asset bracket. Moreover, there has been a rightward shift in the distribution, with the share of UCBs with assets greater than ₹ 1,000 crore increasing to 6.5 per cent in 2018-19 from 4.6 per cent in 2014-15 (Chart V.6). 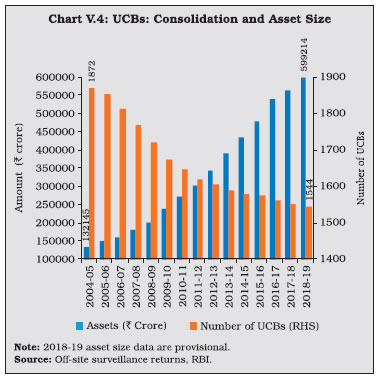 V.14 Deposits—which accounted for 89.5 per cent of the resource base7 of UCBs—revived during 2018-19 after a deceleration in the previous year (Chart V.7). Nonetheless, UCBs’ deposit growth remains well-below the average of 13.9 per cent achieved during 2007-08 to 2016-17. 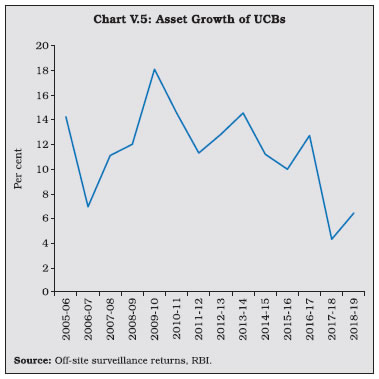 V.15 As deposit growth moderated during 2017-18, lending had to be financed by a steep increase in borrowings. This growth in borrowings reversed during 2018-19 as pick-up in deposit growth financed the increase in loans and advances (Table V.2). 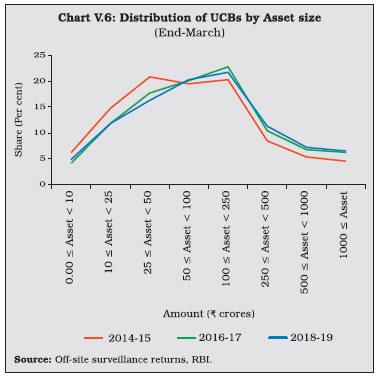 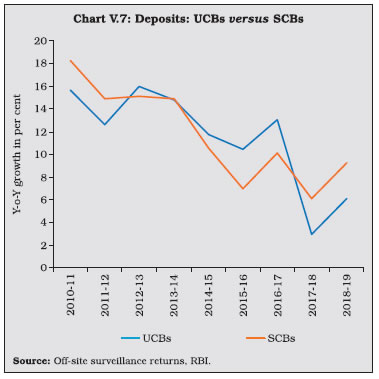 V.16 While UCBs with deposit bases upto ₹ 10 crore formed the modal class at the end of March 2008, the ₹ 100 crore to ₹ 250 crore bracket became the modal class at the end of March 2019 (Table V.3 and Chart V.8a). This suggests an increase in average deposit per account as well as an expansion of the customer base of UCBs. V.17 In contrast, UCBs with advances in the range of ₹ 10 crore to ₹ 25 crore formed the modal class during 2018-19 (Chart V.8b). V.18 Since 2015, the SLR requirements of UCBs are being reduced progressively in line with the prescription applicable to SCBs. Furthermore, since UCBs are governed by Basel I regulatory norms, the liquidity coverage ratio (LCR) requirement is not applicable to them. As SLR investments – constituting 88.9 per cent of total investments, primarily in central government securities – moderated over the last two years, overall investments also followed suit (Table V.4). However, non-SLR investments expanded by a faster pace. Incidentally, in August 2018, the list of eligible counterparties for trading in secondary market for this type of investment was widened. 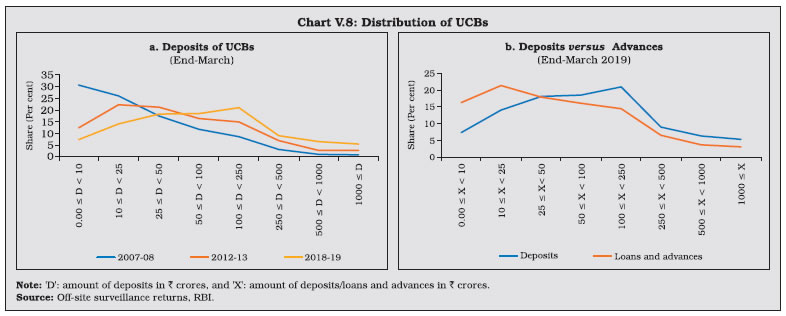 V.19 During 2016-17 and 2017-18, the incremental credit-to-deposit ratio of UCBs rose above those of SCBs, owing to the impact of high deposit growth on account of demonetisation in 2016-17 and lower credit growth of SCBs in the next year. This upturn was, however, reversed in 2018-19 with a pick-up in credit growth of SCBs (Chart V.9a). V.20 Since April 1, 2015 the balances of UCBs with DCCBs and StCBs ceased to be treated as SLR investments. Consequently, the investment-to-deposit ratio of UCBs fell below that of SCBs for the first time and remained so in subsequent years as well (Chart V.9b). 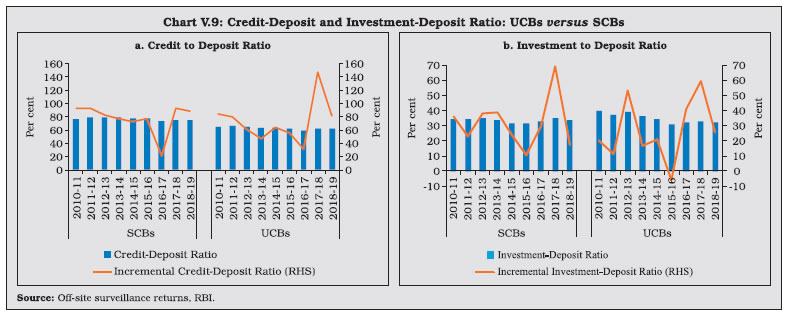 2.2 Soundness V.21 A CAMELS (capital adequacy; asset quality; management; earnings; liquidity; and systems and control) rating model is used to classify UCBs for regulatory and supervisory purposes8. UCBs in the top-ranking categories— with ratings A and B—accounted for 78 per cent of the sector (Table V.5). The share of UCBs in category A has, however declined in the last five years with a concomitant increase in category B banks. The share of UCBs in category D has remained in the range of 4 to 5 per cent in the last five years (Chart V.10). 2.3 Capital Adequacy V.22 Under the Basel I norms, UCBs are required to maintain a minimum statutory capital to risk weighted assets ratio (CRAR) of 9 per cent, with no additional requirements like capital conservation buffer and high common equity tier 1 (CET 1) capital ratio. As of end-March 2019, more than 96 per cent of UCBs maintained CRAR of 9 per cent and above (Table V.6). 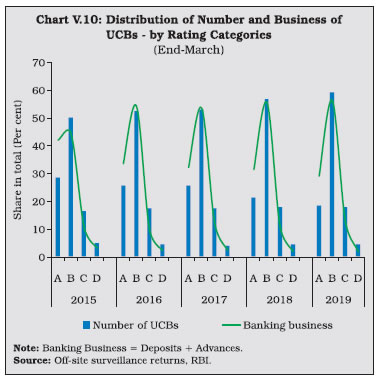 V.23 At a disaggregated level, non-scheduled UCBs (NSUCBs) that are characterised by lower asset size have better capital positions than scheduled UCBs (SUCBs). During 2018-19, the share of NSUCBs maintaining CRAR of 9 per cent and above was 96 per cent vis-a-vis 92 per cent for SUCBs. On the downside, however, four SUCBs had negative CRAR in that year (Chart V.11). Latest supervisory returns suggest deterioration in CRAR of SUCBs to 9.8 per cent in H1:2019-20 from 13.5 per cent inH1:2018-19. 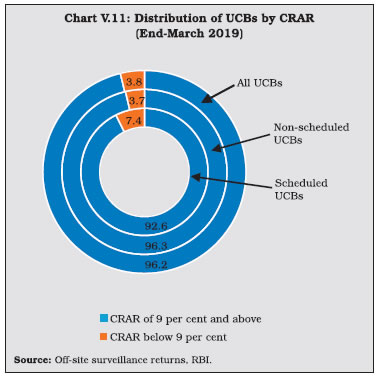 2.4 Asset Quality V.24 While UCBs had higher NPA ratio than SCBs till 2014-15, this was reversed on account of two distinct factors. First, the asset quality review (AQR), which resulted in better asset recognition of SCBs led to their NPA ratio rising to its true level. Second, the asset quality of UCBs has been gradually improving over time (Chart V.12). V.25 During 2018-19, UCBs registered moderate improvement in their asset quality, driven by the decline in the GNPA ratio of NSUCBs. Notwithstanding this improvement, the NSUCBs continue to have higher NPAs than SUCBs (Table V.7). SUCBs’ GNPA ratio deteriorated to 10.5 per cent in H1: 2019-20 reflecting large delinquencies in one of the fraud hit banks. V.26 Larger increase in provisions vis-à-vis GNPA enabled an improvement in UCBs’ provisioning coverage ratio (PCR) (Chart V.13). Given the elevated level of GNPA ratio in NSUCBs in comparison to SUCBs, the provisioning requirements of the former are correspondingly higher (Chart V.13). During H1: 2019-20, PCR of SUCBs reduced to 40.9 per cent from 48.4 per cent in H1:2018-19. 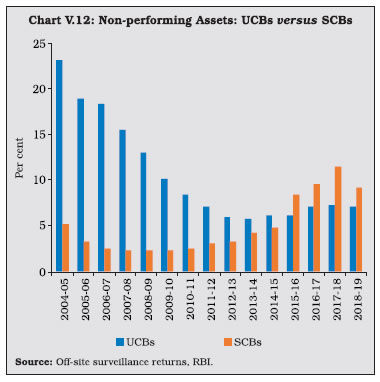 2.5 Financial Performance and Profitability V.27 UCBs recorded a decline in net profit after taxes in 2018-19. Interest expenses declined for the second consecutive year, notwithstanding a revival in deposit growth. The decline in interest income and interest expenses of all UCBs was driven by the NSUCBs whereas SUCBs registered a moderate growth in both. Non-interest income declined for both SUCBs and NSUCBs reflective of a decline in income from a host of fee-earning activities and loss on sale and trading of securities (Table V.8). 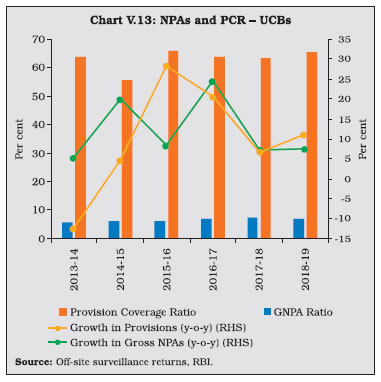 V.28 The profitability of UCBs, measured in terms of return on equity (RoE), deteriorated marginally, mainly on account of below par performance of NSUCBs (Table V.9). During H1:2019-20, SUCBs posted losses. V.29 Notwithstanding this decline, the profitability indicators of NSUCBs, except RoE, remained higher than those of their scheduled counterparts (Chart V.14). 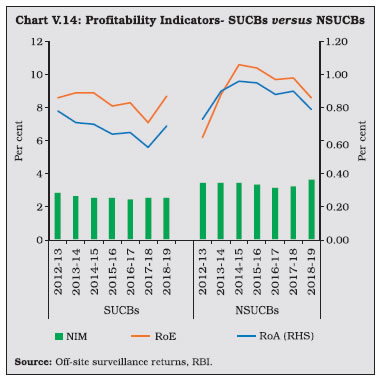 V.30 Bank-specific factors like credit risk, interest and non-interest income and the overall macroeconomic environment weigh in as the key determinants of UCBs’ profitability (Box V.2). 2.6 Priority Sector Advances V.31 The Reserve Bank revised guidelines on lending by UCBs to the priority sector9 effective May 10, 2018. New categories like credit to food and agro-processing units, medium enterprises, social infrastructure and renewable energy formed part of the priority sector. The distinction between direct and indirect credit was dispensed with and micro-credit ceased to be a separate category under the priority sector. V.32 Historically, UCBs’ lending to the priority sector has been higher than their prescribed priority sector targets. Despite inclusion of new categories in the priority sector targets, UCBs recorded a dip in the share of priority sector advances in total advances during 2018-19 but maintained it above the overall priority target of 40 per cent (Table V.10).
V.33 The composition of credit to the priority sector by UCBs shows that lending to micro, small and medium enterprises (MSMEs) accounted for 60.7 per cent of the total priority sector advances, followed by advances to housing. Given the urban focus of UCBs, their share of agricultural lending under the priority sector is low. V.34 UCBs are mandated to provide 10 per cent of adjusted net bank credit (ANBC) to weaker sections11. During 2018-19, credit to weaker sections fell below the minimum target of 10 per cent of ANBC and their share in overall lending to the priority sector also fell to 21 per cent. V.35 Rural co-operatives play an important role in delivering affordable institutional credit and promoting financial inclusion in underbanked areas through their geographical outreach. Short-term co-operatives primarily meet crop loan requirements whereas long-term co-operatives make credit available for capital formation in agriculture, rural industries and housing. Although the focus of rural co-operative lending is agriculture, the share of rural co-operatives to this category of loans —which was as high as 64 per cent in 1992-93—has fallen dramatically over the years while commercial banks have acquired a dominant position (Table V.11). V.36 As of March 2018, short-term cooperatives comprising StCBs, DCCBs and PACS accounted for 94.2 per cent of the total assets of rural co-operatives (Chart V.15). V.37 Long-term co-operatives comprise State Co-operative Agriculture and Rural Development Banks (SCARDBs) and Primary Co-operative Agriculture and Rural Development Banks (PCARDBs). Due to the limited range of credit products and relatively lower outreach, their share in the total assets of rural co-operatives has been declining over the years.  V.38 The structure of short-term rural cooperatives is largely federal – with StCBs acting as the apex body – whereas that of long-term co-operatives varies significantly across states. Presently, out of the thirteen fully functional SCARDBs, five (Gujarat, Jammu & Kashmir, Puducherry, Tripura and Uttar Pradesh) are unitary, i.e., they operate through their branches with no separate PCARDBs, six (Haryana, Karnataka, Kerala, Punjab, Rajasthan and Tamil Nadu) are federal where they operate through PCARDBs, and two (Himachal Pradesh and West Bengal) have mixed structure with SCARDBs operating through PCARDBs as well as through their branches. 3.1 Short-term Co-operatives V.39 Short-term co-operatives are arranged in a three-tier structure in most of the states, StCBs at the apex level, DCCBs at the intermediate level and PACS at the grassroots level. Deposits are the dominant component of the liability structure of StCBs, and especially of DCCBs whose extensive branch network enables higher deposit mobilisation. In the case of PACS, however, borrowings from StCBs and DCCBs are the key sources of funds12 (Chart V.16). 3.1.1 State Co-operative Banks V.40 StCBs are established in each state to mobilise deposits, provide liquidity support and offer technical assistance to DCCBs and PACS. In terms of size, StCBs account for 23 per cent of assets of short-term rural co-operatives and rely on the NABARD refinance facility as the major source of borrowings.  Balance Sheet Operations V.41 The consolidated balance sheet of StCBs contracted in 2017-18 on account of a decline in investments and cash and bank balances on the asset side. On the liability side, borrowings declined due to a fall in the short-term refinance support provided by NABARD. Deposits, which account for more than half of the liability side, decelerated during 2017-18, from a high base in the previous year when StCBs were allowed to garner deposits in the form of specified bank notes in the post-demonetisation period. On the assets side, StCBs unwound their investments to extend loans and advances especially against the backdrop of lower refinance support and muted deposits growth (Table V.13). V.42 The latest data available for scheduled StCBs show acceleration in both deposit and credit growth in 2018-19 (Table V.14). Profitability V.43 Net profits of StCBs decelerated during 2017-18 after a significant increase in the previous year. The slowdown mainly reflected a sharp increase in provisions and contingencies in consonance with deteriorating asset quality during the year. On the positive side, however, net interest income rose; although interest income decelerated, it was outweighed by the contraction in the interest expenses. Another positive factor was the slowdown in operating expenses, notwithstanding the acceleration in the wage bill. Consequently, operating profits of the StCBs reversed the contraction of the previous two years and grew in double digits (Table V.15). Asset Quality V.44 The asset quality of StCBs—as reflected in the NPA ratio—had been improving continuously since 2012-13, but it deteriorated during 2017- 18. Alongside significant accretions to NPAs, both the doubtful and loss component of NPAs also increased, notwithstanding an increase in the recovery-to-demand ratio (Table V.16). V.45 This deterioration is stark against the backdrop of improvement in asset quality of UCBs and SCBs (Chart V.17). V.46 From a regional perspective, there has been an increase in the NPA ratio in 2017-18 across all regions except in the north-eastern region (Chart V.18a). The all-India recovery-to-demand ratio improved for StCBs, driven by the northern, eastern and southern regions. (Chart V.18b). 3.1.2 District Central Co-operative Banks V.47 DCCBs—the intermediate tier in the short-term rural co-operatives structure—mobilise deposits from the public and provide credit to the public and PACS. DCCBs’ borrowings comprise of loans and advances from StCBs and direct refinancing from the NABARD. They have a large number of depositors, given their branch network. This also results in a lower credit-to-deposit ratio than StCBs (Chart V.19).  Balance Sheet Operations V.48 During 2017-18, the balance sheet of DCCBs decelerated on slowdown in deposits on the liabilities side, and in investments on the asset side. Loans and advances, which revived after a deceleration in the previous year, were funded mainly through reduction in cash and bank balances (Table V.17).   Profitability V.49 The net profit of DCCBs declined for the second consecutive year, though the pace of reduction slowed. This was mainly on account of higher provision requirements and slower growth in interest income (Table V.18). Asset Quality V.50 The asset quality of DCCBs deteriorated in 2017-18. Although there was a marginal deceleration in the growth of sub-standard and doubtful assets, they remained at elevated levels (Table V.19). The decline in the asset quality is attributable to farm loan waivers announced by various state governments13. Pari passu, the recovery to demand ratio of DCCBs declined during this period across all regions with the exception of the southern region (Chart V.20). V.51 DCCBs have persistently higher NPA ratios and lower recovery to demand ratio than StCBs (Chart V.21a). The share of agricultural lending in the portfolio of DCCBs is higher than that of StCBs; as such, their balance sheets are exposed to the volatility in agricultural prices and output. DCCBs also have a higher share of operating expenses in overall expenses than StCBs due to their district level presence, which requires larger staff costs (Chart V.21b). 3.1.3 Primary Agricultural Credit Societies (PACS) V.52 PACS form the third tier of short-term cooperatives. Apart from providing agricultural loans, they also arrange for the supply of agricultural inputs, distribution of consumer articles and marketing of produce for their members. V.53 The liabilities side of the consolidated balance sheet of PACS – both deposits and borrowings – decelerated sharply in 2017-18 (Appendix Table V.5). On the asset side, credit declined mainly on the back of contraction in short-term loans and deceleration in long-term advances. The share of agriculture in total lending of PACS is 54.9 per cent. (Appendix Table V.6). V.54 The losses of PACS outweighed their profits in 2017-18. The Southern region contributed around two-third of the total losses (Appendix Table V.6). V.55 PACS extend loans only to their members and therefore, borrower to member ratio is a useful indicator for access to and demand for credit. During 2017-18, the ratio declined to 38.8 per cent from 39.6 per cent in 2016- 17. The decline in the ratio was particularly striking in the case of ST members (Appendix Table V.7). 4. Long-term Rural Co-operatives V.56 Long-term rural co-operatives consist of State Co-operative Agriculture and Rural Development Banks (SCARDBs) operating at the state level and Primary Co-operative Agriculture and Rural Development Banks (PCARDBs) operating at the district/block level. These institutions play an important role in agricultural development by purveying long-term credit for capital. As of end-March 2018, there were 13 SCARDBs and 601 PCARDBs across the country.   4.1 State Co-operative Agriculture and Rural Development Banks (SCARDBs) V.57 The consolidated balance sheet of SCARDBs contracted during 2017-18 in contrast to an expansion in the previous year (Appendix Table V.8). SCARDBs continued to report net losses for the second consecutive year (Appendix Table V.9). Asset quality, measured in terms of the NPA ratio, also deteriorated (Appendix Table V.10). Among the states, Kerala maintained the highest recovery rate and the lowest NPA ratio, while Haryana had the highest NPA ratio (Appendix Table V.11) 4.2 Primary Co-operative Agriculture and Rural Development Banks (PCARDBs) V.58 The balance sheet of PCARDBs, which showed signs of revival in 2016-17, deteriorated in 2017-18 (Appendix Table V.12). PCARDBs posted operating profits due to moderation in operating expenses reversing the operating losses of the previous year (Appendix Table V.13). Like the SCARDBs, the NPA ratio of PCARDBs also deteriorated (Appendix Table V.14). V.59 The year 2018-19 turned out to be one of consolidation and expansion in balance sheets for UCBs, along with an improvement in asset quality and provision coverage ratio. Driving this improvement were various measures taken by the government and the Reserve Bank to strengthen this sector’s performance and financial health. Recently, the unearthing of irregularities in one of the UCBs has brought to the forefront issues relating to low capital base, weak corporate governance, inability to prevent frauds, slower adoption of new technology and inadequate system of checks and balances. Going forward, UCBs need to break out of these drags. The highest priority needs to be assigned to the establishment of a uniform regulatory and supervisory structure and an umbrella organisation in the architecture, which will provide liquidity and capital support and galvanise the spread of and leveraging on IT infrastructure and other capacity and skill building facilities. V.60 Looking ahead, the co-operative sector faces dual challenges: first, increasing competition from not only SCBs but also from small finance banks and payments banks; and second, vulnerability stemming from internal weaknesses including the inability to prevent frauds. Although this sector accounts for just 10.6 per cent of the commercial banking sector, the need to strengthen it from the financial stability point of view cannot be overemphasised, given its predominant domestic orientation, its massive financial inclusion quotient and its sheer presence across the country, especially in lower tier towns and villages. In view of this important role, there is a need to undertake reforms aimed at upgrading corporate governance and strengthening their financials. 1 Data on rural co-operatives are available with a lag of one year, the latest being for 2017-18. 2 Source: FSI Insights on policy implementation No 15. 3 The definition of small and medium enterprises varies across jurisdictions. 4 Source: European Association of Co-operative Banks: Key Statistics – Financial Indicators 2018. 5 See Working Group to Examine Issues Relating to Augmenting Capital of UCBs, 2006 (Chairman: N.S. Vishwanathan); Working Group on Umbrella Organization and Constitution of Revival Fund for Urban Co-operative Banks, 2008 (Chairman: V.S. Das); Expert Committee on Licensing of New Urban Co-Operative Banks, 2011 (Chairman: Y.H. Malegam); High Powered Committee on Urban Co-operative Banks, 2015 (Chairman: R. Gandhi). 6 Tier-I UCBs are defined as: a) deposit base below ₹ 100 crore operating in a single district, or deposit base below ₹ 100 crore operating in more than one district, provided that the branches of the bank are in contiguous districts, and deposits and advances of branches in one district separately constitute at least 95 per cent of the total deposits and advances, respectively; b) deposit base below ₹ 100 crore, with branches originally in a single district which subsequently became multi-district in their operations due to a re-organisation of the district. All other UCBs are defined as Tier-II UCBs. 7 Resource base comprises capital, reserves, deposits and borrowings. 8 CAMELS rating model gives a composite rating of A/B/C/D (in decreasing order of performance) to UCBs, based on the weighted average rating of the individual components of CAMELS. 9 UCBs are required to meet the target for lending to the total priority sector of 40 per cent of Adjusted Net Bank Credit (ANBC) or credit equivalent of off-balance sheet exposure, whichever is higher. Within the priority sector, the target of 10 per cent and 7.5 per cent of ANBC or credit equivalent of off-balance sheet exposure, whichever is higher, has been prescribed for weaker sections and micro enterprises. 10 SUCBs account for 47 per cent of the assets of UCB sector as at end-March 2019. 11 Priority sector loans to the following borrowers will be considered under the weaker sections category: artisans; village and cottage industries where individual credit limits do not exceed ₹ 1 lakh; scheduled castes and scheduled tribes; self help groups; distressed farmers indebted to non-institutional lenders; distressed persons other than farmers, with loan amount not exceeding ₹ 1 lakh per borrower to prepay their debt to non-institutional lenders; women; persons with disabilities; overdrafts upto ₹ 5,000 under Pradhan Mantri Jan-Dhan Yojana (PMJDY) accounts, provided the borrowers’ household annual income does not exceed ₹ 100,000 for rural areas and ₹ 1,60,000 for non-rural areas. 12 The source of funds of rural co-operatives comprises owned funds (capital and reserves), deposits and borrowings. 13 During 2017-18, Government of Maharashtra, Karnataka, Uttar Pradesh and Punjab announced debt waiver for farmers. |

இந்த பக்கத்தை பகிரவும்:


இந்திய ரிசர்வ் வங்கி மொபைல் செயலியை நிறுவுங்கள் மற்றும் சமீபத்திய செய்திகளுக்கான விரைவான அணுகலை பெறுங்கள்!
எங்கள் செயலியை நிறுவ QR குறியீட்டை ஸ்கேன் செய்யவும்


கடைசியாக புதுப்பிக்கப்பட்ட பக்கம்:


