The Inflation Expectations Survey of Households for the January-March 2013 quarter (31st round) captures the inflation expectations of 5,000 urban households across 16 cities, for the next three-month and for the next one-year period. These expectations are based on their individual consumption baskets and hence, these rates should not be considered as predictors of any official measure of inflation. The households’ inflation expectations provide useful directional information on near-term inflationary pressures and also supplement other economic indicators to get a better indication of future inflation.
Highlights:
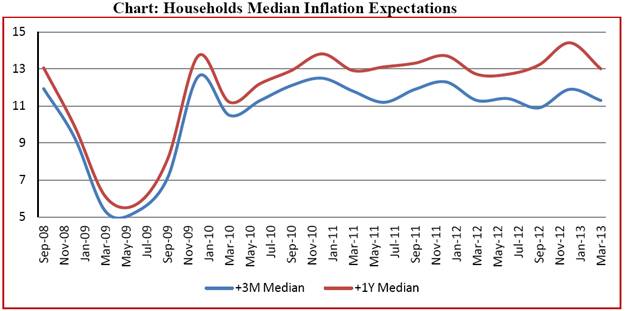
i. The three-month ahead and one-year ahead mean and median inflation expectation of households decreased in the March 2013 round as compared with the previous round (Chart).
*: Last two quarter results are compiled based on information for 16 cities, results for earlier quarters were compiled based on information for 12 cities.
ii. The proportion of respondents expecting price rise by ‘more than current rate’ has decreased for three-month ahead as well as one-year ahead period for general prices as well as for various product-groups (Food products, Non-food products, Household durables, Housing and Cost of services).
iii. There was no major variation in the inflation expectations across gender, age- group and occupation category of respondents, but financial sector employees expect the lowest inflation whereas daily workers expect highest inflation.
iv. City-wise inflation expectations varied to some extent. While Western and Southern region of India expect high inflation, Eastern region expects relatively lower inflation.
v. On future inflation expectations, 53 per cent (64 per cent in last round) households for three-month ahead and 72 per cent (78 per cent in last round) households for one-year ahead expected double digit inflation.
vi. On the awareness of the RBI action to control inflation, 63 per cent (49 per cent in last round) of the respondents were aware of the role of RBI in controlling inflation; 33 per cent (25 per cent in last round) felt that RBI is taking necessary action. Among these 33 per cent, 44 per cent (36 per cent in last round) reported that RBI’s action has an impact on controlling inflation.
vii. While 77 per cent of respondents expected that their income/wages would increase in the next one-year, 25 per cent of respondents expected an increase in next three-month period.
Tables
Table 1: Respondents’ Profile (Category): Share in Total Sample |
Category of Respondents |
Share in Total (%) (12 Cities) |
Share in Total (%) (16 cities) |
Target Share (%) |
Financial Sector Employees |
8.6 |
8.8 |
10.0 |
Other Employees |
18.0 |
17.6 |
15.0 |
Self-employed |
20.1 |
20.3 |
20.0 |
Housewives |
29.6 |
29.4 |
30.0 |
Retired Persons |
8.9 |
9.0 |
10.0 |
Daily Workers |
9.5 |
9.5 |
10.0 |
Others |
5.4 |
5.3 |
5.0 |
| Note: The above sample proportion is for the quarter ended March 2013 survey |
Table 2: Product-wise Expectations of Prices for Three-month ahead and One-year ahead |
(Percentage of respondents) |
Round No./ survey period |
28 |
29 |
30 (12 cities) |
30 (16 cities) |
31(12 Cities) |
31(16 Cities) |
28 |
29 |
30 (12 cities) |
30 (16 cities) |
31 (12 cities) |
31(16 cities) |
(quarter ended) → |
Jun- 12 |
Sep- 12 |
Dec-12 |
Dec- 12 |
Mar- 13 |
Mar- 13 |
Jun-12 |
Sep-12 |
Dec-12 |
Dec-12 |
Mar-13 |
Mar-13 |
Options: General |
Three-month ahead |
One-year ahead |
Prices will increase |
99.0 |
98.9 |
98.4 |
98.5 |
99.3 |
99.4 |
99.5 |
99.1 |
98.6 |
98.8 |
98.4 |
98.7 |
- more than current rate |
83.6 |
78.9 |
73.6 |
75.7 |
65.2 |
66.9 |
84.4 |
86.8 |
82.1 |
84.7 |
73.2 |
74.8 |
- similar to current rate |
11.2 |
14.5 |
19.1 |
17.9 |
28.8 |
24.2 |
10.5 |
7.6 |
11.6 |
10.1 |
20.6 |
17.0 |
- less than current rate |
4.2 |
5.5 |
5.7 |
4.9 |
5.2 |
8.2 |
4.6 |
4.8 |
4.9 |
4.1 |
4.7 |
6.9 |
No change in prices |
1.0 |
1.1 |
1.5 |
1.4 |
0.6 |
0.5 |
0.4 |
0.8 |
1.2 |
1.1 |
1.5 |
1.2 |
Decline in price |
0.1 |
0.1 |
0.1 |
0.1 |
0.1 |
0.1 |
0.1 |
0.1 |
0.2 |
0.1 |
0.1 |
0.1 |
Options: Food Product |
Three-month ahead |
One-year ahead |
Prices will increase |
98.8 |
98.8 |
98.6 |
98.4 |
99.1 |
99.2 |
99.4 |
99.1 |
98.6 |
98.8 |
98.5 |
98.8 |
- more than current rate |
80.8 |
78.6 |
72.9 |
74.4 |
68.2 |
70.5 |
82.5 |
85.7 |
80.0 |
82.5 |
76.3 |
78.1 |
- similar to current rate |
14.3 |
15.5 |
21.1 |
19.8 |
26.8 |
22.8 |
12.6 |
9.9 |
14.7 |
12.8 |
18.2 |
15.9 |
- less than current rate |
3.7 |
4.7 |
4.6 |
4.2 |
4.2 |
6.0 |
4.3 |
3.5 |
4.0 |
3.5 |
4.1 |
4.8 |
No change in prices |
1.1 |
1.1 |
1.3 |
1.4 |
0.8 |
0.7 |
0.5 |
0.9 |
1.2 |
1.1 |
1.4 |
1.1 |
Decline in price |
0.1 |
0.2 |
0.1 |
0.2 |
0.1 |
0.1 |
0.1 |
0.1 |
0.2 |
0.1 |
0.1 |
0.1 |
Options: Non Food Product |
Three-month ahead |
One-year ahead |
Prices will increase |
97.8 |
98.1 |
96.9 |
96.7 |
98.8 |
98.5 |
99.3 |
99.0 |
98.0 |
98.1 |
98.8 |
99.0 |
- more than current rate |
72.6 |
70.0 |
62.1 |
63.3 |
58.6 |
58.6 |
79.9 |
80.3 |
76.2 |
78.0 |
71.7 |
71.6 |
- similar to current rate |
20.3 |
20.5 |
25.9 |
25.3 |
32.9 |
30.2 |
15.2 |
13.8 |
17.6 |
16.0 |
23.0 |
21.1 |
- less than current rate |
4.9 |
7.6 |
8.9 |
8.1 |
7.3 |
9.7 |
4.2 |
4.9 |
4.2 |
4.1 |
4.1 |
6.4 |
No change in prices |
2.2 |
1.9 |
2.9 |
3.0 |
1.1 |
1.4 |
0.6 |
1.0 |
1.9 |
1.8 |
1.1 |
0.9 |
Decline in price |
0.2 |
0.1 |
0.2 |
0.2 |
0.1 |
0.1 |
0.1 |
0.1 |
0.1 |
0.1 |
0.1 |
0.1 |
Options: Household Durables |
Three-month ahead |
One-year ahead |
Prices will increase |
94.3 |
86.9 |
90.7 |
90.2 |
93.1 |
93.3 |
96.3 |
94.9 |
96.1 |
96.2 |
94.4 |
95.4 |
- more than current rate |
63.5 |
49.9 |
48.5 |
50.7 |
43.7 |
45.0 |
66.9 |
60.9 |
58.9 |
61.7 |
54.1 |
56.3 |
- similar to current rate |
22.4 |
21.9 |
29.8 |
27.8 |
37.1 |
34.1 |
18.8 |
21.6 |
25.6 |
23.8 |
30.6 |
27.8 |
- less than current rate |
8.4 |
15.1 |
12.5 |
11.7 |
12.3 |
14.2 |
10.6 |
12.4 |
11.6 |
10.7 |
9.7 |
11.3 |
No change in prices |
5.1 |
11.7 |
8.9 |
9.2 |
6.5 |
6.3 |
3.4 |
4.7 |
3.6 |
3.4 |
5.2 |
4.2 |
Decline in price |
0.6 |
1.4 |
0.4 |
0.6 |
0.5 |
0.4 |
0.4 |
0.4 |
0.3 |
0.4 |
0.5 |
0.4 |
Options: Housing Prices |
Three-month ahead |
One-year ahead |
Prices will increase |
96.4 |
94.9 |
95.9 |
96.3 |
97.8 |
96.8 |
98.9 |
98.4 |
97.7 |
98.0 |
97.8 |
98.0 |
- more than current rate |
73.0 |
75.1 |
69.1 |
72.8 |
64.0 |
64.5 |
76.9 |
83.5 |
75.7 |
79.5 |
70.8 |
72.4 |
- similar to current rate |
18.3 |
14.8 |
19.9 |
17.7 |
25.8 |
22.7 |
16.8 |
10.7 |
14.7 |
12.5 |
21.8 |
19.7 |
- less than current rate |
5.1 |
5.0 |
6.9 |
5.7 |
8.0 |
9.6 |
5.2 |
4.2 |
7.3 |
6.0 |
5.2 |
5.9 |
No change in prices |
3.2 |
3.5 |
4.0 |
3.6 |
2.1 |
3.1 |
0.9 |
1.5 |
2.1 |
1.8 |
2.0 |
1.8 |
Decline in price |
0.5 |
1.7 |
0.1 |
0.1 |
0.1 |
0.1 |
0.2 |
0.1 |
0.2 |
0.2 |
0.2 |
0.1 |
Options: For Cost of Services |
Three-month ahead |
One-year ahead |
Prices will increase |
96.4 |
93.6 |
94.6 |
94.4 |
98.0 |
97.6 |
98.1 |
97.4 |
96.4 |
96.8 |
97.0 |
97.4 |
- more than current rate |
73.0 |
69.1 |
68.8 |
68.8 |
62.0 |
63.8 |
74.0 |
76.5 |
72.2 |
73.9 |
65.1 |
68.6 |
- similar to current rate |
18.3 |
17.8 |
19.0 |
18.7 |
27.3 |
24.7 |
18.5 |
14.5 |
17.7 |
16.3 |
26.6 |
23.1 |
- less than current rate |
5.1 |
6.7 |
6.9 |
6.9 |
8.7 |
9.1 |
5.6 |
6.5 |
6.5 |
6.6 |
5.4 |
5.7 |
No change in prices |
3.2 |
5.9 |
5.2 |
5.4 |
2.0 |
2.3 |
2.0 |
2.5 |
3.4 |
3.0 |
3.0 |
2.5 |
Decline in price |
0.5 |
0.5 |
0.2 |
0.2 |
0.1 |
0.1 |
0.1 |
0.1 |
0.2 |
0.2 |
0.1 |
0.1 |
Table 3: Expecting General Price Movements in Coherence with Movements in Price
Expectations of Various Product Groups: Three-month ahead and One-year ahead |
Round No. |
Survey Quarter ended |
Food |
Non-Food |
Households durables |
Housing |
Cost of services |
Three-month Ahead period |
28 |
Jun-12 |
90.5 |
84.5 |
73.2 |
82.8 |
82.6 |
29 |
Sep-12 |
90.9 |
86.0 |
60.5 |
83.3 |
81.1 |
30 (12 cities) |
Dec-12 |
89.0 |
83.1 |
66.6 |
83.6 |
85.8 |
30 (16 cities) |
Dec-12 |
89.5 |
82.6 |
67.2 |
84.2 |
83.6 |
31 (12 cities) |
Mar-13 |
84.3 |
85.6 |
68.4 |
79.7 |
83.3 |
31 (16 cities) |
Mar-13 |
85.5 |
83.7 |
68.1 |
80.0 |
82.5 |
One-year Ahead period |
28 (12 cities) |
Jun-12 |
92.5 |
88.0 |
77.1 |
85.1 |
87.1 |
29 (12 cities) |
Sep-12 |
95.9 |
90.3 |
69.5 |
91.0 |
87.2 |
30 (12 cities) |
Dec-12 |
95.1 |
88.2 |
73.8 |
88.5 |
88.4 |
30 (16 cities) |
Dec-12 |
95.4 |
88.2 |
74.0 |
89.7 |
87.2 |
31 (12 cities) |
Mar-13 |
90.8 |
89.1 |
75.8 |
85.1 |
85.3 |
31 (16 cities) |
Mar-13 |
90.7 |
88.3 |
76.9 |
85.3 |
85.6 |
Table 4: Household Inflation Expectations - Current, Three-month Ahead and One-year Ahead |
Survey Round |
Survey Quarter Ended |
Inflation rate in Per cent |
Current |
Three-month ahead |
One-year ahead |
Mean |
Median |
Std. Dev. |
Mean |
Median |
Std. Dev. |
Mean |
Median |
Std. Dev. |
27 |
Mar-12 |
11.0 |
10.2 |
4.1 |
11.7 |
11.3 |
3.9 |
12.5 |
12.7 |
3.8 |
28 |
Jun-12 |
11.3 |
10.2 |
3.9 |
12.0 |
11.4 |
3.7 |
12.8 |
12.7 |
3.4 |
29 |
Sep-12 |
10.6 |
9.7 |
3.8 |
11.5 |
10.9 |
3.6 |
12.7 |
13.2 |
3.5 |
30 (12 cities) |
Dec-12 |
10.9 |
10.3 |
3.4 |
11.7 |
11.6 |
3.5 |
12.8 |
13.9 |
3.7 |
30 (16 cities) |
Dec-12 |
11.0 |
10.4 |
3.4 |
11.9 |
11.9 |
3.4 |
13.3 |
14.4 |
3.4 |
31 (12 cities) |
Mar-13 |
10.5 |
10.0 |
3.5 |
11.2 |
10.9 |
3.5 |
12.2 |
12.3 |
3.6 |
31 (16 cities) |
Mar-13 |
10.7 |
10.3 |
3.7 |
11.3 |
11.3 |
3.6 |
12.5 |
13.0 |
3.6 |
@: Median values are calculated based on class-interval frequencies. |
Table 5 A : Various Group-wise Inflation Expectations for March 2013 Survey Round
(based on 12 cities) |
|
Current |
Three-month ahead |
One-year ahead |
Mean |
Median |
Std. Dev |
Mean |
Median |
Std. Dev |
Mean |
Median |
Std. Dev |
Gender-wise |
|
|
|
|
|
|
|
|
|
Male |
10.5 |
9.9 |
3.5 |
11.1 |
10.8 |
3.5 |
12.2 |
12.3 |
3.6 |
Female |
10.5 |
10.1 |
3.5 |
11.3 |
11.1 |
3.4 |
12.2 |
12.4 |
3.7 |
Category-wise |
|
|
|
|
|
|
|
|
|
Financial Sector Employees |
10.1 |
9.4 |
3.3 |
10.7 |
10.3 |
3.3 |
11.9 |
12.1 |
3.6 |
Other Employees |
10.5 |
9.9 |
3.5 |
11.1 |
10.8 |
3.6 |
12.2 |
12.2 |
3.6 |
Self Employed |
10.6 |
10.0 |
3.5 |
11.2 |
11.0 |
3.4 |
12.1 |
12.1 |
3.6 |
Housewives |
10.4 |
10.0 |
3.5 |
11.2 |
11.0 |
3.4 |
12.2 |
12.4 |
3.6 |
Retired Persons |
10.3 |
9.7 |
3.5 |
11.1 |
10.9 |
3.4 |
12.1 |
12.4 |
3.7 |
Daily Workers |
11.1 |
10.7 |
3.7 |
11.5 |
11.5 |
3.7 |
12.5 |
12.8 |
3.8 |
Other category |
10.6 |
10.1 |
3.6 |
11.4 |
11.3 |
3.4 |
12.4 |
12.7 |
3.5 |
Age-wise |
|
|
|
|
|
|
|
|
|
Up to 25 years |
10.7 |
10.2 |
3.6 |
11.5 |
11.3 |
3.5 |
12.6 |
12.9 |
3.5 |
25 to 30 years |
10.6 |
9.9 |
3.5 |
11.2 |
10.9 |
3.4 |
12.3 |
12.2 |
3.5 |
30 to 35 years |
10.6 |
10.1 |
3.5 |
11.1 |
11.0 |
3.5 |
12.2 |
12.4 |
3.6 |
35 to 40 years |
10.5 |
10.2 |
3.3 |
11.2 |
11.2 |
3.3 |
12.3 |
12.5 |
3.5 |
40 to 45 years |
10.5 |
10.0 |
3.5 |
11.2 |
11.0 |
3.5 |
11.9 |
12.2 |
4.0 |
45 to 50 years |
10.3 |
10.1 |
3.5 |
11.0 |
10.8 |
3.6 |
12.0 |
12.0 |
3.7 |
50 to 55 years |
10.1 |
9.5 |
3.5 |
10.8 |
10.4 |
3.5 |
11.7 |
11.4 |
3.6 |
55 to 60 years |
10.2 |
9.7 |
3.5 |
11.0 |
10.9 |
3.5 |
12.4 |
12.8 |
3.6 |
60 years and above |
10.3 |
9.5 |
3.6 |
11.0 |
10.6 |
3.5 |
11.9 |
12.2 |
3.7 |
City-wise |
|
|
|
|
|
|
|
|
|
Mumbai |
14.0 |
16.0 |
3.0 |
14.7 |
16.1 |
2.7 |
15.8 |
16.3 |
1.8 |
Delhi |
10.7 |
10.1 |
3.4 |
11.5 |
11.2 |
3.6 |
12.4 |
12.4 |
3.4 |
Chennai |
9.8 |
9.6 |
2.0 |
10.7 |
10.6 |
2.0 |
10.2 |
10.6 |
3.6 |
Kolkata |
7.3 |
7.0 |
1.5 |
7.6 |
7.7 |
1.7 |
8.4 |
8.6 |
2.0 |
Bangalore |
13.0 |
14.4 |
3.8 |
13.6 |
15.4 |
3.5 |
14.1 |
16.0 |
3.1 |
Hyderabad |
10.0 |
8.9 |
2.9 |
10.3 |
9.5 |
2.6 |
10.8 |
10.9 |
2.9 |
Ahmedabad |
9.2 |
9.0 |
1.7 |
11.1 |
10.6 |
1.9 |
15.1 |
15.8 |
1.7 |
Lucknow |
11.9 |
11.8 |
1.3 |
12.0 |
11.9 |
1.2 |
12.1 |
12.0 |
1.2 |
Jaipur |
11.5 |
12.0 |
5.2 |
11.7 |
13.0 |
4.9 |
14.9 |
16.3 |
3.1 |
Bhopal |
8.3 |
7.8 |
2.3 |
9.4 |
9.0 |
2.6 |
10.5 |
10.1 |
3.4 |
Patna |
13.2 |
13.2 |
1.3 |
13.4 |
13.4 |
1.1 |
13.9 |
14.1 |
1.0 |
Guwahati |
7.3 |
6.9 |
1.6 |
7.9 |
7.8 |
1.8 |
9.6 |
9.6 |
2.1 |
All (12 cities ) |
10.5 |
10.0 |
3.5 |
11.2 |
10.9 |
3.5 |
12.2 |
12.3 |
3.6 |
@: Median values are calculated based on class-interval frequencies. |
Table 5 B : Various Group-wise Inflation Expectations for March,2013 Survey Round(16 cities) |
|
Current |
Three-month ahead |
One-year ahead |
Mean |
Median |
Std. Dev |
Mean |
Median |
Std. Dev |
Mean |
Median |
Std. Dev |
Gender-wise |
Male |
10.8 |
10.2 |
3.6 |
11.3 |
11.3 |
3.6 |
12.6 |
13.1 |
3.6 |
Female |
10.7 |
10.3 |
3.7 |
11.4 |
11.3 |
3.6 |
12.4 |
12.9 |
3.7 |
Category-wise |
Financial Sector Employees |
10.3 |
9.7 |
3.5 |
10.9 |
10.7 |
3.5 |
12.3 |
12.7 |
3.6 |
Other Employees |
10.7 |
10.1 |
3.6 |
11.3 |
11.2 |
3.6 |
12.5 |
12.9 |
3.7 |
Self Employed |
10.9 |
10.5 |
3.6 |
11.5 |
11.4 |
3.6 |
12.6 |
13.1 |
3.6 |
Housewives |
10.7 |
10.3 |
3.7 |
11.3 |
11.3 |
3.6 |
12.4 |
12.9 |
3.7 |
Retired Persons |
10.5 |
9.9 |
3.6 |
11.3 |
11.3 |
3.5 |
12.4 |
13.0 |
3.7 |
Daily Workers |
11.2 |
10.8 |
3.7 |
11.7 |
11.8 |
3.7 |
12.8 |
13.8 |
3.7 |
Other category |
10.8 |
10.4 |
3.8 |
11.6 |
11.8 |
3.6 |
12.6 |
13.1 |
3.6 |
Age-wise |
Up to 25 years |
11.0 |
10.5 |
3.8 |
11.6 |
11.5 |
3.6 |
12.7 |
13.2 |
3.6 |
25 to 30 years |
10.9 |
10.3 |
3.7 |
11.4 |
11.2 |
3.6 |
12.6 |
12.9 |
3.5 |
30 to 35 years |
10.7 |
10.3 |
3.6 |
11.2 |
11.3 |
3.7 |
12.4 |
12.9 |
3.6 |
35 to 40 years |
10.7 |
10.4 |
3.6 |
11.4 |
11.5 |
3.5 |
12.5 |
12.9 |
3.6 |
40 to 45 years |
10.7 |
10.2 |
3.6 |
11.4 |
11.3 |
3.6 |
12.3 |
13.0 |
4.0 |
45 to 50 years |
10.5 |
10.3 |
3.6 |
11.1 |
11.1 |
3.6 |
12.2 |
12.6 |
3.7 |
50 to 55 years |
10.7 |
10.3 |
3.6 |
11.3 |
11.3 |
3.7 |
12.4 |
12.8 |
3.7 |
55 to 60 years |
10.2 |
9.7 |
3.4 |
11.1 |
11.1 |
3.4 |
12.8 |
13.6 |
3.4 |
60 years and above |
10.6 |
10.1 |
3.7 |
11.4 |
11.4 |
3.6 |
12.5 |
13.1 |
3.7 |
City-wise |
Mumbai |
14.0 |
16.0 |
3.0 |
14.7 |
16.1 |
2.7 |
15.8 |
16.3 |
1.8 |
Delhi |
10.7 |
10.1 |
3.4 |
11.5 |
11.2 |
3.6 |
12.4 |
12.4 |
3.4 |
Chennai |
9.8 |
9.6 |
2.0 |
10.7 |
10.6 |
2.0 |
10.2 |
10.6 |
3.6 |
Kolkata |
7.3 |
7.0 |
1.5 |
7.6 |
7.7 |
1.7 |
8.4 |
8.6 |
2.0 |
Bangalore |
13.0 |
14.4 |
3.8 |
13.6 |
15.4 |
3.5 |
14.1 |
16.0 |
3.1 |
Hyderabad |
10.0 |
8.9 |
2.9 |
10.3 |
9.5 |
2.6 |
10.8 |
10.9 |
2.9 |
Ahmedabad |
9.2 |
9.0 |
1.7 |
11.1 |
10.6 |
1.9 |
15.1 |
15.8 |
1.7 |
Lucknow |
11.9 |
11.8 |
1.3 |
12.0 |
11.9 |
1.2 |
12.1 |
12.0 |
1.2 |
Jaipur |
11.5 |
12.0 |
5.2 |
11.7 |
13.0 |
4.9 |
14.9 |
16.3 |
3.1 |
Bhopal |
8.3 |
7.8 |
2.3 |
9.4 |
9.0 |
2.6 |
10.5 |
10.1 |
3.4 |
Patna |
13.2 |
13.2 |
1.3 |
13.4 |
13.4 |
1.1 |
13.9 |
14.1 |
1.0 |
Guwahati |
7.3 |
6.9 |
1.6 |
7.9 |
7.8 |
1.8 |
9.6 |
9.6 |
2.1 |
Thiruvananthapuram |
10.5 |
10.0 |
1.9 |
12.6 |
12.6 |
1.8 |
15.0 |
15.2 |
1.4 |
Bhubaneswar |
9.1 |
6.5 |
4.9 |
7.3 |
6.7 |
2.9 |
9.6 |
8.1 |
3.6 |
Nagpur |
10.5 |
10.7 |
2.9 |
12.2 |
12.5 |
2.9 |
14.0 |
14.7 |
2.6 |
Kolhapur |
16.3 |
16.5 |
0.7 |
16.2 |
16.4 |
0.9 |
16.4 |
16.5 |
0.9 |
All |
10.7 |
10.3 |
3.7 |
11.3 |
11.3 |
3.6 |
12.5 |
13.0 |
3.6 |
| @: Median values are calculated based on class-interval frequencies. |
Table 6 A: Cross-tabulation of Current and Three-month Ahead Inflation Expectations (12 cities) |
(Number of respondents) |
|
Three-month ahead inflation rate (per cent) |
Current inflation rate (per cent) |
|
<1 |
1-2 |
2-3 |
3-4 |
4- 5 |
5- 6 |
6- 7 |
7- 8 |
8-9 |
9-10 |
10-11 |
11-12 |
12-13 |
13-14 |
14-15 |
15-16 |
>=16 |
No idea |
Total |
<1 |
1 |
2 |
|
|
|
|
|
|
|
|
|
|
|
|
|
1 |
|
|
4 |
1-2 |
2 |
1 |
1 |
|
1 |
|
|
|
|
|
|
|
|
|
|
|
|
|
5 |
2-3 |
|
|
2 |
2 |
2 |
|
|
1 |
|
|
|
|
|
|
|
|
|
|
7 |
3-4 |
1 |
|
|
3 |
3 |
3 |
|
1 |
|
|
|
|
|
|
|
|
1 |
2 |
14 |
4-5 |
|
|
|
2 |
14 |
9 |
4 |
3 |
|
|
|
|
|
|
1 |
|
1 |
2 |
36 |
5-6 |
1 |
|
1 |
|
8 |
39 |
61 |
9 |
6 |
6 |
4 |
1 |
1 |
|
|
|
1 |
|
138 |
6-7 |
1 |
|
|
1 |
|
8 |
118 |
242 |
63 |
22 |
12 |
2 |
|
|
|
1 |
2 |
1 |
482 |
7-8 |
4 |
|
|
|
|
2 |
25 |
158 |
241 |
73 |
21 |
2 |
2 |
|
|
1 |
3 |
2 |
534 |
8-9 |
2 |
|
|
|
|
1 |
1 |
13 |
177 |
184 |
56 |
13 |
2 |
2 |
|
1 |
|
7 |
459 |
9-10 |
3 |
|
|
|
|
|
|
3 |
5 |
72 |
176 |
38 |
17 |
4 |
1 |
2 |
2 |
|
332 |
10-11 |
2 |
|
|
|
|
1 |
1 |
|
1 |
3 |
71 |
215 |
33 |
19 |
9 |
5 |
3 |
|
363 |
11-12 |
|
|
|
2 |
|
|
1 |
|
|
5 |
8 |
131 |
131 |
45 |
13 |
2 |
2 |
|
340 |
12-13 |
|
|
|
|
|
|
|
|
|
|
|
1 |
121 |
139 |
51 |
7 |
6 |
|
325 |
13-14 |
|
|
|
|
|
|
|
|
|
|
|
|
|
95 |
53 |
8 |
5 |
1 |
162 |
14-15 |
|
|
|
|
|
|
|
2 |
2 |
4 |
1 |
|
|
5 |
69 |
38 |
15 |
|
136 |
15-16 |
2 |
|
|
|
|
|
|
1 |
1 |
|
|
|
1 |
|
|
29 |
62 |
2 |
98 |
>=16 |
4 |
|
|
|
|
|
2 |
|
2 |
3 |
1 |
1 |
2 |
3 |
3 |
5 |
531 |
8 |
565 |
| Total |
32 |
3 |
4 |
10 |
28 |
63 |
213 |
433 |
498 |
372 |
350 |
404 |
310 |
312 |
209 |
100 |
634 |
25 |
4000 |
Note: The shaded cells represent the number of respondents who expressed double digit current and three-month
ahead inflations. |
Table 6 B: Cross-tabulation of Current and Three-month Ahead Inflation Expectations (16 Cities) |
(Number of respondents) |
|
Three-month ahead inflation rate (per cent) |
Current inflation rate (per cent) |
|
<1 |
1-2 |
2-3 |
3-4 |
4-5 |
5- 6 |
6- 7 |
7- 8 |
8- 9 |
9-10 |
10-11 |
11-12 |
12-13 |
13-14 |
14-15 |
15-16 |
>=16 |
No idea |
Total |
<1 |
1 |
2 |
|
|
|
|
|
|
|
|
|
|
|
|
|
1 |
|
|
4 |
1-2 |
2 |
1 |
1 |
1 |
1 |
|
|
|
|
|
|
|
|
|
|
|
|
|
6 |
2-3 |
|
|
3 |
3 |
3 |
|
|
1 |
|
|
|
|
|
|
|
|
|
|
10 |
3-4 |
1 |
|
|
3 |
11 |
6 |
2 |
1 |
|
|
|
|
|
|
|
|
1 |
2 |
27 |
4-5 |
|
|
|
2 |
14 |
35 |
10 |
3 |
|
|
|
|
|
|
1 |
|
1 |
2 |
68 |
5-6 |
1 |
|
3 |
|
8 |
46 |
117 |
19 |
6 |
6 |
5 |
1 |
1 |
|
|
|
1 |
1 |
215 |
6-7 |
10 |
|
|
1 |
|
9 |
128 |
285 |
65 |
22 |
12 |
2 |
|
|
|
1 |
2 |
1 |
538 |
7-8 |
4 |
|
|
|
|
3 |
25 |
163 |
248 |
78 |
34 |
5 |
2 |
1 |
|
1 |
3 |
5 |
572 |
8-9 |
2 |
|
|
|
|
1 |
1 |
13 |
179 |
190 |
66 |
22 |
8 |
2 |
|
1 |
|
7 |
492 |
9-10 |
4 |
|
|
|
|
1 |
|
3 |
5 |
75 |
191 |
62 |
76 |
5 |
10 |
2 |
2 |
1 |
437 |
10-11 |
2 |
1 |
|
|
5 |
3 |
1 |
|
2 |
3 |
82 |
251 |
78 |
44 |
10 |
5 |
3 |
2 |
492 |
11-12 |
|
|
|
2 |
|
|
1 |
|
|
5 |
9 |
134 |
147 |
73 |
28 |
4 |
5 |
3 |
411 |
12-13 |
|
|
|
|
|
|
|
|
|
|
|
3 |
124 |
158 |
73 |
9 |
7 |
1 |
375 |
13-14 |
|
|
|
|
|
|
|
|
|
|
|
|
1 |
99 |
68 |
29 |
7 |
1 |
205 |
14-15 |
|
|
|
|
|
|
|
2 |
2 |
4 |
1 |
1 |
|
8 |
75 |
47 |
23 |
1 |
164 |
15-16 |
2 |
|
|
|
1 |
1 |
|
1 |
1 |
|
2 |
|
1 |
|
|
30 |
68 |
3 |
110 |
>=16 |
5 |
1 |
6 |
1 |
2 |
17 |
2 |
2 |
2 |
4 |
21 |
7 |
3 |
3 |
8 |
11 |
771 |
8 |
874 |
Total |
34 |
5 |
13 |
13 |
45 |
122 |
287 |
493 |
510 |
387 |
423 |
488 |
441 |
393 |
273 |
141 |
894 |
38 |
5000 |
Note: The shaded cells represent the number of respondents who expressed double digit current and three-month
ahead inflations. |
Table 7 A: Cross-tabulation of Current and One-year Ahead Inflation Expectations (12 cities) |
(Number of respondents) |
|
One-year ahead inflation rate ( per cent) |
Current inflation rate (per cent) |
|
<1 |
1-2 |
2-3 |
3- 4 |
4-5 |
5-6 |
6 -7 |
7- 8 |
8- 9 |
9-10 |
10-11 |
11-12 |
12-13 |
13-14 |
14-15 |
15-16 |
>=16 |
No idea |
Total |
<1 |
|
|
|
|
1 |
|
|
1 |
|
|
|
|
|
1 |
|
|
1 |
|
4 |
1-2 |
|
|
1 |
|
|
2 |
1 |
|
|
|
|
|
|
|
|
|
1 |
|
5 |
2-3 |
|
|
|
|
2 |
|
1 |
|
|
|
|
1 |
|
|
|
2 |
1 |
|
7 |
3-4 |
|
|
|
1 |
|
3 |
1 |
1 |
|
2 |
2 |
|
|
|
|
|
2 |
2 |
14 |
4-5 |
|
|
|
|
7 |
|
5 |
4 |
3 |
3 |
1 |
1 |
|
|
5 |
1 |
3 |
3 |
36 |
5-6 |
1 |
|
1 |
|
3 |
24 |
6 |
49 |
12 |
8 |
11 |
7 |
2 |
1 |
3 |
4 |
5 |
1 |
138 |
6-7 |
11 |
|
|
|
1 |
11 |
95 |
29 |
142 |
75 |
58 |
23 |
15 |
3 |
5 |
2 |
5 |
7 |
482 |
7-8 |
9 |
|
1 |
|
1 |
1 |
28 |
99 |
57 |
179 |
34 |
19 |
21 |
19 |
30 |
13 |
18 |
5 |
534 |
8-9 |
11 |
|
|
|
|
1 |
2 |
22 |
96 |
61 |
138 |
27 |
17 |
8 |
19 |
19 |
22 |
16 |
459 |
9-10 |
8 |
|
|
|
|
|
|
1 |
9 |
50 |
24 |
107 |
29 |
13 |
15 |
16 |
58 |
2 |
332 |
10-11 |
12 |
|
|
|
|
|
|
|
|
11 |
65 |
9 |
141 |
26 |
23 |
19 |
56 |
1 |
363 |
11-12 |
6 |
|
|
|
1 |
|
|
|
|
3 |
7 |
108 |
8 |
91 |
24 |
32 |
56 |
4 |
340 |
12-13 |
2 |
|
|
|
|
|
|
|
|
1 |
1 |
4 |
95 |
27 |
110 |
26 |
54 |
5 |
325 |
13-14 |
1 |
|
|
|
|
|
|
|
|
|
1 |
|
|
72 |
35 |
32 |
18 |
3 |
162 |
14-15 |
2 |
|
|
|
|
|
1 |
|
|
|
5 |
1 |
|
1 |
61 |
15 |
48 |
2 |
136 |
15-16 |
0 |
|
|
|
|
|
|
|
1 |
1 |
1 |
|
|
|
|
24 |
64 |
7 |
98 |
>=16 |
1 |
|
|
|
|
|
|
|
3 |
2 |
3 |
2 |
1 |
|
1 |
|
535 |
17 |
565 |
Total |
64 |
0 |
3 |
1 |
16 |
42 |
140 |
206 |
323 |
396 |
351 |
309 |
329 |
262 |
331 |
205 |
947 |
75 |
4000 |
Note: The shaded cells represent the number of respondents who expressed double digit current and one-year
ahead inflations. |
Table 7 B: Cross-tabulation of Current and One-year Ahead Inflation Expectations (16 Cities) |
(Number of respondents) |
|
One-year ahead inflation rate ( per cent) |
Current inflation rate (per cent) |
|
<1 |
1-2 |
2-3 |
3-4 |
4-5 |
5-6 |
6-7 |
7-8 |
8-9 |
9-10 |
10-11 |
11-12 |
12-13 |
13-14 |
14-15 |
15-16 |
>=16 |
No idea |
Total |
<1 |
|
|
|
|
1 |
|
|
1 |
|
|
|
|
|
1 |
|
|
1 |
|
4 |
1-2 |
|
|
1 |
1 |
|
2 |
1 |
|
|
|
|
|
|
|
|
|
1 |
|
6 |
2-3 |
|
|
|
|
3 |
|
2 |
|
|
|
1 |
1 |
|
|
|
2 |
1 |
|
10 |
3-4 |
|
|
|
1 |
3 |
6 |
2 |
2 |
2 |
2 |
2 |
|
|
|
|
|
3 |
4 |
27 |
4-5 |
|
|
|
0 |
7 |
5 |
20 |
10 |
5 |
4 |
3 |
2 |
|
|
5 |
1 |
3 |
3 |
68 |
5-6 |
1 |
|
1 |
1 |
3 |
27 |
30 |
83 |
18 |
14 |
12 |
7 |
3 |
1 |
3 |
4 |
5 |
2 |
215 |
6-7 |
11 |
|
|
|
1 |
12 |
99 |
53 |
166 |
76 |
58 |
24 |
15 |
3 |
5 |
2 |
6 |
7 |
538 |
7-8 |
9 |
|
1 |
|
2 |
1 |
28 |
100 |
58 |
185 |
38 |
21 |
27 |
24 |
37 |
16 |
18 |
7 |
572 |
8-9 |
11 |
|
|
|
|
1 |
2 |
22 |
96 |
62 |
138 |
30 |
23 |
11 |
30 |
28 |
22 |
16 |
492 |
9-10 |
8 |
|
|
|
|
|
0 |
2 |
9 |
50 |
28 |
112 |
37 |
24 |
44 |
63 |
58 |
2 |
437 |
10-11 |
12 |
|
|
|
|
|
1 |
1 |
|
11 |
69 |
12 |
154 |
50 |
55 |
56 |
67 |
4 |
492 |
11-12 |
6 |
|
|
|
1 |
|
|
|
|
3 |
7 |
108 |
9 |
101 |
36 |
54 |
82 |
4 |
411 |
12-13 |
2 |
|
|
|
|
|
|
|
|
1 |
1 |
4 |
96 |
27 |
124 |
37 |
78 |
5 |
375 |
13-14 |
1 |
|
|
|
|
|
|
|
|
|
1 |
|
|
72 |
36 |
44 |
47 |
4 |
205 |
14-15 |
2 |
|
|
|
|
|
1 |
|
|
|
5 |
1 |
|
1 |
61 |
16 |
75 |
2 |
164 |
15-16 |
|
|
|
|
|
|
|
|
1 |
1 |
1 |
|
2 |
|
|
26 |
71 |
8 |
110 |
>=16 |
1 |
|
|
|
|
|
1 |
2 |
3 |
2 |
24 |
5 |
7 |
1 |
2 |
12 |
797 |
17 |
874 |
Total |
64 |
0 |
3 |
3 |
21 |
54 |
187 |
276 |
358 |
411 |
388 |
327 |
373 |
316 |
438 |
361 |
1335 |
85 |
5000 |
Note: The shaded cells represent the number of respondents who expressed double digit current and one-year
ahead inflations. |
Table 8 A: Awareness of RBI’s Action on controlling Inflation and their Impact (12 cities) |
(Percentage of respondents) |
Category |
Whether RBI is taking action to control inflation |
Yes |
No |
No Idea |
Impact of RBI’s action to control inflation |
Yes |
No |
No Idea |
Total |
Financial Sector Employees |
21.8 |
26.7 |
6.7 |
55.2 |
23.3 |
21.5 |
Other Employees |
13.1 |
17.7 |
4.0 |
34.8 |
30.5 |
34.7 |
Self-Employed |
12.1 |
17.8 |
4.6 |
34.5 |
30.7 |
34.8 |
Housewives |
9.2 |
13.4 |
2.2 |
24.9 |
30.3 |
44.9 |
Retired persons |
10.1 |
20.5 |
2.2 |
32.9 |
29.5 |
37.6 |
Daily Workers |
10.0 |
8.7 |
2.4 |
21.0 |
31.8 |
47.2 |
Other Categories |
15.7 |
22.2 |
2.3 |
39.4 |
24.1 |
36.6 |
All |
12.1 |
16.9 |
3.4 |
32.3 |
29.5 |
38.2 |
Table 8 B: Awareness of RBI’s Action on controlling Inflation and their Impact (16 cities) |
(Percentage of respondents) |
Category |
Whether RBI is taking action to control inflation |
Yes |
No |
No Idea |
Impact of RBI’s action to control inflation |
Yes |
No |
No Idea |
Total |
Financial Sector Employees |
24.7 |
23.8 |
6.1 |
54.6 |
25.2 |
20.2 |
Other Employees |
16.3 |
16.0 |
4.1 |
36.4 |
30.9 |
32.7 |
Self-Employed |
15.4 |
15.6 |
4.2 |
35.2 |
30.7 |
34.1 |
Housewives |
10.7 |
11.9 |
2.7 |
25.3 |
31.5 |
43.2 |
Retired persons |
12.9 |
17.7 |
2.9 |
33.5 |
29.5 |
37.0 |
Daily Workers |
10.1 |
7.8 |
2.3 |
20.1 |
32.7 |
47.2 |
Other Categories |
19.6 |
19.6 |
1.9 |
40.4 |
24.9 |
34.7 |
All |
14.5 |
15.0 |
3.5 |
32.9 |
30.2 |
36.9 |
Table 9 A: Respondent's Expectation on Change in Wage/Income level (based on 12 cities) |
(Percentage of respondents) |
Category of Respondents |
Change in income since last year |
Change in income in three-month ahead period |
Change in income in one-year ahead period |
Increase |
Same |
Decrease |
Increase |
Same |
Decrease |
Increase |
Same |
Decrease |
Financial Sector Employees |
66.1 |
31.9 |
2.0 |
30.0 |
68.8 |
1.2 |
88.0 |
11.7 |
0.3 |
Other Employees |
54.6 |
44.0 |
1.4 |
23.2 |
76.1 |
0.7 |
79.3 |
19.7 |
1.0 |
Total Employees |
58.3 |
40.1 |
1.6 |
25.4 |
73.7 |
0.9 |
82.1 |
17.1 |
0.8 |
Self- Employed |
46.5 |
44.6 |
8.9 |
24.3 |
73.1 |
2.6 |
69.8 |
27.1 |
3.1 |
Daily Workers |
36.2 |
56.1 |
7.7 |
15.9 |
79.9 |
4.2 |
69.6 |
28.3 |
2.1 |
Total |
50.4 |
44.4 |
5.2 |
23.4 |
74.5 |
2.1 |
75.6 |
22.6 |
1.8 |
Table 9 B: Respondent's Expectation on Change in Wage/Income level (based on 16 cities) |
(Percentage of respondents) |
Category of Respondents |
Change in income since last year |
Change in income in three-month ahead period |
Change in income in one-year ahead period |
Increase |
Same |
Decrease |
Increase |
Same |
Decrease |
Increase |
Same |
Decrease |
Financial Sector Employees |
64.9 |
33.3 |
1.8 |
31.4 |
67.5 |
1.1 |
89.1 |
10.5 |
0.5 |
Other Employees |
56.2 |
42.4 |
1.4 |
24.3 |
75.0 |
0.7 |
80.6 |
18.3 |
1.0 |
Total Employees |
59.1 |
39.4 |
1.5 |
26.7 |
72.5 |
0.8 |
83.5 |
15.7 |
0.8 |
Self- Employed |
45.3 |
46.2 |
8.5 |
26.4 |
70.7 |
2.9 |
70.7 |
25.9 |
3.4 |
Daily Workers |
36.8 |
56.2 |
7.0 |
18.6 |
78.0 |
3.4 |
71.2 |
27.1 |
1.7 |
Total |
50.3 |
44.7 |
5.0 |
25.2 |
72.8 |
2.0 |
76.8 |
21.3 |
1.9 |
|
 IST,
IST,