 IST,
IST,


IV. Price Situation
|
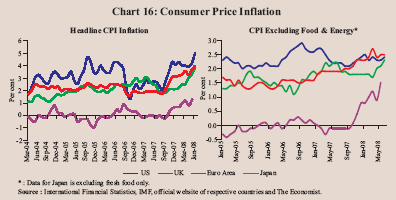
Headline inflation firmed up further in major economies, during the first quarter of 2008-09, reflecting the combined impact of higher food and fuel prices as well as strong demand conditions, especially in emerging markets. Notwithstanding inflation remaining above the targets/comfort zones, the monetary policy responses during the quarter were mixed in view of growth implications of the persistence of financial market turmoil following the US sub-prime crisis. While many central banks in developed countries such as the US, the UK and Canada, which had reduced policy rate up to April 2008, have paused subsequently, many central banks in emerging economies continued with pre-emptive monetary tightening to contain inflation and inflationary expectations on account of excess supply of global liquidity. Apart from independent actions, the co-ordinated move by major advanced country central banks in terms of injection of short-term liquidity aimed at easing strains on the money markets continued during the quarter. Mirroring inflation trends in many advanced as well as emerging economies, various measures of inflation in India have also risen significantly since the beginning of this calender year. In India, inflation based on the wholesale price index (WPI) increased from 7.7 per cent at end-March 2008 to 11.9 per cent by July 12, 2008, reflecting the impact of some pass-through of higher international crude oil prices to domestic prices as well as continued increase in the prices of iron and steel, basic heavy inorganic chemicals, machinery and machinery tools, oilseeds/edible oils/oil cakes and raw cotton on account of strong demand, international commodity price pressures and lower domestic 2007-08 rabi production of oilseeds. The seasonal hardening of vegetables prices as well as increase in the prices of textiles have also contributed to inflation during 2008-09 so far. Consumer price inflation also edged up generally during the first quarter of 2008-09, reflecting increase in the prices of food items and services, represented by the ‘miscellaneous’ group. Various measures of consumer price inflation were placed in the range of 6.8-8.8 per cent during May/June 2008 as compared with 6.0-7.9 per cent in March 2008 and 5.7-7.8 per cent in June 2007. Global Inflation Inflation has emerged as a global phenomenon in recent months. Headline inflation in major advanced economies firmed up further during the first quarter of 2008-09. Inflation hardened to 3.9 per cent in May 2008 in OECD countries from 2.4 per cent a year ago mainly due to higher energy and food prices, which increased, year-on-year, by 14.6 per cent and 6.1 per cent, respectively, in May 2008. Amongst major economies, headline inflation in the US rose to 5.0 per cent in June 2008 from 2.7 per cent a year ago (4.0 per cent in March 2008) driven by food and energy prices, which increased by 5.3 per cent and 24.7 per cent, year-on-year, in June 2008. Producer price inflation (PPI) increased even more to 9.2 per cent, year-on-year, in June 2008 from 3.3 per cent a year ago. In the UK, headline inflation increased to 3.8 per cent in June 2008 from 2.4 per cent a year ago, reflecting higher prices of food and non-alcoholic beverages as well as transportation costs, and housing and household services. In the UK also the PPI output price inflation rose significantly to 10.0 per cent in June 2008, reflecting increases in petroleum product prices. Furthermore, the input price index for materials and fuels purchased by manufacturing industry rose sharply by 30.3 per cent, year-on-year, in June 2008. In the euro area, inflation, based on the Harmonised Index of Consumer Prices (HICP), doubled to 4.0 per cent in June 2008 from 1.9 per cent a year ago, reflecting strong upward pressures from transport, food and housing prices. Core inflation also remained firm in major economies. In OECD countries, CPI, excluding food and energy, was firm at 2.1 per cent in May 2008, same as a year ago. In the US, CPI inflation (excluding food and energy) remained firm at 2.4 per cent in June 2008 (2.2 per cent a year ago) (Chart 16). Notwithstanding hardening of inflation, many central banks in advanced economies persisted with accommodative monetary policy aimed at fostering market liquidity and promoting growth over time. In the US, the Federal Open Market Committee (FOMC) in its meeting held on June 25, 2008 expected inflation to moderate from the latter part of the year. However, the FOMC noted that in the light of the continued increases in the prices of energy and some other commodities and the elevated state of some indicators of inflation expectations, uncertainty about the inflation outlook remained high. Against this backdrop, the FOMC left its target for the federal funds rate unchanged at 2.0 per cent. It had earlier cut its policy rate by 25 basis points on April 30, 2008 - taking cumulative reduction to 325 basis points beginning September
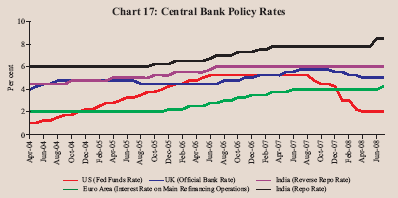
2007 when it began cutting rates. The discount rate was also cut by a total of 400 basis points beginning August 2007 to a level of 2.25 per cent to improve market liquidity. Apart from these measures, the US Fed also continued to inject liquidity by auctioning term funds to depository institutions against a wide variety of collaterals at the discount window and through a broader range of counterparties and established foreign exchange swap lines with the ECB and the Swiss National Bank. According to the FOMC, although tight credit conditions, the ongoing housing contraction, and the rise in energy prices are likely to weigh on economic growth over the next few quarters, the substantial easing of monetary policy combined with the ongoing measures to foster market liquidity should help promote moderate growth over time. In the UK, housing market conditions deteriorated sharply and the effects of the ongoing tightening in credit conditions were still working through the real economy. According to the Monetary Policy Committee (MPC), CPI inflation would peak around the end of the year and then begin to fall back towards the target of 2 per cent within a period of two years. According to the Committee, a slowdown in activity, reducing pressure on supply capacity and helping to contain wage growth, would be necessary to ensure that inflation returns to the target. Against this backdrop, the Bank of England, which had earlier cut its policy rate by 25 basis points on April 10, 2008 - a total of 75 basis points from December 2007 - to 5.00 per cent, left it unchanged thereafter (Table 30). In the euro area, HICP inflation rates continued to rise significantly and are expected to remain well above the level consistent with price stability for a more protracted period than previously thought. According to the ECB, continued vigorous money and credit growth, and the absence of significant constraints on bank loan supply in a context of ongoing financial market tensions confirms its assessment of upside risks to price stability over the medium term. At the same time, according to the Governing Council of the ECB, while the latest data confirmed the expected weakening of real GDP growth in mid-2008 after exceptionally strong growth in the first quarter, the economic fundamentals of the euro area were sound. Against this backdrop, the ECB raised its key policy rates by 25 basis points on July 9, 2008 - after keeping it unchanged for almost one year - to prevent broadly based second-round effects and to counteract the increasing upside risks to price stability over the medium term (Chart 17). Japan’s economic growth, which is slowing reflecting weaker growth in business fixed investment and private consumption against the backdrop of high energy and materials prices, is expected to gradually return onto a moderate growth path. According to the Bank of Japan (BoJ), CPI inflation is expected to gradually moderate after becoming somewhat elevated in the coming months.
Against this backdrop, the BoJ kept its policy rate unchanged at each of its meetings held since February 2007, when it had raised the uncollateralised overnight call rate (the operating target of monetary policy since March 2006) by 25 basis points to 0.50 per cent. It, however, noted that it is necessary to be mindful of upside risks due to changes in the inflation expectations of households and the price-setting behaviour of firms in addition to developments in energy and materials prices. Amongst the central banks in other major advanced economies, the policy rate was kept unchanged during 2008-09 so far by the Bank of Canada (it had earlier reduced the policy rate by 150 basis points during December 2007-April 2008) and the Reserve Bank of Australia (it had raised policy rate by 100 basis points during 2007-08). After keeping its policy rate unchanged since September 2007, the Reserve Bank of New Zealand reduced rate by 25 basis points on July 24, 2008 to 8.0 per cent (it had raised policy rate by 75 basis points during 2007-08). On the other hand, the Sveriges Riksbank (Sweden) raised its policy rate by 25 basis points, while the Norges Bank (Norway) raised rates by 50 basis points during 2008-09 so far.
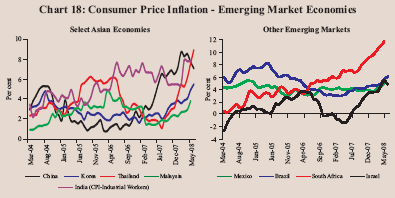
Inflation firmed up in most emerging market economies (EMEs) on the back of strong growth, higher oil, othercommodity and food prices. Due to the higher weight of food and energy in EMEs, the increase in inflation has typically been significantly higher in these countries. Consumer price inflation in China increased to 7.1 per cent in June 2008 from 4.4 per cent a year earlier mainly due to higher prices of food and articles related to residence, although it has moderated from a high of 8.7 per cent in February 2008 (Chart 18). Economic activity in China also continued to be strong with real GDP growth, year-on-year, at 10.6 per cent in the first quarter of 2008. The People’s Bank of China (PBC) has raised the cash reserve ratio (CRR) by 200 basis points since end-March 2008 - 50 basis points each effective April 25, 2008, May 20, 2008,
June 15, 2008 and June 25, 2008 - to 17.5 per cent. Thus, the CRR has been raised by a total of 1000 basis points between July 2006 and June 2008 to strengthen liquidity management in the banking system and guide the appropriate growth of money and credit. According to the PBC, it will give higher priority on its agenda to contain price rises and to curb inflation by implementing a tight monetary policy. After raising the benchmark 1-year lending rate by a total of 189 basis points beginning April 2006 to 7.47 per cent on December 21, 2007, the PBC kept it unchanged thereafter. In Korea, inflation increased to 5.5 per cent in June 2008 from 2.5 per cent a year ago mainly influenced by high oil prices. The pace of domestic economic growth has slackened. According to the Monetary Policy Committee (MPC), there still remains a high degree of uncertainty surrounding future economic developments, largely due to the run-up in international oil prices, the international financial market unrest and the US economic slowdown. Against this backdrop, the Bank of Korea left the policy rate unchanged at 5.0 per cent during 2008-09 so far (it had earlier raised policy rate by 50 basis points during 2007-08). In Thailand, consumer price inflation increased to 8.9 per cent in June 2008 from 1.9 per cent a year ago as a result of the continued rise in oil and raw food prices. According to the MPC, risks to inflation have risen markedly, which would affect private sector confidence, making it increasingly difficult to ensure economic stability going forward, and impact potential growth as well as the competitiveness of the Thai economy in the long-run. Against this backdrop, the MPC in its latest meeting held on July 16, 2008 raised the policy rate by 25 basis points to 3.50 per cent (after keeping it unchanged at 3.25 per cent since July 2007, when the policy rate was cut by 25 basis points). Inflation in Indonesia increased to 11.0 per cent in June 2008 from 5.8 per cent a year ago, reflecting pressures from fuel price hike and soaring food prices. According to Bank Indonesia, there were mounting demand side pressures in line with the rapid expansion in credit and the money supply. There were also indications of stronger inflation expectations that could trigger second round effects. Inflation is predicted to reach 11.5-12.5 per cent in 2008. Accordingly, the Bank Indonesia raised its policy rate further by 25 basis points - a total of 75 basis points since end-March 2008 - to 8.75 per cent on July 3, 2008. The policy rate was cut earlier by 475 basis points between May 2006 and December 2007. In Russia, consumer price inflation remained high, increasing from 7.8 per cent in May 2007 to 15.1 per cent in May 2008 amidst strong growth. Growth in money supply (M2) decelerated to 28 per cent, year-on-year, as on June 1, 2008 from almost 60 per cent a year ago. The Bank of Russia raised the required reserve ratio on credit institutions' liabilities to non-resident banks in rubles and foreign currency further by 150 basis points to 7.0 per cent effective July 1, 2008 - a total of 350 basis points from January 15, 2008 (it was earlier reduced by 100 basis points effective October 11, 2007). The refinancing rate was also raised by 75 basis points during 2008-09 so far - 25 basis points each effective April 29, 2008, June 10, 2008 and July 14, 2008 -to 11.0 per cent. The upward trend in inflation continued in South Africa (11.7 per cent in May 2008) driven by sustained increase in food and petrol prices. According to the South African Reserve Bank, CPI excluding interest rates on mortgage bonds (CPIX) inflation was expected to peak at around 12 per cent in the third quarter of 2008 and to return to within the inflation target range by the third quarter of 2010. Against this backdrop, the South African Reserve Bank raised its policy rate further by 100 basis points during the first quarter of 2008-09 - 50 basis points each effective April 11, 2008 and June 13, 2008 - to 12.0 per cent. The policy rate has thus been raised by 500 basis points since the tightening began in June 2006. The Bank of Israel, which had reduced the policy rate by 50 basis points each effective March and April 2008, reversed its stance and raised policy rate by 25 basis points each effective June and July 2008 to 3.75 per cent to bring inflation to the price stability target range of 1-3 per cent, thereby providing the basis of sustained growth. Inflation in Brazil increased to 6.1 per cent in June 2008 from 3.7 per cent a year ago, partly due to robust expansion in domestic demand. In light of signals of economy heating, the Monetary Policy Committee noted that monetary policy should act to contribute to the convergence between the paces of expansion of aggregate supply and demand, and avoid inflationary pressures and persistent deterioration of expectations and of the forward-looking inflation scenario. Accordingly, the Central Bank of Brazil raised the policy rate by 175 basis points during 2008-09 so far to 13.0 per cent on July 23, 2008. After reducing its policy rate by 850 basis points between September 2005 and September 2007, the Central Bank of Brazil had earlier left its policy rate unchanged at 11.25 per cent. Amongst other central banks, the Central Bank of Philippines has raised its policy rate by 75 basis points over end-March 2008 to 5.75 per cent on July 17, 2008 to reduce the risks to inflation expectations and the long-term cost to output growth from prolonged high inflation. An assessment of key macroeconomic indicators in select EMEs shows that consumer price inflation was in the range of 4.8-15.1 per cent during May/June 2008. Real policy rates in most countries ranged between (-) 5.7 and 6.9 per cent in July 2008 (Table 31). Current account in major EMEs, except India and South Africa, was in surplus during 2006/2007. The real effective exchange rate (REER) for the select EMEs, barring the currencies in Brazil, China, Israel, the Philippines and Russia underwent real depreciation, on a year-on-year basis, in June 2008. Although the Central Government’s fiscal
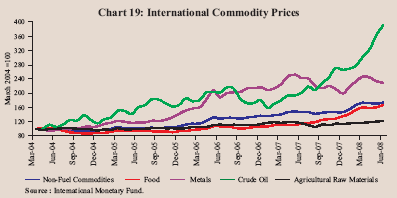
deficit in India declined during 2007-08, it remained higher than that in most EMEs. Global Commodity Prices Global commodity prices firmed up further during the first quarter of 2008-09 led by a sharp increase in the prices of crude oil as well as food and agricultural raw materials. Metal prices, which had increased during 2007-08, witnessed some moderation during the first quarter of 2008-09 (Table 32 and Chart 19). International crude oil prices, represented by the West Texas Intermediate (WTI), continued to rise sharply during the first quarter of 2008-09 reflecting tight supply-demand balance, geo-political tensions, weakening of the US dollar against major currencies and increased interest from investors and financial market participants (Table 33). Notwithstanding concerns about slowdown in the US and the Saudi Arabia’s plans to raise production in July 2008 to its 27-year high (at 9.7 million barrels per day), crude oil prices touched a high of
US $ 145.3 a barrel level on July 3, 2008 on the back of fall in US crude inventories, supply disruptions in Nigeria and heightened tensions between Iran and Israel raising new concerns about future supplies. The WTI crude prices eased to around US $ 127 per barrel level by July 22, 2008. Despite prospects for slower consumption growth in advanced economies, international crude prices are expected to remain at elevated level in view of
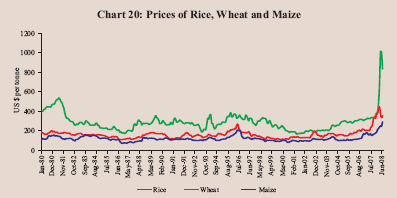
the relatively tight demand supply-balance (Table 34). According to the US Energy Information Administration (EIA), global supply uncertainties, combined with significant demand growth in China, the Middle-East and Latin America are expected to continue to pressure oil markets. Accordingly, the EIA expects WTI (average) crude prices to firm up by about 76 per cent from US $ 72.3 a barrel during 2007 to US $ 127.4 per barrel during 2008. The futures markets also suggest that WTI prices are expected to remain firm at around US $ 127 a barrel level up to February 2009. High and volatile international crude oil prices, thus, pose a major risk to the global inflation outlook. Metal prices eased somewhat during the first quarter of 2008-09, reflecting lower import demand and some improvement in supply. Between March 2008 and June 2008, the IMF metals price index declined by 7.4 per cent led by lead (38 per cent), zinc (24 per cent) and nickel (27 per cent), partly offset by increase in the prices of tin (12 per cent). On the other hand, international steel prices continued to increase during the first quarter (in the range of 33-37 per cent over March 2008) despite increase in global crude steel production (by 5.9 per cent, year-on-year, in June 2008), mainly reflecting rising input costs on account of iron ore, energy and freight charges. After rising by about 66 per cent in January 2008, international iron ore prices remained flat thereafter up to June 2008. Food prices firmed up further during the first quarter of 2008-09, led by rice, maize and oilseeds/edible oils, reflecting surging demand (both consumption demand and demand for non-food uses such as bio-fuels production) and low stocks of major crops (Chart 20). Reflecting these factors, international prices of rice, soybeans, soybean oil and palm oil increased by 139.8 per cent, 73.2 per cent, 82.7 per cent and 49.8 per cent, respectively, year-on-year, in June
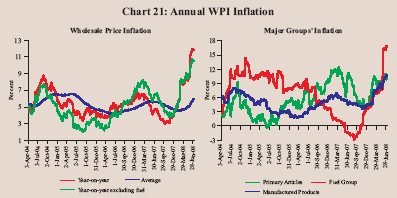
2008. Notwithstanding almost 21 per cent decline during June 2008 over March 2008, the year-on-year increase in wheat prices was 56.3 per cent in June 2008. Consequently, the IMF food price index increased by 44.4 per cent, on a year-on-year basis, in June 2008 surpassing the level which was last seen in 1980. The supply side pressures on global food prices do not appear to be abating, especially with the year ending global stock of major crops at multi-year lows, albeit with some improvement in prospects more recently. According to the US Department of Agriculture (USDA) in July 2008, global vegetable oils and oil meals stocks are expected to decline by 1-3 per cent during 2008-09 (on top of estimated decline of 5-6 per cent during 2007-08). On the other hand, global wheat stocks are expected to increase by almost 15 per cent during 2008-09 (against an estimated decline of around 8 per cent during 2007-08) to about 133.1 million tonnes. Global rice stocks are also expected to increase by about 4 per cent during 2008-09 to 82 million tonnes. International sugar prices have declined by about 8 per cent over March 2008, reflecting higher production in traditional importing countries. On a year-on-year basis, however, sugar prices were higher by about 31 per cent in June 2008. According to the International Sugar Organisation (ISO), global sugar production is estimated to exceed global consumption by about 9 million tonnes during 2007-08 (October-September) season. Global cotton prices, represented by the 'Cotlook A Index', declined by almost 4 per cent over March 2008. Notwithstanding this easing, cotton prices were higher by about 27 per cent, year-on-year, in June 2008. According to the International Cotton Advisory Committee (ICAC), world cotton production is expected to decline by about 3 per cent in 2008-09 and therefore, world cotton stocks are expected to fall further by almost 9 per cent to 11.0 million tonnes. Accordingly, ICAC expects prices to go up by 12 per cent in 2008-09. In response to high food prices, especially of wheat, rice, corns and oilseeds/edible oils and their implications for headline inflation and inflationary expectations, the Governments in both developed and developing countries continued to make numerous market interventions in the form of price controls, reduction of import barriers and/or imposition of export restrictions to contain price increases and prevent consumption from falling. Inflation Conditions in India The Annual Policy Statement for 2008-09 (April 2008) of the Reserve Bank reaffirmed its resolve to bring down inflation to around 5.5 per cent in 2008-09 with a preference for bringing it as close to 5.0 per cent as soon as possible, recognising the evolving complexities in globally transmitted inflation. As the potential inflationary pressures from international food and energy prices appear to have amplified and, by current indications, are likely to remain so for some time, the policy focused on conditioning perceptions for inflation in the range of 4.0-4.5 per cent so that an inflation rate of around 3.0 per cent becomes a medium-term objective consistent with India’s broader integration into the global economy and with the goal of maintaining self-accelerating growth over the medium-term. With the inflation rate based on wholesale price index hardening since the Annual Policy Statement was announced, an adjustment of overall aggregate demand on an economy-wide basis was warranted to ensure that generalised instability did not develop and eroded the hard-earned gains in terms of both outcomes of and positive sentiments on India’s growth momentum. In this regard, monetary policy had to urgently address aggregate demand pressures, which appeared to be strongly in evidence. Apart from the build-up in inflationary expectations, this was reflected in (i) strong investment demand; (ii) sustained high growth in domestic capital goods production albeit with some moderation in 2008-09 so far; (iii) revival in the production of consumer goods with a turnaround in the production of durables; (iv) widening trade deficit and some tightening of external financing conditions in the ongoing global financial turmoil; and (v) emergence of fiscal pressures due to the possibility of enhanced subsidies on account of food, fertiliser and POL as well as for financing deferred liabilities relating to farm loan waivers. Keeping in view the liquidity conditions and inflationary pressures in the economy, the cash reserve ratio was raised by 75 basis points to 8.25 per cent during April-May 2008 in three stages of 25 basis points each effective from April 26, May 10, and May 24, 2008. On May 30, 2008, special market operations were announced to alleviate the binding financing constraints faced by public sector oil companies in importing POL as also to minimise the potential adverse consequences for financial markets in which these oil companies are important participants. On a review of the current macroeconomic and overall monetary conditions and with a view to containing inflation expectations, the repo rate under the Liquidity Adjustment Facility (LAF) was raised by 25 basis points to 8.0 per cent with effect from June 12, 2008. Consistent with the overall stance of monetary policy set out for 2008-09 in April 2008 in terms of ensuring a monetary and interest rate environment that accords high priority to price stability, well anchored inflation expectations and orderly conditions in financial markets and on the basis of incoming information and domestic and global macroeconomic and financial developments, it was decided on June 24, 2008 to increase the repo rate under the LAF by 50 basis points to 8.50 per cent with effect from June 25, 2008 and the CRR by 50 basis points to 8.75 per cent in two stages of 25 basis points each with effect from July 5, 2008 and July 19, 2008 (Table 35). Wholesale Price Inflation In India, inflation based on the wholesale price index (WPI) increased to 11.9 per cent on July 12, 2008 from 7.7 per cent at end-March 2008 and 4.8 per cent a year ago. This mainly reflected the impact of some pass-through of higher international crude oil prices to domestic prices as well as continued increase in the prices of iron and steel, basic heavy inorganic chemicals, machinery and machinery tools, oilseeds/edible oils/oil cakes and raw cotton on account of strong demand, international commodity price pressures and lower domestic rabi production of oilseeds. The seasonal hardening of vegetables prices as well as increase in prices of textiles has also contributed to inflation during 2008-09 so far. On a year-on-year basis, twelve items/groups - rice, wheat, milk, raw cotton, oilseeds, iron ore, coal mining, minerals oil, edible oils, oil cakes, basic heavy inorganic chemicals and metals - with a combined weight of about 35 per cent in the WPI basket accounted for almost 77 per cent of headline inflation as on July 12, 2008 (as compared with about 49 per cent a year ago). The increase in domestic prices of some of these commodities also reflected the international commodity price pressures (Table 36). The y-o-y inflation, excluding fuel, was 10.5 per cent as on July 12, 2008 as compared with 6.6 per cent a year ago (Chart 21). The annual average WPI
inflation rate (average of 52 weeks) also increased to 6.0 per cent as on July 12, 2008 from 4.7 per cent at end-March 2008 (5.6 per cent a year ago). Amongst major groups, primary articles inflation, y-o-y, increased by 10.1 per cent on July 12, 2008 on top of 11.1 per cent a year ago (it was 9.7 per cent at end-March 2008), reflecting increase in prices of food articles, especially of rice, wheat, fruits and milk, and non-food articles such as oilseeds and raw cotton. Within primary food articles, rice prices increased by 8.2 per cent, on a year-on-year basis, on July 12, 2008, in contrast with sharp increase in international rice prices, which increased by almost 140 per cent on a year-on-year basis in June 2008. Wheat prices increased by 5.1 per cent, year-on-year, on July 12, 2008 on top of 11.1 per cent increase recorded a year ago. The lower order of increase in domestic prices of rice and wheat, in the face of sharp increases in international prices, could be attributed to the various supply-side measures undertaken by the Government. Amongst other primary food items, prices of milk increased by 7.6 per cent, y-o-y, on July 12, 2008 (9.4 per cent a year ago), while prices of fruits increased by 11.9 per cent (3.6 per cent a year ago). Vegetables prices increased by 27.5 per cent over end-March 2008, although on a year-on-year basis it declined by 3.4 per cent on July 12, 2008. Amongst non-food primary articles, prices of oilseeds, y-o-y, increased by 19.0 per cent on July 12, 2008 on top of the increase of 30.8 per cent a year ago, which could be attributed to higher demand, lower estimated rabi production (which was down by almost 13 per cent, y-o-y, as per the Fourth Advance Estimates) as well as rising global prices. Notwithstanding higher domestic production, raw cotton prices were 31.5 per cent higher, y-o-y, as on July 12, 2008 (20.7 per cent a year ago) in line with international price movements (Chart 22). Fuel group inflation, increased to 16.9 per cent on July 12, 2008 from 6.8 per cent at end-March 2008 (and a decline of 1.4 per cent a year ago), mainly due to increase in the prices of minerals oil by 16.9 per cent over end-March 2008. This reflected the effect of the hikes in the prices of petrol (Rs.5 per litre), diesel (Rs.3 per litre) and LPG (Rs.50 per cylinder) as well as continued increase in the prices of freely priced petroleum products such as naphtha, furnace oil, aviation turbine fuel, bitumen and lubricants in the range of 15-51 per cent over end-March 2008. Overall, prices of minerals oil increased by 26.7 per cent, year-on-year, as on July 12, 2008 as against a decline of 3.7 per cent a year ago. The increase in the prices of non-administered petroleum products was in line with international price movements, which increased by 93 per cent year-on-year in June 2008. It may be noted that international crude oil prices (Indian basket) increased by almost 129 per cent from US $ 56.6 a barrel in February 2007 (when domestic prices were last revised downwards) to US $ 129.8 a barrel level in June 2008. In rupee terms, the increase was about 122 per cent over the same period, while the minerals oil (monthly average) index in the WPI increased by about 27 per cent. However, the freely priced items within the mineral oil group increased within a range of 15-104 per cent over February 2007. This suggests that pass-through in case of administered petroleum products is still incomplete. Coal prices increased by 9.8 per cent, year-on-year, on July 12, 2008 as compared with 'nil' increase last year (Table 37).
Manufactured products inflation, year-on-year, rose further to 10.7 per cent on July 12, 2008 from 7.3 per cent at end-March 2008 (and 4.8 per cent
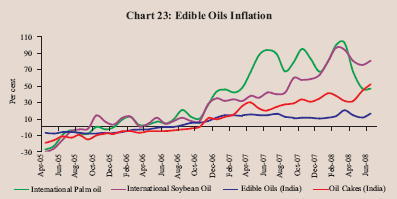
a year ago), reflecting increase in the prices of edible oils, oil cakes, textiles, chemicals, basic metals, alloys and products, and machinery and machine tools. Prices of sugar and grain mill products, however, eased somewhat from end-March 2008. The increase in domestic edible oils and oil cakes prices, year-on-year, by 17.2 per cent and 48.3 per cent, respectively, on July 12, 2008 (on top of 16.1 per cent and 23.8 per cent, respectively, a year ago) reflected surge in demand, lower domestic rabi oilseeds production as well as sharp increase in international prices (Chart 23). The sharp increase in domestic iron and steel prices (35.1 per cent, year-on-year) was in line with the recent hardening of international steel prices (Chart 24).
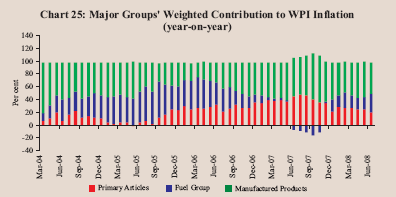
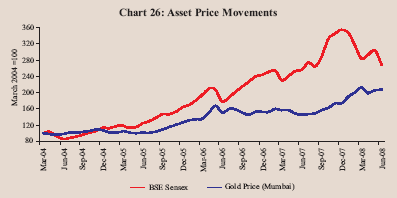
Overall, 'manufactured products' group was the major driver of year-on-year WPI inflation as on July 12, 2008 with weighted contribution of 49.9 per cent (55.9 per cent, a year ago), followed by 'fuel, power, light and lubricants' group at 30.5 per cent (against a decline of 6.9 per cent) and the 'primary articles' group at 19.8 per cent (51.1 per cent) (Chart 25). The Government has undertaken a series of supply augmenting and fiscal measures to contain inflationary pressures (Annex). Consumer Price Inflation Inflation, based on year-on-year variation in consumer price indices (CPIs), increased further during the first quarter of 2008-09 mainly due to increase in food prices and services (represented by the ‘miscellaneous’ group) prices. Various measures of consumer price inflation were placed in the range of 6.8-8.8 per cent during May/June 2008 as compared with 6.0-7.9 per cent in March 2008 and 5.7-7.8 per cent in June 2007 (Table 38). Asset Prices Domestic equity prices witnessed further corrections during the first quarter of 2008-09 in line with trends in major international equity markets, which fell due to heightened concerns over the persistence of financial market stress following the US sub-prime crisis, and concerns about some slowdown in the domestic economy (see Chapter V). Domestic gold prices also eased somewhat during the first quarter of 2008-09 mirroring movements in international prices.
Domestic gold prices declined by 3.4 per cent over end-March 2008 to around Rs. 12,312 per 10 grams in June 2008 in line with movement in international prices, which declined by over 8 per cent over the same period (Chart 26). International gold prices had touched a peak of US $ 1,011 per ounce on
March 17, 2008, reflecting weakening of US dollar, hardening of oil prices and increased investor interest following uncertainties surrounding the global financial markets. Annex : Recent Measures by the Government to Control Inflation in India In order to contain inflationary pressures, the monetary measures undertaken by the Reserve Bank were supplemented by a number of fiscal and supply augmenting measures undertaken by the Government. These include: (i) Measures relating to Imports Pulses: Customs duty on import of pulses was reduced to zero on June 8, 2006 and the period of validity of import of pulses at zero duty, which was initially available up to March 2007, was first extended to August 2007 and further to March 2009. Wheat: Import of wheat at zero duty, which was available up to end-December 2006, was extended further to end-December 2007. Edible oils: Customs duty on palm oils was reduced by 10 percentage points across the board in April 2007 and import duty on various edible oils was reduced in a range of 5-10 percentage points in July 2007. The 4 per cent additional countervailing duty on all edible oils was also withdrawn. Customs duties on crude and refined edible oil were reduced from a range of 40-75 per cent to 20.0-27.5 per cent in March 2008. Import of crude form of edible oil at zero duty and refined form of edible oil at a duty of 7.5 per cent was allowed. Rice: In March 2008, the customs duty on semi-milled or wholly-milled rice was reduced from 70 per cent to zero per cent up to March 2009. Maize: Customs duty on maize imported under a Tariff Rate Quota of five lakh metric tonnes was also decreased from 15 per cent to Nil in April 2008. Milk: In order to ensure adequate availability of milk in lean summer months, basic customs duty on skimmed milk powder was proposed to be reduced from 15 per cent to 5 per cent for a Tariff Rate Quota of 10,000 metric tonnes per annum in April 2008. Similarly, on butter oil, which is used for reconstituting liquid milk, customs duty was reduced from 40 per cent to 30 per cent. Cement: On April 3, 2007, import of portland cement other than white cement was exempted from countervailing duty (CVD) and special additional customs duty; it was earlier exempted from basic customs duty in January 2007. Exports of cement was prohibited with effect from April 11, 2008. Iron & Steel: In order to augment the domestic availability of steel products as well as to soften prices, the following measures were announced: a) reduction in the basic customs duty on pig iron and mild steel products viz., sponge iron, granules and powders; ingots, billets, semi-finished products, hot rolled coils, cold rolled coils, coated coils/sheets, bars and rods, angle shapes and sections and wires from 5 per cent to Nil; b) full exemption of the import of TMT bars and structurals from CVD, which is currently at 14 per cent; c) reduction in the basic customs duty on three critical inputs for manufacture of steel, i.e. metallurgical coke, ferro alloys and zinc from 5 per cent to Nil. Cotton: The 10 per cent customs duty on cotton imports along with 4 per cent special additional duty was abolished with effect from July 8, 2008. Crude Oil & Petroleum products: Customs duty on crude oil was reduced from 5 per cent to ‘nil’ as well as on diesel and petrol from 7.5 per cent to 2.5 per cent each, and on other petroleum products from 10.0 per cent to 5.0 per cent. Excise duty on petrol and diesel was reduced by Re. 1 per litre. (ii) Measures relating to Exports Pulses: A ban was imposed on export of pulses with effect from June 22, 2006 and the period of validity of prohibition on exports of pulses, which was initially applied up to end-March 2007, was further extended first up to end-March 2008 and then for one more year beginning April 1, 2008. Onion: The minimum export price (MEP) was increased by the National Agricultural Cooperative Marketing Federation of India Ltd. (NAFED) by US $ 100 per tonne for all destinations from August 20, 2007 and by another US $ 50 per tonne with effect from October 2007 for restricting exports and augmenting availability in the domestic market. Edible Oils: The export of all edible oils was prohibited with immediate effect from April 1, 2008. Rice: On April 1, 2008, export of non-basmati rice was banned and the minimum export price (MEP) was raised to US $ 1,200 per tonne in respect of basmati rice. On April 29, 2008, an export duty of Rs.8,000 per tonne was imposed on basmati rice along with a commensurate reduction in its minimum export price and thereby re-fixed the MEP at US$ 1,000 per tonne. Iron & Steel: On April 29, 2008, export duty was imposed on steel items at the following three different rates:
For this purpose, a uniform statutory rate of 20 per cent has been incorporated in the Export Schedule. These measures are expected to disincentivise the export of steel and augment domestic supply. Cotton: One per cent drawback benefits (refund of local taxes) on exports of raw cotton was withdrawn with effect from July 8, 2008. (iii) Other Measures a) The minimum support price (MSP) for paddy was raised by Rs. 125 per tonne for 2007-08 and for wheat by Rs. 150 for 2007-08 and further by Rs. 150 for 2008-09. b) Issuance of oil bonds to State-run oil marketing companies. |
|||||||||||||||||||||||||||||||||||||||||||||||||||||||||||||||||||||||||||||||||||||||||||||||||||||||||||||||||||||||||||||||||||||||||||||||||||||||||||||||||||||||||||||||||||||||||||||||||||||||||||||||||||||||||||||||||||||||||||||||||||||||||||||||||||||||||||||||||||||||||||||||||||||||||||||||||||||||||||||||||||||||||||||||||||||||||||||||||||||||||||||||||||||||||||||||||||||||||||||||||||||||||||||||||||||||||||||||||||||||||||||||||||||||||||||||||||||||||||||||||||||||||||||||||||||||||||||||||||||||||||||||||||||||||||||||||||||||||||||||||||||||||||||||||||||||||||||||||||||||||||||||||||||||||||||||||||||||||||||||||||||||||||||||||||||||||||||||||||||||||||||||||||||||||||||||||||||||||||||||||||||||||||||||||||||||||||||||||||||||||||||||||||||||||||||||||||||||||||||||||||||||||||||||||||||||||||||||||||||||||||||||||||||||||||||||||||||||||||||||||||||||||||||||||||||||||||||||||||||||||||||||||||||||||||||||||||||||||||||||||||||||||||||||||||||||||||||||||||||||


இந்த பக்கத்தை பகிரவும்:


இந்திய ரிசர்வ் வங்கி மொபைல் செயலியை நிறுவுங்கள் மற்றும் சமீபத்திய செய்திகளுக்கான விரைவான அணுகலை பெறுங்கள்!
எங்கள் செயலியை நிறுவ QR குறியீட்டை ஸ்கேன் செய்யவும்


கடைசியாக புதுப்பிக்கப்பட்ட பக்கம்:


