 IST,
IST,


Compilation of House Price Index using Big Data Techniques
This study aims to derive an alternative indicator for the residential property price in India adopting big data tools. Data on residential property prices from select web-portals are collected and processed using big data tools to compile a residential house price index. This index can be compiled almost immediately at the end of each quarter. It is found that there are statistically significant correlations between residential house prices based on web data and registration data (both index and growth), though there are divergences in terms of price levels. There is a bidirectional relationship between the indices based on registration data and web data. House price is an essential indicator of the economy. It has a co-movement with the Gross Domestic Product (GDP), consumption, investment, inflation, current account balance, and the output gap (Ahearne et al., 2005). Residential property is the largest single asset for most households around the world. The variations in residential property price affect households’ long-term investment strategy, influence their spending and borrowing patterns. Change in the property price influences the banking and financial sectors of the economy through bank lending and mortgage channel. In view of this, residential property price is an important piece of information for policymakers, especially for the central banks. In the Indian context, there are two established housing price indices, viz., (a) House Price Index (HPI) compiled by the Reserve Bank of India and (b) RESIDEX, which is compiled bythe National Housing Bank (NHB)1. These indices are typically available with a lag of (at least) one quarter. In order to obtain an early signal on residential house prices, an attempt has been made to compile an alternate residential house price index based on data available on the web portals of select real estate agencies in India. Big data tools have been employed to collect, process, and store these data. The rest of the article is organised as follows: Section 2 provides a brief review of the literature in this domain. Section 3 highlights data collection using dynamic chart scrapping methodology and processing unstructured data using big data tools. Section 4 describes the methodology for compiling the index on the basis of web data. Section 5 outlines stylised facts and empirical methodologies to study the index’s usefulness for estimating the Reserve Bank’s HPI. Section 6 focuses on empirical results, and Section 7 sets out the concluding observations. In the domain of big data analytics, the techniques involved in the programmatic collection of intended data from a specific website is referred to as web scraping. The web scraping as a data collection method was adopted in the past. However, the same was used in the core economic activity in the Billion Prices Project (BPP), an academic initiative at the MIT Sloan and Harvard Business School (Cavallo and Rigobon, 2016). This work describes how the alternative sources, like the data web scraped from online e-commerce in BBP, can be a potential candidate for the compilation of price index (of underlying commodities). In their work, big data techniques are adopted to capture, clean, and process data received from online e-commerce portals. They argued that these sources are often cheap and enable users to have near real-time price index numbers. The same concept was adopted in the Indian context, where it was argued that despite several limitations of online prices, the web-data based index successfully tracks both the direction and the magnitude of the Indian official Consumer Price Index (CPI) (Banerjee et al., 2018). The use of big data techniques and web scraping in the context of the residential property price has been minimal. However, several studies in this domain using Google Trend data include - predicting economic activities (Choi and Varian, 2012); assessment of real estate market and housing price (Wu and Brynjolfsson, 2015); and housing price in the Indian context (Mitra et al., 2017). In this context, a similar study was carried out at the Bank Indonesia. It was argued that Indonesia’s online advertisement data was successfully tracking property prices (Kristiawardani and Sampe, 2017). 3. Data Collection and Processing The big data tools have been employed to collect data from websites2 of select real estate advertising agencies in India. In order to have historical data on residential house price, a specific kind of web scraping technique, which may be termed as ‘dynamic chart scraping’, has been developed (Chart 1). 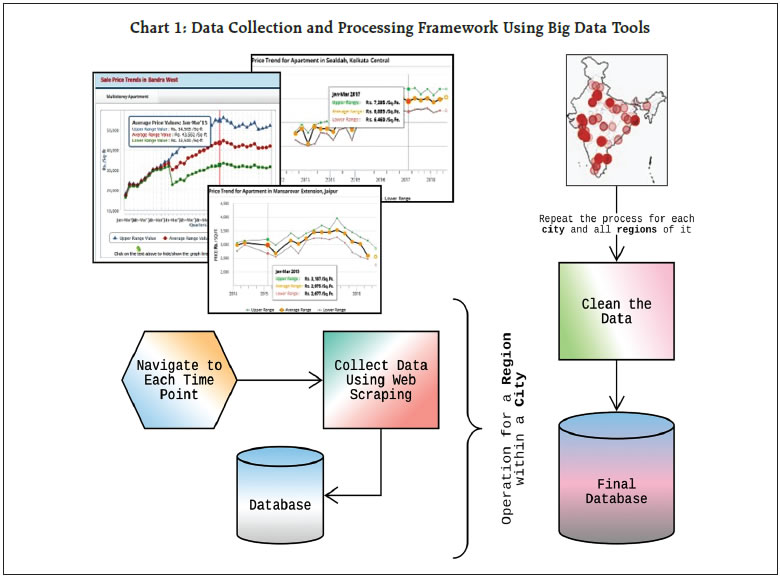 Within the source website, the price trend is presented in the form of a dynamic chart. The web scraping technology was developed and employed on these dynamic charts in the web-portals to obtain desired housing price information. The data fields captured using the dynamic chart scrapping are source website, city, location within the city (termed as a region), property type, price of the property, type of price aggregation, unit of the price and the time point of price. There are missing values observed in the collected dataset. These missing values are estimatedby interpolation using local polynomials3. Sometimes the price variation in the datasets is found to be very high. Such price variations are adjusted using three methods: (a) outlier detection rule as embedded in the X-13ARIMA-SEATS program; (b) additive outlier detection rule; and (c) heuristic approach involving moving interquartile ranges. Index of house price has been derived based on the processed final data. 4. Compilation of House Price Index 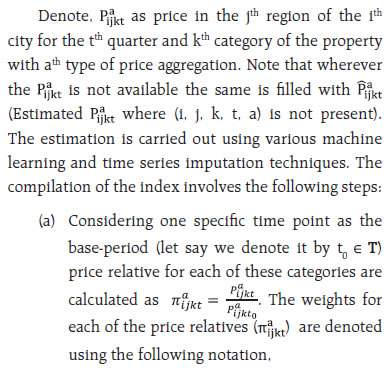 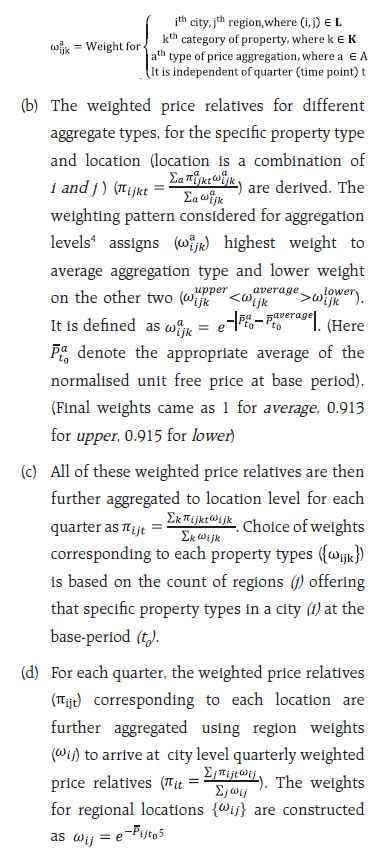 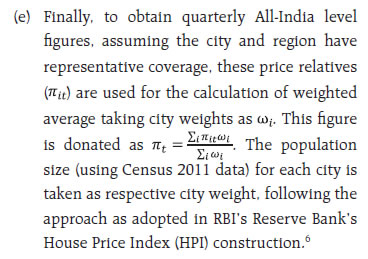 5. Stylised Facts and Empirical Methodologies The Reserve Bank’s HPI7 is compiled every quarter based on the official data of property transactions collected from the registration authorities of respective state governments for ten major cities, viz., Mumbai, Delhi, Chennai, Kolkata, Bengaluru, Lucknow, Ahmedabad, Jaipur, Kanpur and Kochi with the base year 2010-11 (RBI, 2014). The city, Kochi, has been excluded from this analysis from of HPI. The derived index based on web crawled data covers these cities except Kochi. It is termed as WEB HPI (for simplicity we have interchangeably used WEB to mean the same). The base year for WEB is considered the same as that of HPI. Overall, the WEB Index is found to be lesser than HPI, implying that the price level based on registration data is higher than the price level indicated in the advertisements (Chart 2). Further, the WEB Index graphs are smoother than the HPI. It means advertisement prices are not changed frequently, whereas, the HPI based on actual registration data is having higher price variation over time (as the actual sale varies significantly). Moreover, the registration prices are embedded with several underlying factors of the property such as floor rise, position, facing, and other factors, which may not be displayed in the advertisements. The empirical analysis of the divergence between HPI and WEB indices is beyond the scope of this study. However, it may be due to the following reasons: 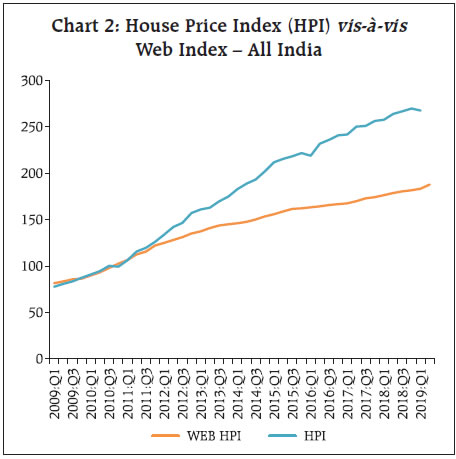
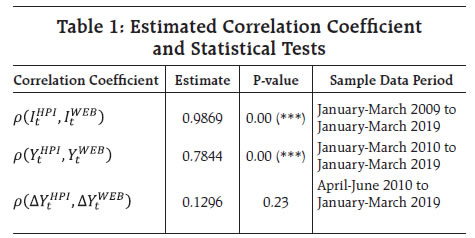
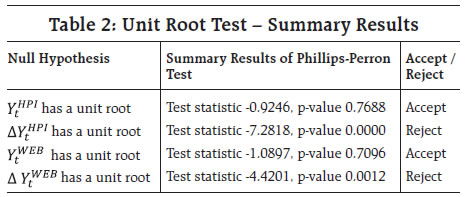
The year-on-year growth figures on the basis of registration data was much higher than the growth based on advertisement data during January 2010 – September 2010, October 2011 – December 2015, and April 2016 – June 2017. However, there is a statistical co-movement of year-on-year growth of prices in both the series. The growth figures that fell below 5 per-cent during January – March 2019 could be due to the implementation of the Real Estate Regulation and Development (RERA) Act, 2016 (Chart 3). In order to study the empirical relationship between the HPI and the WEB HPI, the correlation analysis has been carried out at levels and year-on-year growth. 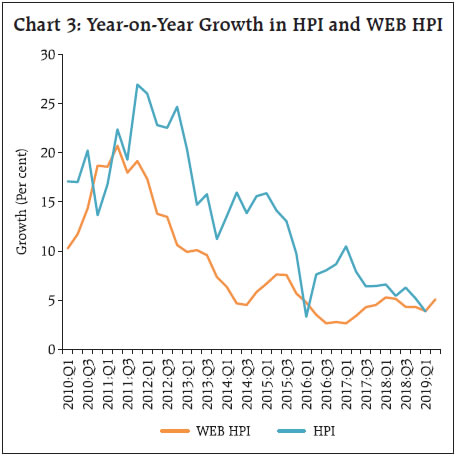 Compute year-on-year growth of house pricesusing the formulas9 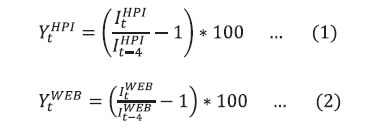 To analyse the usefulness of WEB HPI data for estimating the HPI, following steps have been used: 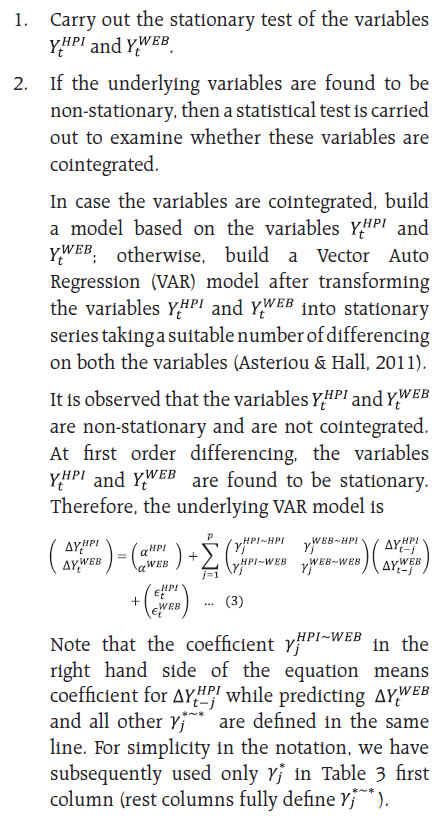 The equation (3) is estimated based on the underlying data. The empirical analysis has been carried out based on quarterly data on underlying indices, viz., HPI and WEB HPI, available from January – March 2009 to January – March 2019 (41 quarters). The estimated correlation coefficients between HPI and WEB HPI at both level and growth (year-on-year) are found to be statistically significant at 1 per-cent level (Table 1).  Accordingly, a VAR model (in line with Equation 3)has been estimated based on the sample data10. The VAR model provides an estimation framework for incremental growth of the house price. The estimated VAR model reveals that the incremental growth of residential house price (both registration and online web) can be estimated using their lag values (past four quarters). In particular, residential house price available on the web could be useful in predicting the registration residential house price. There is a bi-directional causal relationship between the registration price and online web price (Table 3). With the help of big data tools, data on house price available in the web portals of real estate advertisers have been collected and processed. An alternative indicator of residential house price index has been constructed based on advertisement data available online. There is a divergence between the prices levels of HPI and WEB HPI. The level of residential house price based on advertisement data is found to be lower than the level of residential house price based on registration data. Also, the growth of price rise in registration data was much higher than the growth of price rise computed based on advertisements during January 2010 – September 2010, October 2011 – December 2015, and April 2016 – June 2017. However, the correlation between indices (HPI and WEB) and their year-on-year growth is found to be positive and statistically significant. Therefore, the residential house price index based on advertisement data may be a useful indicator, and further research on its application may be attempted. 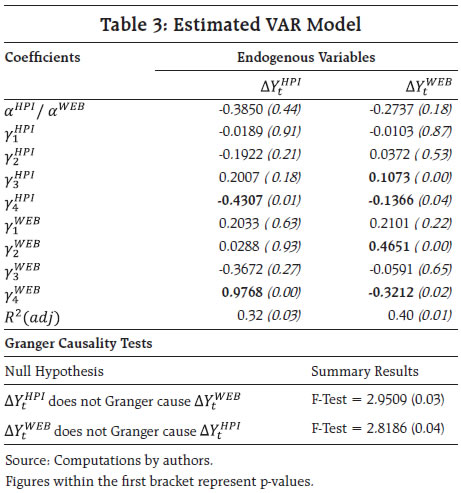 References Alan G. Ahearne, John Ammer, Brian M. Doyle, Linda S. Kole, and Robert F. Martin, (2005). “House Prices and Monetary Policy: A Cross-Country Study”, Board of Governors of the Federal Reserve System. Asteriou, D. & Hall, S. G., (2011). “Vector Autoregressive (VAR) Models and Causality Tests”. Applied Econometrics (Second ed.). London: Palgrave MacMillan, p. 319–333. Banerjee, R., Singhal, N. & Subramanian, C., (2018). “Predicting Food Price Inflation through Online Prices in India”. Economic and Political Weekly, Volume LIII No 23, pp. 132-135. Cavallo, A., & Rigobon, R. (2016). “The Billion Prices Project: Using Online Prices for Measurement and Research”. Journal of Economic Perspectives, 30(2), 151–178. https://doi.org/10.1257/jep.30.2.151 Choi, H., & Varian, H. (2012). “Predicting the Present with Google Trends”. Economic Record, 88(SUPPL.1), 2–9. https://doi.org/10.1111/j.1475-4932.2012.00809.x Kristiawardani, K., & Sampe, I. (2017). “Using Online Property Advertisements Data as a Proxy for Property Market Indicators Bank Indonesia”. FC-Bank Indonesia Satellite Seminar on “Big Data” at the ISI Regional Statistics Conference 2017 Bali, Indonesia, March. Mitra, P., Sanyal, A., & Choudhury, S. (2017). “Nowcasting Real Estate Activity in India using Google Trend Data”. Reserve Bank of India - Occasional Papers, 38-No. 1. /en/web/rbi/-/nowcasting-real-estate-activity-in-india-using-google-trend-data-3516. RBI, (2014). “House Price Index: 2010-11 to 2013-14”. RBI Monthly Bulletin, October, pp. 93-96. Wu, L., & Brynjolfsson, E. (2015). “The Future of Prediction : How Google Searches Foreshadow Housing Prices and Sales”. Economic Analysis of the Digital Economy: April 2015. https://doi.org/10.3386/w19549 * This article is prepared by Indranil Gayen and Sasanka Sekhar Maiti in the Big Data Analytics Division, Department of Statistics and Information Management. The views expressed in the article are those of the authors and do not necessarily represent the views of the Reserve Bank of India. 1 For this study, we have focused on HPI compiled by the Reserve Bank of India (RBI) as there will be an extended time series for comparison. Further, HPI is reported to the international forums by the RBI, while NHB RESIDEX is not having an All India level index (and has non-mutually exclusive coverage). 2 The leading real-estate advertisement websites in the Indian market. 3 Lagrange polynomial (https://en.wikipedia.org/wiki/Polynomial_interpolation) is used in sliding window on time series data. 4 The set A (of all possible aggregation types) has three elements which are upper, average and lower. 5 It is inversely related to the average normalised price of a region at base period, which is taken as a proxy for the number of advertisements at a specific location. It is observed from data that usually the number of advertisements of the properties with higher relative price occur less frequently than that of lower relative price. 6 All of the weighing patterns (except for All-India level aggregation) are based on the heuristic approach by the authors. There was limited, or no prior research work on this type of data. Details of which is omitted in this scope of the study. 7 The data has been obtained from https://dbie.rbi.org.in/ (Statistics > Real Sector > Prices & Wages > Quarterly). The HPI series is available in two different base year with a common period. The index figures prior to 2010-Q2 (equivalently Q1 of 2010-11) are obtained using splicing with old base year (2008-09) indices. 8 Housing sales down 40 per cent in 2017 from 2013/14 levels: ANAROCK (Source: https://economictimes.indiatimes.com/industry/services/property-/-cstruction/housing-sales-down-40-per-cent-in-2017-from-2013/14-levels-anarock/articleshow/63352292.cms)  10 The lag order of the VAR model has been decided based on the Final Prediction Error (FPE) information criteria. The optimal lag order for the estimated VAR model is 4. |

இந்த பக்கத்தை பகிரவும்:


இந்திய ரிசர்வ் வங்கி மொபைல் செயலியை நிறுவுங்கள் மற்றும் சமீபத்திய செய்திகளுக்கான விரைவான அணுகலை பெறுங்கள்!
எங்கள் செயலியை நிறுவ QR குறியீட்டை ஸ்கேன் செய்யவும்


கடைசியாக புதுப்பிக்கப்பட்ட பக்கம்:


