Debits to Deposit Accounts with Scheduled Commercial Banks During 1997-98 (Part 1 of 2) - ஆர்பிஐ - Reserve Bank of India
Debits to Deposit Accounts with Scheduled Commercial Banks During 1997-98 (Part 1 of 2)
Introduction |
This article analyses the results of the biennial sample Survey on Debits to Deposit Accounts with Scheduled Commercial Banks for the year 1997-98 (April-March) conducted by the Reserve Bank of India. Debits to deposit accounts of banks represent withdrawals made by depositors either in the form of cheques or in cash. Comparison of the total of such withdrawals for a certain period with the average balances held by the depositors in such accounts provides a measure of the extent to which depositors make use of the funds in their bank accounts for making payments. |
2. The survey is a part of basic statistical returns (BSR) system and the required information is reported by the sample branches in BSR-6 returns. The selected branches were required to report outstanding balances in current and savings accounts as well as sanctioned limits in cash credit and overdraft accounts as on the last Friday of each quarter of the reference year. They also reported the total withdrawals from each of these types of accounts for each quarter of the reference year, which represent debit figures. |
3. Excluding the administrative offices, Aggregate Deposits and Gross Bank Credit as on the last Friday of the quarter ended June 1997 were reported in BSR-7 return by 63,214 branches. This provided the sampling frame of the current survey. The branches for the purpose of the survey were selected as follows. |
a) |
The top 2000 branches with deposits above Rs.39.48 crore together with the branches of the Union Territories having 10 or less number of branches were selected as certainty branches. The total number of such branches selected was 2016. |
b) |
Out of the remaining branches, 3982 branches were selected by circular systematic sampling. In all, 5998 branches were selected for the survey. The filled-in returns in BSR-6 were received from 4925 branches forming 82.1 per cent of the selected branches. Based on the above sampling design the estimates of different characteristics have been built and presented in this article. |
4. The deposit figures reported in the article relate to the averages of the estimated deposits as on the last Friday of each quarter in the reference year. The limits of cash credit and overdrafts also refer to averages of different quarters. Turnover of any particular type of deposit is worked out by dividing total debits charged to that category of deposit accounts during the reference year, by average of the corresponding deposits of the four quarters in the reference year. The results of this Survey are presented in two statements and ten tables. The statements present the distribution of deposits and approved limits in Cash Credit, Overdraft and corresponding debits according to population group and state as classificatory characteristics. The Table 1 presents the trends in deposits, debits and turnover ratio observed during the last four biennial Surveys and the same has been discussed in the following Section. |
2. |
Trends of turnover ratios during the period 1991-92 to 1997-98 |
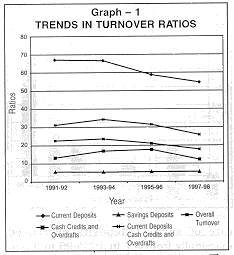
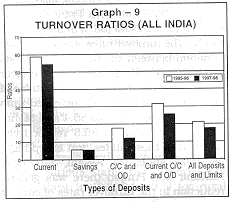
The turnover rate of current deposits had been decreasing steadily from 67.1 per cent during 1991-92, to 66.6 per cent during 1993-94 and to 58.8 per cent during 1995-96. It decreased further to 54.6 per cent during 1997-98. The turnover rate of cash credit and overdraft accounts steadily increased from 13.2 per cent during 1991-92 to 16.9 per cent during the year 1993-94 and to 17.7 per cent during the year 1995-96. The turnover rate of cash credit and overdraft accounts, however, declined to 12.2 per cent for the year 1997-98. The combined rate of turnover of current deposits and credit limits which hitherto had been in the range of 31 to 35 per cent has decreased to 25.8 per cent during 1997-98 (see Graph 1). |
|
|
|
|
|
|
(Rupees Crore) |
|
|
|
|
1991-92 |
1993-94 |
1995-96 |
1997-98 |
|
|
1 |
2 |
3 |
4 |
5 |
1. |
Current Deposits |
34,825 |
42,411 |
55,544 |
76,152 |
2. |
Limits of Cash Credits and Overdrafts |
69,272 |
79,180 |
1,09,106 |
1,60,736 |
3. |
Debits to Current Deposits |
23,36,004 |
28,26,218 |
32,63,937 |
41,56,690 |
4. |
Debits to Cash Credits and Overdrafts |
9,15,800 |
13,40,198 |
19,28,400 |
19,59,464 |
5. |
Turnover of Current Deposits |
67.1 |
66.6 |
58.8 |
54.6 |
(Ratio of 3 to 1) |
|||||
6. |
Turnover of Cash Credits and |
13.2 |
16.9 |
17.7 |
12.2 |
Overdrafts (Ratio of 4 to 2) |
|||||
7. |
Savings Deposits |
52,457 |
70,907 |
1,10,266 |
1,54,965 |
8. |
Debits to Savings Deposits |
2,90,207 |
3,77,114 |
6,07,345 |
8,44,868 |
9. |
Turnover of Savings Deposits |
5.5 |
5.3 |
5.5 |
5.5 |
(Ratio of 8 to 7) |
|||||
10. |
Turnover of Current Deposits, |
31.2 |
34.3 |
31.5 |
25.8 |
Cash Credits and Overdrafts |
|||||
(Ratio of 3+4 to 1+2) |
|||||
11. |
Overall Turnover |
22.6 |
23.6 |
21.1 |
17.8 |
Savings deposits predominantly held by the household sector, had much lower turnover rate as compared to current deposits in all three previous surveys. The turnover rate of savings deposits which were found in the range 5.3 to 5.5 per cent in 1991-92,1993-94and 1995-96 now stands at 5.5 per cent (see Graph 2). |
3. |
Distribution of deposits and approved limits of cash credit, overdrafts together with debits by population group |
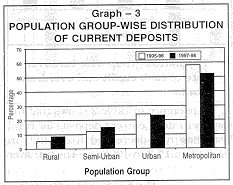
The population group-wise distribution of deposits and credit limits together with debits to these accounts is presented in Statement I. The statement shows that the share of metropolitan centres in total current deposits decreased from 58.3 per cent in 1995-96 to 52.4 per cent in 1997-98, corresponding shares of rural and semi urban branches have increased from 5.4 to 8.8 per cent and 12.1 to 15.1 per cent during the survey period (see Graph 3). |
|
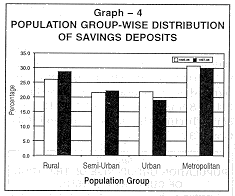
The share of urban centres in total current deposits has marginally decreased from 24.2 to 23.6 per cent. The respective shares of savings deposits of rural,semi-urban, and urban branches were 28.8 per cent, 22.3 per cent and 19.1 per cent during the survey period. The share of metropolitan center has, however, decreased from 30.7 per cent in 1995-96 to 29.8 per cent in 1997 -98 (see Graph 4). |
|
The share of approved limits sanctioned for cash credit and overdrafts accounts in rural, urban and metropolitan centers have remained stationary in composition in 1997-98 in comparison with 1995-96 (see Graph 4A). The share of semi-urban centres have however decreased from 11.1 per cent in 1995-96 to 8.4 percent in 1997-98. |
|
4. |
Population group-wise turnover rate of cash credit and overdraft limits |
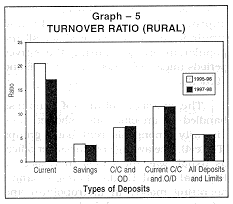
A reference to Table 2 shows that the turnover rate of current deposits for rural branches has decreased from 20.6 in 1995-96 to 17.3 in 1997-98. The turnover rate of savings deposits decreased marginally from 3.7 in 1995-96 to 3.5 in 1997-98 whereas the turnover rate of cash credit and overdraft limits has increased marginally during the period of this survey as compared to the corresponding results of the survey conducted for the period 1995-96 (see Graph 5). |
TABLE 2 : POPULATION GROUP-WISE TURNOVER OF CURRENT DEPOSITS, CASH CREDIT AND OVERDRAFTS |
|
|
|
|
|
|
|
|
TURNOVER OF |
||||||
CURRENT |
SAVINGS |
CASH CREDIT |
CURRENT |
ALL DEPOSITS |
||
POPULATION |
YEAR |
DEPOSITS |
DEPOSITS |
AND |
DEPOSITS, |
AND LIMITS |
GROUP |
OVERDRAFTS |
CASH |
||||
CREDIT & |
||||||
|
|
|
|
|
|
OVERDRAFTS |
|
1 |
2 |
3 |
4 |
5 |
6 |
7 |
Rural |
1995-96 |
20.6 |
3.7 |
7.1 |
11.5 |
5.6 |
1997-98 |
17.3 |
3.5 |
7.4 |
11.5 |
5.6 |
|
Semi-urban |
1995-96 |
54.6 |
5.9 |
13.4 |
28.2 |
15.7 |
1997-98 |
43.7 |
4.8 |
13.1 |
27.1 |
14.2 |
|
Urban |
1995-96 |
59.9 |
5.9 |
21.3 |
36.9 |
23.9 |
1997-98 |
53.0 |
5.7 |
14.5 |
28.7 |
20.0 |
|
Metropolitan |
1995-96 |
62.7 |
6.5 |
18.3 |
32.2 |
25.9 |
|
|
1997-98 |
64.8 |
7.7 |
11.9 |
26.2 |
21.8 |
All-India |
1995-96 |
58.8 |
5.5 |
17.7 |
31.5 |
21.1 |
|
|
1997-98 |
54.6 |
5.5 |
12.2 |
25.8 |
17.8 |
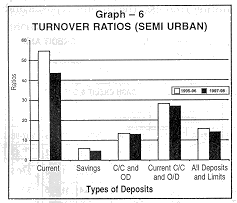
The turnover rates of current deposits for semi-urban branches have decreased from 54.6 in 1995-96 to 43.7 in 1997-98. Similarly, the corresponding figures of savings deposit has also come down from 5.9 to 4.8. However, the turnover rate of cash credit and overdraft limits has marginally decreased from 13.4 in 1995-96 to 13.1 in 1997-98 (see Graph 6). |
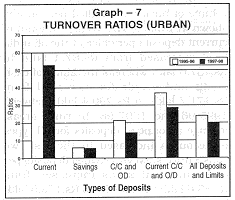
The urban area exhibited a decline in turnover rates of current and savings deposits from 59.9 and 5.9 in 1995-96 to 53.0 and 5.7 in 1997-98 respectively. The turnover ratio of cash credit and overdraft limits has also decreased from 21.3 in 1995-96 to 14.5 in 1997-98 (see Graph 7). |
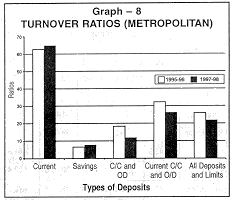
In metropolitan centres there was an increase in turnover rates of current deposits from 62.7 per cent in 1995-96 to 64.8 per cent in 1997-98. The turnover rate for cash credit and overdraft limits has decreased from 18.3 to 11.9 per cent for metropolitan branches, for the corresponding period. The decline in turnover ratios of all the deposits of urban and metropolitan branches indicate the possibility of subdued use of bank fund for business and industrial activities during the survey period. (see Graph 8). |
5. |
Analysis of average volume of business handled by an office |
The population group-wise average volume of business handled per office is shown in Table 3. The average amount of current deposits per office at the all India level increased from Rs.87.4 lakh to Rs.137.6 lakh whereas the limits of cash credit and overdrafts increased from Rs.171.7 lakh to Rs.290.4 lakh between 1995-96 and 1997-98. In rural areas, average amount of deposits for all types of accounts increased in the last two consecutive surveys. Savings deposits per office in rural areas increased from Rs.85.6 lakh in 1995-96 to Rs.172.5 lakh in 1997-98. The average amount of savings deposits of an office increased from Rs.482.4 lakh to Rs.627.1 lakh in metropolitan areas, Rs.261.9 lakh to Rs.328.5 lakh in urban areas and from Rs.170.5 lakh to Rs.263.8 lakh for semi-urban branches during the two survey periods under reference. The average amount of current deposits per office increased from Rs.461.1 lakh to Rs.541.0 lakh in metropolitan areas and from Rs.145.9 lakh to Rs.200.2 lakh in urban areas between 1995-96 and 1997-98. The approved limits of cash credit and overdraft accounts increased for all the population groups, during the survey periods under reference, i.e. 1995-96 and 1997-98. |
The average volume of business handled by an office also showed wide disparity among different bank groups (Table 4). The average business per office, as usual, was the lowest in respect of Regional Rural Banks. Foreign Banks, operating mostly in metropolitan and urban centres, showed the largest average amount of deposits and debits per office. The average amount of current deposits per office and limits of cash credit and overdraft in respect of Foreign Banks increased from Rs.2407.2 lakh to Rs.3478.9 lakh. The cash credit and overdraft limits of Foreign Banks also increased from 6621.9 lakh to 8408.0 lakh at an annual rate from 12.7 percent during 1997-98. The current deposits and debits to current deposits showed an increase in 1997-98 over 1995-96 for all bank groups. In case of State Bank of India and its Associates, average amount of current deposits per office increased from Rs.145.6 lakh to Rs.206.1 lakh and limits of cash credit and overdrafts increased from Rs.369.1 lakh to Rs.427.1 lakh between 1995-96 and 1997-98. In case of Nationalised Banks, average amount per office of current deposits increased from Rs.98.3 lakh to Rs.124.6 lakh and limits of cash credit and overdrafts increased from Rs.159.0 lakh to Rs.279.6 lakh between the two periods under reference. |
6. |
Turnover rates of metropolitan centres |
The turnover rates for major metropolitan centres are presented in Table 5. The turnover rate of current deposits was highest in Mumbai (90.4) while it was the lowest in Chennai (47.1). The turnover rate of cash credit and overdraft accounts, were in the range of 14.4 to 15.5, except for Mumbai (8.3). The share of four major metropolitan centres viz., Mumbai, Calcutta, New Delhi and Chennai in current deposits has reduced from 45.3 per cent in 1995-96 to 36.6 per cent in 1997-98. The share of these metropolitan centres in cash credit and overdraft limits has also increased from 49.6 per cent to 52.1 per cent. The share of these four centres in respect of savings deposits was 19.8 per cent in current survey. Debits to current deposits and debits to cash credit and overdraft limits, are presented in Table 6. The shares of four major metropolitan centres in Mumbai, Calcutta, New Delhi and Chennai in respect of debits to Current deposits has decreased marginally from 47.5 per cent in 1995-96 to 45.2 per cent in 1997-98. The shares in debits to Cash Credit and Overdraft accounts decreased from 52.8 per cent in 1995-96 to 46.3 per cent in 1997-98. |
TABLE 3 : AVERAGE AMOUNT PER OFFICE OF CURRENT AND SAVINGS DEPOSITS, CASH CREDIT AND OVERDRAFT LIMITS AND DEBITS OF THESE ACCOUNTS |
|
|
|
|
|
|
|
|
|
|
|
|
(Rupees lakh) |
|
CURRENT DEPOSIT A/Cs |
SAVINGS DEPOSIT A/Cs |
CASH CREDIT & OVERDRAFT A/Cs |
||||||||||
POPULATION |
||||||||||||
GROUP |
DEPOSITS |
DEBITS |
DEPOSITS |
DEBITS |
APPROVED LIMITS |
DEBITS |
||||||
|
|
1995-96 |
1997-98 |
1995-96 |
1997-98 |
1995-96 |
1997-98 |
1995-96 |
1997-98 |
1995-96 |
1997-98 |
1995-96 |
1997-98 |
1 |
2 |
3 |
4 |
5 |
6 |
7 |
8 |
9 |
10 |
11 |
12 |
13 |
Rural |
9.0 |
26.0 |
1,86.5 |
4,49.8 |
85.6 |
1,72.5 |
3,15.6 |
6,09.5 |
18.8 |
36.2 |
1,33.3 |
2,66.5 |
Semi-Urban |
48.5 |
88.0 |
26,49.2 |
38,45.4 |
1,70.5 |
2,63.8 |
9,98.2 |
12,56.1 |
86.9 |
1,03.4 |
11,67.5 |
13,50.1 |
Urban |
1,45.9 |
2,00.2 |
87,33.4 |
1,06,04.1 |
2,61.9 |
3,28.5 |
15,55.6 |
18,57.3 |
2,13.8 |
3,42.0 |
45,52.5 |
49,41.5 |
Metropolitan |
4,61.1 |
5,41.0 |
289,23.1 |
3,50,43.8 |
4,82.4 |
6,27.1 |
31,34.4 |
48,23.5 |
10,12.6 |
14,52.6 |
185,62.1 |
1,72,21.8 |
ALL-INDIA |
87.4 |
1,37.6 |
51,36.0 |
75,10.8 |
1,73.5 |
2,80.0 |
9,55.7 |
15,26.6 |
1,71.7 |
2,90.4 |
30,34.4 |
35,40.6 |
TABLE 4 : AVERAGE AMOUNT PER OFFICE OF CURRENT DEPOSITS, CASH CREDIT AND OVERDRAFT LIMITS AND DEBITS TO THEM - BANK GROUP-WISE |
|
|
|
|
|
|
(Rupees Lakh) |
Current |
Cash Credit |
Debits to |
Debit to |
||
Bank Group |
Year |
Deposits |
and |
Current |
Cash Credit |
|
|
|
|
Overdrafts |
Deposits |
and Overdrafts |
1 |
2 |
3 |
4 |
5 |
6 |
State Bank of India |
1995-96 |
1,45.6 |
3,69.1 |
1,28,74.1 |
57,47.1 |
and Associates |
1997-98 |
2,06.1 |
4,27.1 |
1,32,80.6 |
50,84.8 |
Nationalised Banks |
1995-96 |
98.3 |
1,59.0 |
45,87.5 |
30,61.0 |
1997-98 |
1,24.6 |
2,79.6 |
61,58.9 |
33,42.9 |
|
Regional Rural Banks |
1995-96 |
3.5 |
1.8 |
44.1 |
7.2 |
1997-98 |
35.4 |
6.9 |
1,61.8 |
55.5 |
|
Other Indian Scheduled |
1995-96 |
79.7 |
1,66.9 |
53,73.6 |
25,64.3 |
Commercial Banks |
1997-98 |
1,22.9 |
2,73.8 |
77,06.0 |
39,25.0 |
Foreign Banks |
1995-96 |
24,07.2 |
66,21.9 |
8,79,84.7 |
13,25,42.4 |
|
|
1997-98 |
34,78.9 |
84,08.0 |
22,69,92.0 |
10,85,85.6 |
All Scheduled |
1995-96 |
87.4 |
171.7 |
51,36.0 |
30,34.4 |
Commercial Banks |
1997-98 |
1,37.6 |
2,90.4 |
75,10.8 |
35,40.6 |
TABLE 5 : DEPOSITS, CASH CREDIT AND OVERDRAFTS AND TURNOVER RATES FOR MAJOR METROPOLITAN CENTRES, 1997-98 |
|
|
|
|
|
|
|
|
|
|
|
Metropolitan |
Current |
Savings |
Approved |
Turnover of |
|||||
Centre |
Deposits |
Deposits |
Limits |
||||||
for Cash |
Current |
Savings |
Cash |
Current |
All |
||||
(Rs. Crore) |
(Rs. Crore) |
Credit |
Deposits |
Deposits |
Credit |
Deposits, |
Deposits |
||
and |
and |
Cash credit |
and |
||||||
|
|
|
|
|
Overdrafts |
|
|
Overdrafts |
& Overdrafts |
Limits |
|
|
1 |
2 |
3 |
4 |
5 |
6 |
7 |
8 |
9 |
1. |
Calcutta |
3,777 |
4,476 |
7,008 |
48.1 |
7.1 |
14.4 |
26.2 |
20.6 |
(5.0) |
(2.9) |
(4.4) |
|||||||
2. |
Mumbai |
11,400 |
12,040 |
53,142 |
90.4 |
7.0 |
8.3 |
22.8 |
20.3 |
(15.0) |
(7.8) |
(33.1) |
|||||||
3. |
Chennai |
4,584 |
3,574 |
9,985 |
47.1 |
23.9 |
15.4 |
25.4 |
25.1 |
(6.0) |
(2.3) |
(6.2) |
|||||||
4. |
New Delhi |
8,133 |
10,643 |
13,632 |
55.4 |
5.7 |
15.5 |
30.4 |
22.3 |
|
|
|
(10.7) |
(6.9) |
(8.5) |
|
|
|
|
|
Total of 4 centres |
25,188 |
22,576 |
54,073 |
61.6 |
6.4 |
18.8 |
32.4 |
26.7 |
|
1995-96 |
(45.3) |
(20.5) |
(49.6) |
||||||
1997-98 |
27,893 |
30,733 |
83,767 |
67.4 |
8.5 |
10.8 |
24.9 |
21.4 |
|
|
|
|
(36.6) |
(19.8) |
(52.1) |
|
|
|
|
|
Note : |
Figures in brackets indicate percentages to All-India totals. |
7. |
State-wise analysis of current deposits, cash credit and overdraft limits |
The State-wise break-up of current deposits and those of cash credit and overdraft limits together with debits to these accounts are presented in Statement II and the corresponding turnover rates are given in Table 7. For the current survey i.e. 1997-98, the turnover rate of current deposits was found to be the highest in Maharashtra (85.5), followed by Haryana (83.8), Madhya Pradesh (62.0), Gujarat (55.5), Delhi (55.4) and Rajasthan (50.7) . The turnover rates showed a mixed variation between the two study periods i.e. 1995-96 and 1997-98. The turnover rates of current deposits for the states of U.P. and Delhi have also increased from 43.5 to 50.6 and 46.2 to 55.4 and Maha-rashtra from 71.2 to 85.5 respectively. Apart from these states and excepting a few other states viz. Assam, Jammu & Kashmir and Punjab there was general reduction in the turnover rates of current deposits for all other states. For cash credit and overdraft limits, percentage increase was highest in Punjab (9.3 to 17.7) followed by Uttar Pradesh (11.9 to 19.9). The maximum decrease in percentage terms in turnover rate was observed in Maharashtra (22.1 to 8.8) followed by Kerala (20.7 to 10.5). |
TABLE 6 : DEBITS TO CURRENT DEPOSITS, CASH CREDIT AND OVERDRAFTS FOR MAJOR METROPOLITAN CENTRES, 1997-98 |
|
|
|
|
(Rupees crore) |
||
DEBITS |
|||||
Metropolitan Centre |
Current Deposits |
|
Cash credit & overdrafts |
|
|
1 |
2 |
|
3 |
|
|
1. Calcutta |
1,81,787 |
1,01,162 |
|||
(4.4) |
(5.2) |
||||
2. Mumbai |
10,30,448 |
4,39,605 |
|||
(24.8) |
(22.4) |
||||
3. Chennai |
2,16,068 |
1,54,131 |
|||
(5.2) |
(7.9) |
||||
4. New Delhi |
4,50,645 |
2,11,379 |
|||
|
|
(10.8) |
|
(10.8) |
|
|
Total of 4 centres |
|||||
(a) 1995-96 |
15,50,742 |
10,18,883 |
|||
(47.5) |
(52.8) |
||||
(b) 1997-98 |
18,78,949 |
9,06,276 |
|||
|
|
(45.2) |
|
(46.3) |
|
|
Note: |
Figures in brackets indicate percentages to All-India total. |
State and population group-wise turnover rate for different types of accounts are presented in Table 8. It reveals that urban areas of Maharashtra had the highest turnover rate of current deposits at 99.5 whereas the turnover rate in rural areas of Madhya Pradesh (80.3) found to be highest. West Bengal (79.1) had the highest turnover rate of current deposits in semi-urban areas. In respect of cash credit and overdraft accounts, among various states the turnover rate was highest in Gujarat (29.6) for rural areas whereas for semi-urban areas it was highest in Rajasthan (27.5). Similarly this turnover rate for urban areas was highest in West Bengal (34.8). |
Population group-wise highest turnover rate in savings deposit are found to be in the state of Andhra Pradesh for rural areas (7.4), Karnataka (9.1) for semi - urban areas Kerala (13.0) for urban areas and Tamilnadu (23.9) for metropolitan areas. |
8. |
Bank group-wise analysis of current deposits, cash credit and overdraft limits |
Bank group-wise turnover rates for different population groups and deposit accounts are given in Table 9. The turnover rates of current deposits in the metropolitan areas was highest in case of other Scheduled Commercial Banks (81.2) whereas State Bank of India had highest turnover of current deposits in urban (70.7) and rural (42.7) areas . |
TABLE 7 : STATE-WISE TURNOVER OF CURRENT DEPOSITS, SAVINGS DEPOSITS, CASH CREDIT AND OVERDRAFTS |
|
|
|
|
|
|
|
|
|
|
|
|
TURNOVER OF |
||||||||||
STATE / |
Current |
Cash Credit |
Current Deposits, |
Savings |
All Deposits |
|||||
UNION |
Deposits |
& Overdrafts |
Cash Credit |
Deposits |
and Limits |
|||||
TERRITORY |
|
|
|
|
and Overdrafts |
|
|
|
|
|
|
|
1995-96 |
1997-98 |
1995-96 |
1997-98 |
1995-96 |
1997-98 |
1995-96 |
1997-98 |
1995-96 |
1997-98 |
1 |
2 |
3 |
4 |
5 |
6 |
7 |
8 |
9 |
10 |
11 |
Andhra Pradesh |
55.2 |
33.8 |
20.4 |
11.5 |
31.8 |
18.7 |
10.6 |
8.3 |
23.7 |
15.9 |
Assam |
25.6 |
33.0 |
14.8 |
12.9 |
20.2 |
26.7 |
3.7 |
3.8 |
10.6 |
13.1 |
Bihar |
29.2 |
29.9 |
23.1 |
14.2 |
26.7 |
23.5 |
3.8 |
3.0 |
11.7 |
8.9 |
Gujarat |
68.4 |
55.5 |
18.3 |
23.6 |
38.3 |
37.3 |
5.3 |
5.3 |
25.0 |
25.2 |
Haryana |
86.6 |
83.8 |
15.1 |
16.7 |
35.2 |
38.2 |
5.2 |
5.1 |
18.3 |
20.4 |
Jammu & Kashmir |
20.0 |
20.7 |
8.5 |
9.7 |
13.6 |
14.3 |
3.1 |
3.3 |
8.4 |
8.7 |
Karnataka |
61.8 |
48.8 |
15.1 |
16.4 |
26.1 |
26.8 |
6.9 |
7.3 |
19.0 |
20.1 |
Kerala |
65.8 |
45.8 |
20.7 |
10.5 |
37.3 |
22.4 |
9.3 |
6.7 |
21.5 |
14.1 |
Madhya Pradesh |
73.9 |
62.0 |
15.6 |
15.5 |
35.1 |
34.2 |
6.4 |
4.8 |
22.5 |
14.9 |
Maharashtra |
71.2 |
85.5 |
22.1 |
8.8 |
29.5 |
24.4 |
6.0 |
5.9 |
29.5 |
20.4 |
Orissa |
32.7 |
12.1 |
25.6 |
12.1 |
15.6 |
12.1 |
4.9 |
5.3 |
15.6 |
9.4 |
Punjab |
40.5 |
47.4 |
9.3 |
17.7 |
8.0 |
31.4 |
3.8 |
4.5 |
8.0 |
18.0 |
Rajasthan |
86.6 |
50.7 |
16.4 |
14.1 |
26.1 |
28.3 |
5.5 |
4.8 |
26.1 |
18.2 |
Tamil Nadu |
58.0 |
48.1 |
14.1 |
11.8 |
20.8 |
22.1 |
7.6 |
12.7 |
20.8 |
19.3 |
Uttar Pradesh |
43.5 |
50.6 |
11.9 |
19.9 |
12.7 |
36.7 |
3.7 |
3.2 |
12.7 |
12.8 |
West Bengal |
58.6 |
45.2 |
15.4 |
15.6 |
21.1 |
27.7 |
5.1 |
5.0 |
21.1 |
18.2 |
Delhi |
46.2 |
55.4 |
16.6 |
15.5 |
21.0 |
30.4 |
5.2 |
5.6 |
21.0 |
22.2 |
Others |
44.4 |
33.0 |
22.8 |
5.3 |
32.7 |
11.2 |
5.3 |
5.7 |
19.4 |
9.7 |
All-India |
58.8 |
54.6 |
17.7 |
12.2 |
31.5 |
25.8 |
5.5 |
5.5 |
21.1 |
17.8 |
The turnover rate of savings deposits in the metropolitan areas was highest in case of foreign banks (20.8). Other Scheduled Commercial Banks had the highest savings deposit turnover rates in all the other population groups. |
The turnover rate in respect of cash credit and overdraft limits was found to be highest for Foreign Banks (20.8) in the Urban areas and for Other Scheduled Commercial Banks (14.9) in Metropolitan areas. Nationalised Banks had highest turnover in rural (9.8) and semi-urban areas (14.5). |
The data on state and bank group-wise turnover rate are presented in Table 10. In all the major states, the turnover rate of current deposits was found to be higher for State Bank group, compared to those of Nationalised Banks, exception being the states of Punjab (51.1), Orissa (31.4) and Jammu and Kashmir (20.5). Amongst the states, the Regional Rural Banks of Punjab had the highest turnover rate (97.1) of current deposits. |
TABLE 8 : STATE AND POPULATION GROUP-WISE TURNOVER OF DEPOSITS, CASH CREDIT AND OVERDRAFTS, 1997-98 |
|
|
|
|
|
|
|
|
|
|
|
|
RURAL |
SEMI-URBAN |
|||||||||
TURNOVER OF |
||||||||||
Current |
Current |
|||||||||
STATE/ UNION |
Deposits, |
Cash |
Deposits, |
|||||||
TERRITORY |
Cash |
Cash |
All |
Credit |
Cash |
All |
||||
Credit |
Credit |
Deposits |
and |
Credit |
Deposits |
|||||
Current |
Savings |
and Over- |
and Over- |
and |
Current |
Savings |
Over- |
and Over- |
and |
|
|
|
Deposits |
Deposits |
drafts |
drafts |
Limits |
Deposits |
Deposits |
drafts |
drafts |
Limits |
1 |
2 |
3 |
4 |
5 |
6 |
7 |
8 |
9 |
10 |
11 |
ANDHRA PRADESH |
18.3 |
7.4 |
7.2 |
10.1 |
8.7 |
40.3 |
8.7 |
7.2 |
14.2 |
12.2 |
ASSAM |
2.0 |
2.4 |
3.3 |
2.3 |
2.3 |
19.9 |
3.7 |
12.5 |
18.4 |
8.0 |
BIHAR |
9.9 |
2.6 |
6.0 |
8.0 |
3.4 |
22.6 |
2.7 |
9.0 |
18.0 |
6.7 |
GUJARAT |
17.3 |
3.3 |
29.6 |
24.7 |
13.5 |
54.3 |
4.2 |
18.9 |
39.0 |
18.6 |
HARYANA |
51.6 |
6.4 |
8.1 |
21.9 |
11.1 |
59.9 |
4.6 |
18.9 |
30.5 |
17.1 |
JAMMU & KASHMIR |
13.8 |
2.9 |
6.8 |
12.0 |
5.1 |
26.1 |
2.1 |
10.3 |
20.8 |
6.7 |
KARNATAKA |
29.5 |
6.6 |
15.0 |
21.8 |
13.4 |
66.7 |
9.1 |
11.8 |
33.5 |
20.3 |
KERALA |
22.4 |
6.7 |
5.2 |
7.8 |
7.1 |
38.5 |
5.8 |
9.2 |
18.2 |
10.7 |
MADHYA PRADESH |
80.3 |
4.0 |
4.4 |
47.7 |
6.0 |
23.5 |
3.4 |
17.5 |
21.4 |
11.4 |
MAHARASHTRA |
47.3 |
4.3 |
9.7 |
24.8 |
11.0 |
71.2 |
4.6 |
13.3 |
42.0 |
20.0 |
ORISSA |
2.1 |
4.3 |
11.3 |
3.4 |
3.7 |
24.9 |
5.1 |
11.8 |
19.1 |
10.7 |
PUNJAB |
12.9 |
3.7 |
8.3 |
10.5 |
5.3 |
44.2 |
5.1 |
17.4 |
28.7 |
16.5 |
RAJASTHAN |
30.9 |
5.0 |
14.0 |
20.9 |
8.6 |
74.5 |
5.0 |
27.5 |
50.9 |
21.9 |
TAMIL NADU |
39.4 |
4.6 |
2.7 |
4.8 |
4.8 |
37.4 |
6.4 |
12.1 |
25.6 |
12.9 |
UTTAR PRADESH |
6.3 |
2.7 |
5.9 |
6.2 |
3.1 |
58.6 |
3.2 |
16.9 |
37.7 |
18.1 |
WEST BENGAL |
19.8 |
3.2 |
17.4 |
19.0 |
7.6 |
79.1 |
2.9 |
12.3 |
52.8 |
16.2 |
DELHI |
43.5 |
3.4 |
9.5 |
24.1 |
6.3 |
9.3 |
1.8 |
3.0 |
9.1 |
2.4 |
OTHERS |
26.7 |
3.7 |
7.9 |
12.9 |
7.9 |
24.0 |
4.0 |
11.9 |
19.4 |
12.4 |
ALL-INDIA |
17.3 |
3.5 |
7.4 |
11.5 |
5.6 |
43.7 |
4.8 |
13.1 |
27.1 |
14.2 |
|
|
|
|
|
|
|
|
|
|
|
|
URBAN |
METROPOLITAN |
|||||||||
TURNOVER OF |
||||||||||
Current |
Current |
|||||||||
STATE/ UNION |
Deposits, |
Cash |
Deposits, |
|||||||
TERRITORY |
Cash |
Cash |
All |
Credit |
Cash |
All |
||||
Credit |
Credit |
Deposits |
and |
Credit |
Deposits |
|||||
Current |
Savings |
and Over- |
and Over- |
and |
Current |
Savings |
Over- |
and Over- |
and |
|
|
|
Deposits |
Deposits |
drafts |
drafts |
Limits |
Deposits |
Deposits |
drafts |
drafts |
Limits |
1 |
2 |
3 |
4 |
5 |
6 |
7 |
8 |
9 |
10 |
11 |
ANDHRA PRADESH |
26.1 |
8.3 |
29.9 |
27.7 |
21.8 |
45.4 |
8.3 |
7.7 |
15.7 |
14.6 |
ASSAM |
60.1 |
4.9 |
15.7 |
42.3 |
22.6 |
- |
- |
- |
- |
- |
BIHAR |
40.9 |
3.9 |
19.6 |
31.7 |
15.5 |
- |
- |
- |
- |
- |
GUJARAT |
53.5 |
6.2 |
19.5 |
34.9 |
25.2 |
61.8 |
6.2 |
24.8 |
39.6 |
29.5 |
HARYANA |
98.6 |
5.0 |
16.4 |
44.5 |
24.1 |
- |
- |
- |
- |
- |
JAMMU & KASHMIR |
21.3 |
4.5 |
9.8 |
13.8 |
10.7 |
- |
- |
- |
- |
- |
KARNATAKA |
68.1 |
7.3 |
15.2 |
31.6 |
23.2 |
41.0 |
6.6 |
17.7 |
24.6 |
20.0 |
KERALA |
55.7 |
13.0 |
13.6 |
30.5 |
25.6 |
- |
- |
- |
- |
- |
MADHYA PRADESH |
41.9 |
5.5 |
15.4 |
22.5 |
15.7 |
99.6 |
12.4 |
16.6 |
50.2 |
39.2 |
MAHARASHTRA |
99.5 |
5.1 |
11.3 |
40.4 |
29.6 |
84.9 |
6.3 |
8.6 |
22.9 |
19.8 |
ORISSA |
36.9 |
7.3 |
12.5 |
20.5 |
16.7 |
- |
- |
- |
- |
- |
PUNJAB |
45.2 |
4.0 |
20.8 |
33.8 |
20.2 |
75.2 |
5.2 |
15.4 |
37.5 |
26.5 |
RAJASTHAN |
63.8 |
5.6 |
22.2 |
37.5 |
26.6 |
39.8 |
4.1 |
6.9 |
19.4 |
14.5 |
TAMIL NADU |
62.7 |
8.2 |
12.6 |
27.6 |
21.9 |
47.1 |
23.9 |
15.4 |
25.4 |
25.1 |
UTTAR PRADESH |
60.6 |
4.2 |
26.0 |
43.1 |
19.8 |
95.6 |
4.8 |
24.7 |
60.6 |
33.9 |
WEST BENGAL |
30.0 |
3.6 |
34.8 |
31.7 |
16.0 |
48.1 |
7.1 |
14.4 |
26.2 |
20.6 |
DELHI |
- |
- |
- |
- |
- |
55.4 |
5.7 |
15.5 |
30.4 |
22.3 |
OTHERS |
46.9 |
9.9 |
4.3 |
9.0 |
9.1 |
- |
- |
- |
- |
- |
ALL-INDIA |
53.0 |
5.7 |
14.5 |
28.7 |
20.0 |
64.8 |
7.7 |
11.9 |
26.2 |
21.8 |
The turnover rate of savings deposits of State Bank of India in the states was found to be in the range of 2.5 to 8.5. In respect of Nationalised Banks the range is from 2.7 to 7.9. So far as Regional Rural Banks are concerned the turnover rates of savings deposits were in the range of 2.5 to 9.6. As regards Other Scheduled Commercial Banks this rate fluctuated over a wider range of 3.1 to 47.7 over the states. |
The bank group-wise analysis of cash credit and overdraft limits reveals that State Bank and its Associates had the highest turnover rate in the state of Uttar Pradesh (32.6). For the nationalised banks turnover rate of cash credit and overdraft found to be highest in the state of Andhra Pradesh (28.1). In Gujarat (39.0), regional rural banks had the highest turnover of cash credit and overdraft limits. Whereas the same was highest in Punjab (48.1) for the Other Scheduled Commercial Banks. |
|
|
|
* |
Prepared in the Banking Statistics Division of the Department of Statistical Analysis and Computer Services. The previous article covering the period 1995-96 was published in the March 1998 issue of the Reserve Bank of India Bulletin. |


