 IST,
IST,


Finances of State Governments - 2003-04: A Summary of Major Features
This article presents a quick overview1 of the finances of the State Governments during the years 2001-02, 2002-03 and 2003-04, mainly based on their Budgets and other supplemental information received from them2. The aggregate gross fiscal deficit (GFD) of States, although higher in absolute terms, declined marginally in terms of GDP to 4.2 per cent in 2001-02, from 4.3 per cent in 2000-01. The fiscal out-turn of States in 2002-03 (revised estimates), however, witnessed deterioration with GFD reaching 4.7 per cent of GDP. The absolute increase in GFD during 2001-02 was primarily driven by the revenue deficit, which accounted for about 88 per cent of the increase. In comparison, the increase in GFD during 2002-03 was mainly on account of higher capital outlay and net lending. The GFD in the revised estimates for 2002-03 which constituted 4.7 per cent of GDP was also higher than the budget estimates for the year at 4.0 per cent of the GDP. The deviation in the revised estimates from the budget estimates for 2002-03 reflected: (i) shortfall in revenue receipts in the wake of widespread drought; and (ii) increase in aggregate expenditure mainly on account of capital expenditure. However, States were, by and large, able to contain their revenue expenditure at the budgeted level in 2002-03. The large and growing GFD of the States pushed up their outstanding debt which rose from 25.7 per cent of GDP in 2001-02 to 28.1 per cent of GDP in 2002-03.
Measures envisaged in the State Budgets for 2003-04 reflect continued efforts towards revenue augmentation, expenditure management and public sector reforms. Reflecting these measures, the aggregate revenue deficit of States is budgeted to decline from 2.5 per cent of GDP in 2002-03 to 1.8 per cent of GDP in 2003-04. With narrowing revenue deficit, the aggregate GFD of the States is expected to decline from 4.7 per cent of GDP in 2002-03 to 4.0 per cent of GDP in 2003-04.
This article contains six sections: Section I provides a broad overview of the policy initiatives as proposed in the State budgets for 2003-04. A brief analysis of the State finances in 2001-02 is presented in Section II, while Section III focuses on the fiscal performance based on the revised estimates for the year 2002-03. An analysis of the receipts and expenditures as per the budget estimates for 2003-04 is provided in Section IV. The aggregate public debt, market borrowings and outstanding guarantees of the State Governments are presented in Section V. Section VI concludes with the observations and emerging issues in State finances.
Section I
Policy Developments
The States have initiated several measures towards fiscal consolidation which include measures for revenue augmentation, expenditure containment and other institutional reforms like PSU restructuring and power sector reforms. On the revenue front, strengthening of tax efforts and rationalisation of user charges mainly relating to power, water and transport are underway. With regard to the value added tax (VAT), preparatory work towards its introduction is in progress. In view of the apprehensions expressed by a large number of States, the Union Budget for 2003-04 envisaged that the Central Government would compensate 100 per cent of the loss in the first year, 75 per cent of the loss in the second year and 50 per cent in the third year on account of the introduction of VAT by the States. The implementation of VAT has, however been postponed subsequent to the Union Budget. Further, the Union Budget 2003-04 proposed a constitutional amendment to enable levy of tax on services as a specific and important source of revenue. This constitutional amendment, and the consequent legislation would give the Central Government the power to levy the tax and give sufficient powers to both the Central and the State Governments to collect the proceeds.
On the expenditure front, a number of States have proposed to continue their efforts towards containment of revenue expenditure through restrictions on fresh recruitment/creation of new posts and curbs on the increase in administrative expenditure. Some States have proposed introduction of a contributory pension scheme for their newly recruited staff.
The institutional reforms proposed by the States are essentially to strengthen the process of fiscal consolidation and there are signs of intensification of these efforts. Some States have initiated measures to provide statutory backing to fiscal reforms through enabling legislation. The objective is to eliminate revenue deficit and contain fiscal deficit in the medium term. The States of Karnataka, Punjab, Kerala and Tamil Nadu have already enacted such Fiscal Responsibility legislations. The fiscal responsibility bill has also been introduced in the legislature of Maharashtra.
The Central Government has also initiated measures to encourage fiscal reforms at the State level. Based on the recommendations of the Eleventh Finance Commission, the Central Government has set up an Incentive Fund for encouraging fiscal reforms in the States on the basis of a monitorable fiscal reform programme under the 'States Fiscal Reforms Facility' (2000-01 to 2004-05). Under this scheme, the States draw up a Medium-Term Fiscal Reforms Programme (MTFRP) by setting targets for broad fiscal indicators in the medium term and by covering various aspects such as fiscal consolidation, public sector enterprise reforms, power sector reforms and fiscal transparency. The Planning Commission is also extending support to the MTFRP by ensuring that the Annual Plan framework is consistent with it.
The immediate concern about the increasing interest burden of States has prompted the introduction of debt-swap scheme on mutual agreement between the Central and the State Governments (for details, see section V). Recognising the need to reduce the interest burden of the States, all loans from the Centre to the State Governments bearing interest rates in excess of 13 per cent are to be swapped with market borrowings and small savings proceeds at prevailing interest rates over a period of three years ending 2004-053 .
The Twelfth Finance Commission which was constituted on November 1, 2002 is expected to make recommendations regarding distribution of net tax proceeds between the Union and the States, and to review evolving principles governing grants-in-aid to the States as also review the fiscal reform facility introduced by the Central Government (Box No. 1).
Box No. 1 : Twelfth Finance Commission In pursuance of the provisions of Article 280 of the Constitution of India, and of the Finance Commission (Miscellaneous Provisions) Act, 1951, the Twelfth Finance Commission was constituted in November 2002 with Dr. C. Rangarajan as the Chairman. As per the terms of reference, the Commission shall make recommendations on the following:
The Commission is mandated to review and suggest restructuring of the finances of the Union and the States with a view to generating surpluses for capital investment and reducing the fiscal deficit. The Commission would also look into various other issues such as, taxation efforts of the Central and State Governments as against the targets; potential for additional resources mobilisation; monitoring expenditure on the non-salary component of maintenance and upkeep of capital assets; adjustment of user charges and relinquishing of non-priority enterprises through privatisation or disinvestments, etc. In addition, the Commission is also required to review the fiscal reforms facility introduced by the Central Government on the basis of the recommendations of Eleventh Finance Commission and suggest measures for effective achievement of its objective. The Commission may, after making an assessment of the debt position of the States as on the 31st March 2004, suggest such corrective measures, as are deemed necessary, consistent with debt sustainability and macroeconomic stability with equitable growth. The present arrangements for financing of Disaster Management through the National Calamity Contingency Fund and the Calamity Relief Fund would also fall under the purview of the Commission. The Commission is expected to submit its report by July 31, 2004 covering a period of five years commencing on April 1, 2005. |
With the power sector reforms gaining importance in recent years, 22 States have either constituted or notified the constitution of State Electricity Regulatory Commissions (SERCs) for determining tariff structure. Of these, SERCs of 15 States have issued tariff orders. Other measures undertaken in this regard include unbundling of electricity boards into separate entities for power generation, transmission and distribution, increasing power tariffs, measures for reducing transmission and distribution losses, etc. Based on the recommendation of the Ahluwalia Committee (2001), a scheme for one-time settlement of outstanding dues of the State Electricity Boards (SEBs) to Central Public Sector Undertakings (CPSUs) was finalised. Under the scheme, the State Governments have issued bonds worth Rs.28,984 crore to the CPSUs against their outstanding dues at a tax-free interest rate of 8.5 per cent per annum repayable over 10 years after a moratorium period of five years. Subject to the approval of the Reserve Bank, 10 per cent of the bonds can be off-loaded in the market each year for trading. The Tripartite Agreements (TPA) in this regard have been signed among the Government of India, the Reserve Bank and 28 State Governments.
Section II
State Finances: 2001-02
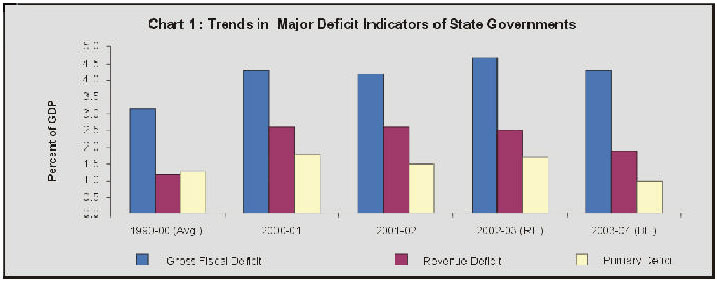
The aggregate gross fiscal deficit of the States increased from Rs.89,532 crore in 2000-01 to Rs.95,986 crore in 2001-02. While the GFD of States rose in absolute term, in terms of GDP, there was marginal improvement from 4.3 per cent in 2000-01 to 4.2 per cent in 2001-02. By and large, the increase in GFD was due to revenue deficit (Table A) which accounted for about 88 per cent of the increase. A noteworthy development was the decline in the primary deficit, both in absolute term as well as in terms of GDP (Table A & Chart 1).
Table A : Major Deficit Indicators of State Governments | ||||||
(Rs. crore) | ||||||
2003-04 | 2002-03 | 2002-03 | 2001-02 | 2000-01 | ||
(BE) | (RE) | (BE) | ||||
1 | 2 | 3 | 4 | 5 | 6 | |
Gross Fiscal deficit | 1,08,861 | 1,16,730 | 1,02,882 | 95,986 | 89,532 | |
(4.0) | (4.7) | (4.0) | (4.2) | (4.3) | ||
Revenue Deficit | 49,008 | 61,302 | 48,314 | 59,233 | 53,569 | |
(1.8) | (2.5) | (1.9) | (2.6) | (2.5) | ||
Primary Deficit | 26,573 | 42,584 | 30,629 | 33,497 | 37,830 | |
(1.0) | (1.7) | (1.2) | (1.5) | (1.8) | ||
RE: Revised Estimates . | BE: Budget Estimates. | |||||
Note: Figures in brackets are per cent of GDP. | ||||||
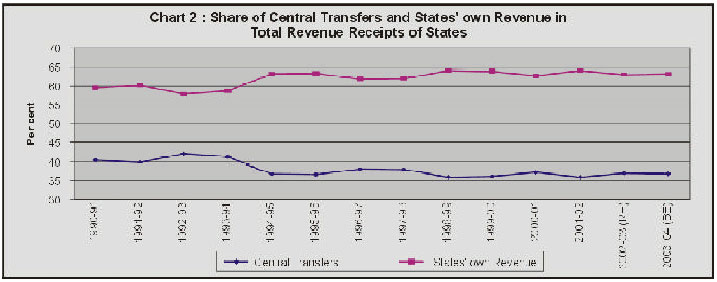
The revenue receipts of States at Rs.2,55,599 crore in 2001-02 were higher by 7.4 per cent over the previous year. The growth in revenue receipts was mainly facilitated by States' own tax receipts and grants from the Centre. The States' own revenue receipts (States' own tax and non tax revenue receipts) accounted for about 83 per cent of the increase in revenue receipts while the balance was on account of current transfers from the Centre. Under the States' non-tax revenues, receipts on account of dividends and profits and interest showed a decline in 2001-02 from the previous year. Total current transfers from the Centre accounted for about 36 per cent of total revenue receipts in 2001-02 as against 37.2 per cent in 2000-01 (Chart 2).
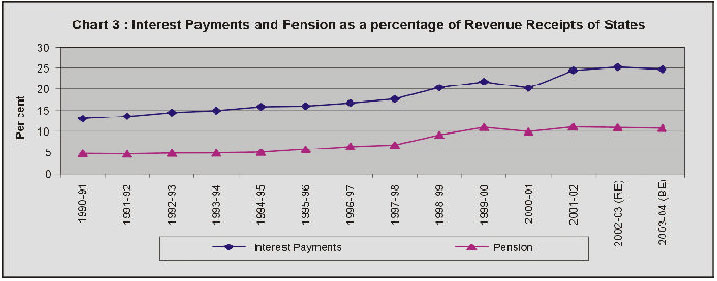
The aggregate expenditure of the States at Rs.3,77,555 crore in 2001-02 was higher by 8.7 per cent than Rs.3,47,198 crore in the previous year. Of the total increase in expenditure, revenue expenditure accounted for 77 per cent, while the balance was on account of capital expenditure (Table 2). Further disaggregation of expenditure into developmental and non-developmental components reveals that the share of non-developmental expenditure in total expenditure increased from 34.2 per cent in 2000-01 to 36.6 per cent in 2001-02. Within non-developmental expenditure, interest and pension payments together accounted for 28.8 per cent of the total revenue expenditure. These two items together pre-empted 35.5 per cent of revenue receipts in 2001-02 (Chart 3).
The capital receipts of States at Rs.1,24,507 crore in 2001-02 showed an increase of 11.6 per cent over the previous year. Out of the total increase in capital receipts, market borrowings and special securities issued to the National Small Savings Fund (NSSF) accounted for about 44 per cent and 41 per cent, respectively, while the balance was on account of loans from the Centre, loans from banks and financial institutions, recovery of loans and advances, etc. In financing the GFD, the small savings receipts (Special securities issued to NSSF) and market borrowings accounted for a significant share (Table 5).
Section III
Revised Estimates: 2002-03
The revised estimates for 2002-03 showed that all the major deficit indicators, viz., GFD, revenue deficit and primary deficit were higher than the level in the previous year (Table A). The GFD increased from Rs.95,986 crore (4.2 per cent of GDP) in 2001-02 to Rs.1,16,730 crore (4.7 per cent of GDP) in 2002-03. It is important to note that capital outlay and net lending accounted for about 45 per cent each in the total increase of Rs.20,744 crore in GFD in 2002-03, while the revenue deficit accounted for only 10 per cent of the increase.
The increase in revenue deficit was less pronounced than that in the GFD and the primary deficit. This was mainly due to the fact that revenue receipts at Rs.2,93,873 crore in 2002-03 increased at a faster rate of 15.0 per cent compared with a 12.8 per cent increase in the revenue expenditure. A major proportion of the increase in revenue receipts (56 per cent) was contributed by States' own revenue receipts (States' own tax and non-tax receipts), particularly States' own taxes. Within current transfers from the Centre, the increase in Central grants (28.7 per cent) was significant (Table 3).
The increase in capital receipts of States in 2002-03 was mainly on account of market borrowings, special securities issued to the National Small Savings Fund (NSSF) and loans from the Centre (Table 4).
The gross transfers from the Centre in the form of States' share in Central taxes, grants and loans from the Centre (excluding States' share in small savings collections) in 2002-03 were higher by 21.4 per cent over the previous year. The increase was mainly due to grants from the Centre (Table 9).
The aggregate expenditure at Rs.4,42,609 crore in 2002-03 showed a rise of 17.2 per cent over the previous year. Revenue expenditure contributed 62 per cent of the total increase in aggregate expenditure while the rest was on account of capital expenditure. Component-wise details of aggregate expenditure of States reveal that, in 2002-03, the growth rate in capital expenditure was more than that of the revenue expenditure. While revenue expenditure increased by 12.8 per cent, the capital expenditure was higher by 39.4 per cent (capital expenditure net of repayment of loans to the Centre increased by 32.9 per cent). The share of capital expenditure in the aggregate expenditure rose from 16.6 per cent in 2001-02 to 19.8 per cent in 2002-03. The share of capital expenditure net of repayments of loans to the Centre, however rose from 13.0 per cent of aggregate expenditure in 2001-02 to 14.8 per cent in 2002-03. Further disaggregation of expenditure into developmental and non-developmental components reveal that the non-developmental expenditure showed a higher growth than the developmental expenditure causing a decline in the share of developmental component from 57.4 per cent in 2001-02 to 56.0 per cent in 2002-03 (Table B).
The decomposition of gross fiscal deficit reveals that the revenue deficit continued to account for a significant proportion of GFD, even though the increase in revenue deficit during the year was less. There was a decline in the share of revenue deficit in the GFD to 52.5 per cent in the revised estimates for 2002-03 from 61.7 per cent in the previous year. The shares of capital outlay and net lending, on the other hand, increased from 33.6 per cent and 4.7 per cent in 2001-02 to 35.6 per cent and 11.8 per cent, respectively, in the revised estimates for 2002-03 (Table 6).
Table B : Expenditure Pattern of State Governments | ||||||
(Rs. Crore) | ||||||
2003-04 | 2002-03 | 2002-03 | 2001-02 | |||
(BE) | (RE) | (BE) | ||||
1 | 2 | 3 | 4 | 5 | ||
1 | Developmental | 2,60,977 | 2,47,873 | 2,46,181 | 2,16,629 | |
Expenditure | (54.8) | (56.0) | (57.1) | (57.4) | ||
2 | Non-Dev elopmental | 1,77,025 | 1,60,596 | 1,60,296 | 1,38,062 | |
Expenditure | (37.2) | (36.3) | (37.2) | (36.6) | ||
3 | Others* | 38,037 | 34,140 | 24,365 | 22,863 | |
(8.0) | (7.7) | (5.7) | (6.1) | |||
Total Expenditure | 4,76,039 | 4,42,609 | 4,30,842 | 3,77,554 | ||
(1+2+3) | (100.0) | (100.0) | (100.0) | (100.0) | ||
* | Includes expenditure towards compensation and assignments to local bodies, grants-in-aid and contribution, reserve with finance departments, discharge of internal debt and repayment of loans to the Centre. | |||||
Note : | Figures in brackets are per cent of total expenditure. | |||||
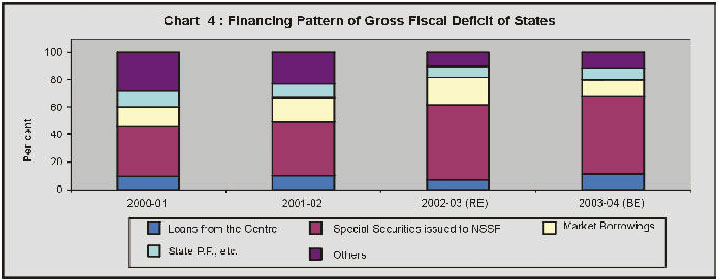
The financing pattern of the GFD of States indicates that, in 2002-03, the small savings receipts (special securities issued to NSSF) constituted a significantly high proportion (42.7 per cent). The share of small savings receipts and market borrowings increased during 2002-03, while those of loans from the Centre and other sources of financing the GFD (including loans from Financial Institutions, Provident Funds, Reserve Funds, deposits and advances) declined (Chart 4). The increase in the share of market borrowings also reflect additional market borrowings allocated under the debt-swap scheme.
Revised Estimates vis-a-vis Budget Estimates: 2002-03
A comparative analysis of revised estimates vis-a-vis budget estimates for 2002-03 indicates deviation in the major deficit indicators of the State Governments. The GFD of States at Rs.1,16,730 crore in the revised estimates was higher than the budget estimates by 13.5 per cent (Table A).
The revenue receipts of States at Rs.2,93,873 crore in the revised estimates for 2002-03 experienced a shortfall of the order of 4.2 per cent vis-a-vis the budget estimates due to slippage in the States' share in Central taxes (of 14.9 per cent), States' own non-tax receipts (of 4.9 per cent) and States' own taxes (of 2.1 per cent). On the contrary, grants from the Centre were higher than the budget estimates (Table C).
The deviation in the total expenditure in revised estimates from the budget estimates was on account of higher capital expenditure (15.5 per cent), mainly due to repayment of loans to the Centre including repayments under the debt-swap scheme. The capital expenditure net of repayment of loans to the Centre, however, showed an increase of only 3.7 per cent. On the other hand, capital outlay in the revised estimates for 2002-03 fell short of budget estimates (Table 6).
Table C: Total Receipts of The State Governments | |||||
(Rs Crore) | |||||
2002-03 | 2002-03 | 2001-02 | Variations | ||
(RE) | (BE) | (Col.2 over 3) | |||
Amount | Per cent | ||||
1 | 2 | 3 | 4 | 5 | 6 |
Total Receipts (1+2) | 4,37,292 | 4,25,656 | 3,80,107 | 11,637 | 2.7 |
(17.7) | (16.6) | (16.6) | |||
1 Revenue | 2,93,873 | 3,06,844 | 2,55,599 | -12,972 | -4.2 |
Receipts (a+b) | (11.9) | (12.0) | (11.1) | ||
a) Tax Revenues | 2,02,518 | 2,15,050 | 1,80,275 | -12,531 | -5.8 |
(8.2) | (8.4) | (7.9) | |||
(i) States’ own | 1,49,358 | 1,52,590 | 1,31,710 | -3,232 | -2.1 |
taxes | (6.0) | (6.0) | (5.7) | ||
(ii) Shareable | 53,160 | 62,459 | 48,565 | -9,299 | -14.9 |
taxes | (2.2) | (2.4) | (2.1) | ||
b) Non-Tax | 91,355 | 91,795 | 75,324 | -440 | -0.5 |
Revenues | (3.7) | (3.7) | (3.3) | ||
(i) Grants | 55,401 | 54,008 | 43,048 | 1,393 | 2.6 |
(2.2) | (2.2) | (1.9) | |||
(ii) States’ own | 35,954 | 37,787 | 32,276 | -1,833 | -4.9 |
non-taxes | (1.5) | (1.5) | (1.4) | ||
2 Capital Receipts | 1,43,419 | 1,18,811 | 1,24,507 | 24,608 | 20.7 |
(5.8) | (4.6) | (5.4) | |||
Note : Figures in brackets are per cent of GDP. | |||||
Section IV
Budget Estimates 2003-04
The States' budgets for 2003-04 envisage continued efforts towards fiscal consolidation through augmentation of revenue and containment of expenditure. The GFD of States is budgeted lower at Rs. 1,08,861 crore (4.0 per cent of GDP) in the budget estimates for 2003-04 as against Rs.1,16,730 crore (4.7 per cent of GDP) in the revised estimates for 2002-03. The decline in GFD is mainly on account of expected improvement in the revenue account of States in 2003-04 over the previous year. The other major deficit indicators viz., revenue deficit and primary deficit are also budgeted lower in 2003-04 over the previous year (Table 1).
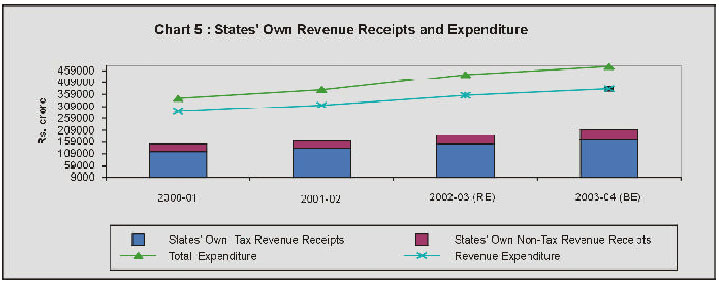
The revenue receipts of the States are budgeted to rise from Rs. 2,93,873 crore in 2002-03 to Rs.3,32,919 crore in 2003-04. Out of the total increase in revenue receipts, States' own revenue receipts (States' own tax and non-tax) would contribute about 65 per cent, while the rest would be accounted by States' share in Central taxes and grants from the Centre. Total tax receipts comprising States' own taxes and States' share in Central taxes at Rs.2,27,094 crore would be higher by 12.1 per cent than the revised estimates. At this level, tax receipts would account for 68.2 per cent of total revenue receipts, while non-tax receipts would account for the rest. Under non-tax receipts, the growth rate in Central grants is budgeted to decelerate, while States' own non-tax receipts would be higher in 2003-04 over the revised estimates. Consequently, the share of States' own revenue receipts in financing the total expenditure of States is expected to be higher in 2003-04 than the revised estimates for 2002-03 (Chart 5).
The gross transfers from the Centre in the form of States' share in Central taxes, grants and loans from the Centre (excluding States' share in small savings collections) are budgeted higher at Rs.1,56,282 crore (5.7 per cent of GDP) in 2003-04, an increase of 12.6 per cent over the revised estimates for 2002-03. (Table 9).
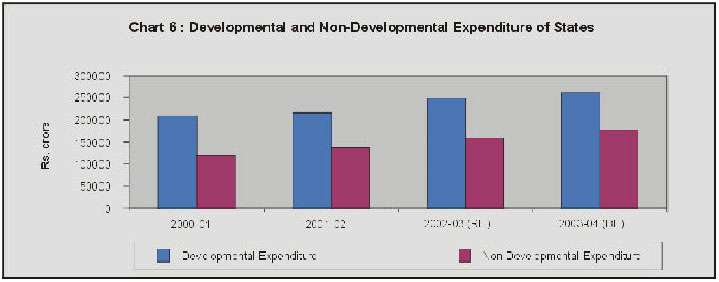
Aggregate expenditure is budgeted higher at Rs. 4,76,039 crore (17.4 per cent of GDP) in 2003-04 than Rs. 4,42,609 crore (17.3 per cent of GDP) in the revised estimates of 2002-03. However, reflecting the increasing efforts by the State Governments in containing expenditure, the growth rate in aggregate expenditure is budgeted to decelerate from 17.2 per cent in 2002-03 to 7.6 per cent in 2003-04. Component-wise, the deceleration in expenditure is pronounced in capital expenditure (Table D). Further, the growth rate in developmental and non-developmental expenditure would also decelerate in 2003-04 from 2002-03 (Chart 6 and Table 7 & 8).
Table D : States' Fiscal Position | |||||
(Rs. Crore) | |||||
2003-04 | 2002-03 | Variation | |||
(BE) | (RE) | (Col. 2 over 3) | |||
Amount | Per cent | ||||
1 | 2 | 3 | 4 | 5 | |
Aggregate Receipts | 4,69,446 | 4,37,292 | 32,154 | 7.4 | |
(18.4) | (17.7) | ||||
Revenue Receipts | 3,32,919 | 2,93,873 | 39,046 | 13.3 | |
(13.0) | (11.9) | ||||
Capital Receipts | 1,36,527 | 1,43,419 | -6,892 | -4.8 | |
(5.3) | (5.8) | ||||
Total Expenditure | 4,76,039 | 4,42,609 | 33,430 | 7.6 | |
(18.6) | (17.9) | ||||
Revenue Expenditure | 3,81,927 | 3,55,175 | 26,752 | 7.5 | |
(14.9) | (14.4) | ||||
Capital Expenditure | 94,112 | 87,434 | 6,678 | 7.6 | |
(3.7) | (3.5) | ||||
Note : | Figures in brackets are per cent of GDP. | ||||
The financing pattern of GFD indicates that the small savings receipts (Special securities issued to NSSF) would continue to contribute a major share in 2003-04. As per the budget estimates for 2003-04, the small savings receipts and loans from the Centre would be higher than the previous year and would finance about 46 per cent and 11 per cent respectively, of the total GFD.
Section V
States' Debt, Market Borrowings and Guarantees
Debt Position
The large and increasing GFD of States has led to a steady rise in the outstanding debt of State Governments in recent years. The outstanding debt of States rose by 17.7 per cent from Rs. 5,89,797 crore at end-March 2002 to Rs. 6,94,289 crore at end-March 2003. In terms of GDP, the debt stock of States constituted 28.1 per cent as at the end of March 2003, which was higher than the level of 25.7 per cent in the previous year. The debt-GDP ratio of States is estimated to increase further to 28.8 per cent by the end of March 2004.
As a result of the rising debt level, the interest burden of States increased from 13 per cent of revenue receipts in 1990-91 to as much as 24.4 per cent in 2001-02. Keeping in view the prevailing soft interest rate scenario, the recently announced debt-swap scheme would help the State Governments to bring down their interest burden to some extent (Box No. 2).
Market Borrowings
During 2002-03, the State Governments raised Rs.30,853 crore through market borrowings (Rs.27,880 crore through tap issuances and Rs.2,973 crore through auctions)-an increase of 65 per cent over Rs.18,707 crore (Rs.15,942 crore through tap issuances and Rs.2,765 crore through auctions) raised during 2001-02.
The declining trend in interest rate on market borrowings of the State Governments continued during the years 2001-02 and 2002-03. The interest rate on market borrowings of the State Governments ranged between 8.0 per cent and 6.7 per cent in 2002-03 as compared with a range of 10.5 per cent and 7.8 per cent in 2001-02. During the year 2002-03, the weighted average interest rate on States' market borrowings was 7.5 per cent, which was lower than 9.2 per cent in the previous year. During 2003-04 (up to October 31, 2003), the interest rate on market borrowings ranged from 6.40 per cent to 5.85 per cent.
Box No. 2 : Debt-Swap Scheme The Union Budget for 2003-04 announced a debt-swap scheme that would enable States to prepay their high cost debt. Under the mutually agreed scheme between the Central and State Governments, all State loans from the Centre bearing coupons in excess of 13 per cent would be swapped with market borrowings and small savings proceeds at prevailing interest rates over a period of three years ending in 2004-05. This scheme will restrain the debt build-up in States through the small savings scheme. Hopefully, with prudent fiscal management over time, the States would be able to reduce the interest burden to reasonable limits, and free up more resources for developmental purposes. In 2002-03, 25 States (excluding, Maharashtra, Sikkim and West Bengal) prepaid high cost debt from the Centre, partly out of small savings collections and partly through fresh market borrowings of Rs.10,000 crore conducted in two tranches in the months of February and March 2003. The scheme has been continued in 2003-04. The States raised Rs. 23,000 crore in the current financial year up to October 31, 2003 for this purpose. |
The gross and net market borrowings allocated for States for the fiscal year 2003-04 (provisional) amount to Rs. 40,802 crore and Rs.36,657 crore, respectively. This is inclusive of the additional allocation of Rs. 23,000 crore towards debt-swap scheme. During the current year so far (up to October 31, 2003), the State Governments have raised Rs.38,752 crore (Rs.36,357 crore through tap sale and Rs.2,394.8 crore through auctions) under the market borrowing programme, of which Rs.23,000 crore was raised under the debt swap scheme. In order to elongate the maturity profile of State loans, a 12 year bond was issued on August 25, 2003 through tap sale of 6.20 State development loan (SDL) 2015.
Contingent Liabilities
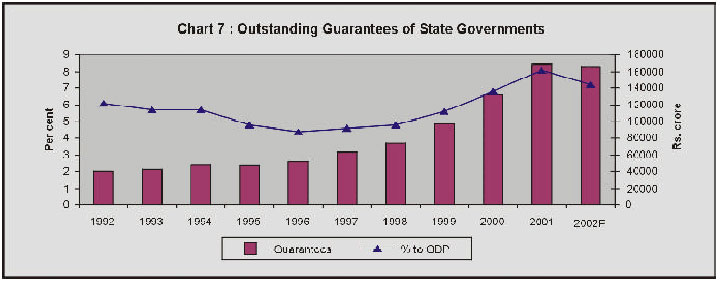
Although contingent liabilities do not form a part of the debt burden of the States, in the event of default by the borrowing agency, the States will be required to meet the debt service obligations. The outstanding guarantees of State Governments have shown a rising trend during the 1990s. The outstanding guarantees of State Governments increased from Rs.1,32,029 crore (6.8 per cent of GDP) as at end-March 2000 to Rs.1,68,712 crore (8.1 per cent of GDP) as at end-March 2001. However, these are estimated to be lower at Rs.1,66,116 crore at end-March 2002 (7.2 per cent of GDP)(Chart 7).
In view of the fiscal implication of rising level of guarantees, many States have taken initiatives to place ceilings on guarantees. Statutory ceilings on guarantees have been instituted by Goa, Gujarat, Karnataka, Sikkim and West Bengal, while States of Assam, Orissa and Rajasthan have imposed administrative ceilings on guarantees.
Ways and Means Advances (WMA) of States
The Reserve Bank of India revised the Scheme of Ways and Means Advances for the States, effective March 3, 2003 based on the recommendations of the Ramachandran Committee (2002) and after consultations with the State Governments (Box 3). As per the revised scheme of WMA, the total normal WMA limit for State Governments has been enhanced by 18.8 per cent to Rs.7,170 crore from the earlier limit of Rs.6,035 crore.
Box 3. Revised Scheme of Ways and Means Advances (WMA) to State Governments from March 3, 2003 The Reserve Bank of India provides WMA to States with a view to help them tide over temporary mismatches in cash flow. The scheme is revised from time to time. The Reserve Bank of India had constituted an Advisory Committee in October 2002 to review the existing system of normal WMA, special WMA and overdraft to the State Governments (Chairman: Shri C.Ramachandran, former Secretary (Expenditure). Based on the recommendations of the Ramachandran Committee and in consultations with the State Governments, the Reserve Bank of India revised the Scheme of Ways and Means Advances for the State Governments effective from March 3, 2003. The main features of the revised scheme are as follows:
The Scheme will be reviewed in its totality on receipt of the recommendations of the 12th Finance Commission. |
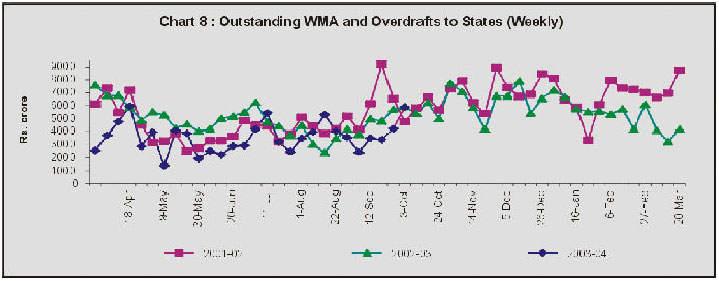
The recourse to WMA and OD by States during 2002-03 was generally lower than that in the previous year, reflecting improved management of cash flows (Chart 8). The number of States resorting to overdrafts during the year 2002-03 was, however, marginally higher at 21 as compared with 20 such States in the previous year.
The outstanding WMA and OD of State Governments at Rs 3,147 crore as on October 17, 2003 was marginally lower by 41.6 per cent than that of Rs.5,385 crore as on October18, 2002. There has been a sharp increase in States' resort to special WMA because of the new stipulation under which State Governments have to avail of special WMA before seeking accommodation under the normal WMA.
Section VI
Concluding Observations
The finances of State Governments have been under continuous stress due to slowdown in revenue receipts and increase in the non-developmental revenue expenditure, especially of a committed nature. This has been a constraining factor in the States' effort to augment their developmental expenditure. Fiscal developments in 2002-03 indicate continued pressure on State finances. The escalation in the borrowing requirements of the State Governments over the years has led to continuous rise in the level of States' debt.
On the revenue front, near stagnation in tax-GDP ratio has been an area of concern. As the States have to play an important role in the provision of social and economic services, measures aimed at higher revenue realisation should be given top priority. Fiscal empowerment through revenue augmentation therefore, becomes crucial. State Governments have, no doubt, taken some steps, to augment both tax and non-tax revenue. In the tax reform process, improving tax compliance and rationalising tax structure are crucial, even though the implementation of VAT at the national level still remains a challenge. The constitutional amendment proposed in the Union Budget for 2003-04 to grant the Central Government the power to levy tax on services, and give sufficient powers to both the Central and the State Governments to collect the proceeds, would facilitate revenue augmentation. Adoption of appropriate user charges for the services provided by the States would also help the States to improve their non-tax resources. In this direction, 22 States have set up State Electricity Regulatory Commission in order to determine electricity tariff in a rational and remunerative manner. Further, some of the States have also increased user charges.
On the expenditure front, the States have taken several measures to contain their non-developmental revenue expenditure, though most of them are committed in nature. Few have already initiated measures to reduce the wage bill by way of restricting fresh recruitments. In the context of increasing pension payments, pension reforms at the State level assume importance. Urgent reforms are called for to rein in the burgeoning pension-bills. As regards interest payments, the decline in interest rates in recent years has helped in containing the debt service burden of States. Further, the debt-swap scheme would help the States to reduce their interest payments, and subsequently free up more resources for developmental purposes.
The reforms in power sector assume critical importance in view of their fiscal implications. In the wake of the scheme for onetime settlement of outstanding dues of the SEBs to CPSUs, the States would also be required to make provisions for debt servicing in respect of power bonds issued to CPSUs from 2006-07 to 2015-16. Public sector enterprise reforms through restructuring, privatisation, disinvestments and closing down of unviable and loss-making units are also being undertaken at the State level.
* Prepared in the Division of State and Local Finances of the Department of Economic Analysis and Policy.
1. A detailed study of the State Budgets is under preparation and will be published separately. 2. The analysis is based on the budgets of 28 States and the National Capital Territory of Delhi, of which three are vote-on-account, and uses supplementary information received from States. 3. During 2003-04 (up to October 31, 2003), States have raised Rs. 23,000 crore through additional market borrowings permitted under the Debt-Swap scheme, at the interest rate ranging 6.20 per cent to 6.35 per cent.

இந்த பக்கத்தை பகிரவும்:


இந்திய ரிசர்வ் வங்கி மொபைல் செயலியை நிறுவுங்கள் மற்றும் சமீபத்திய செய்திகளுக்கான விரைவான அணுகலை பெறுங்கள்!
எங்கள் செயலியை நிறுவ QR குறியீட்டை ஸ்கேன் செய்யவும்


கடைசியாக புதுப்பிக்கப்பட்ட பக்கம்:


