
Inflation Expectations Survey of Households: 2014-15 - ஆர்பிஐ - Reserve Bank of India


Inflation Expectations Survey of Households: 2014-15
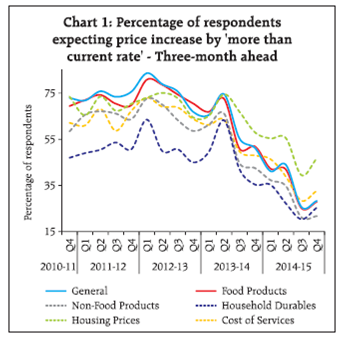
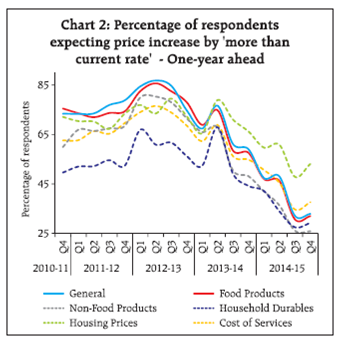
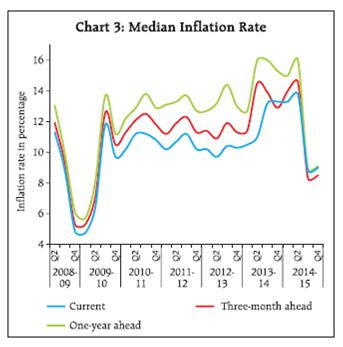
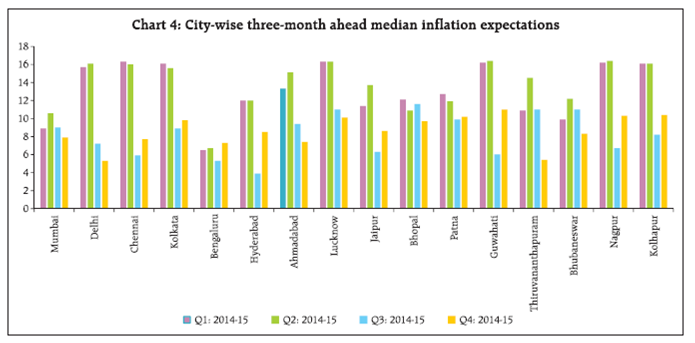
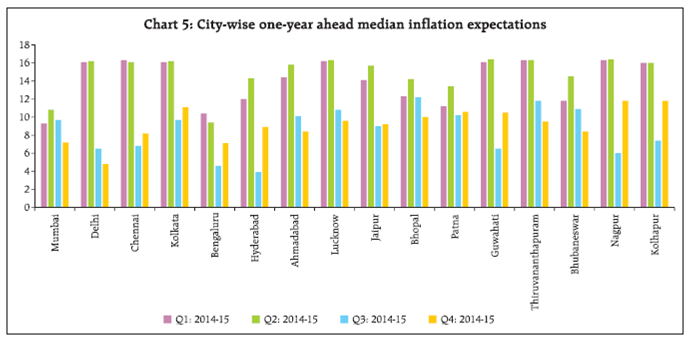
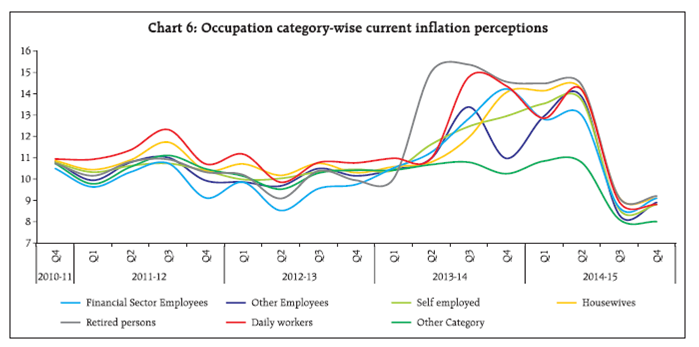
Introduction The Reserve Bank has been conducting Inflation Expectations Survey of Households (IESH) on a quarterly basis, since September 2005. The survey elicits qualitative and quantitative responses on expected price changes and inflation for the next three month period and the next one-year period. Inflation expectations of households are subjective assessments, based on their individual consumption baskets and therefore, may not match the actual inflation numbers released periodically by the Government. These inflation expectations should not be treated as forecast of the official measure of inflation, though they may indicate the course of inflation in the near-term. The quarterly survey results of IESH are released regularly on RBI website. This article presents analysis over a longer horizon covering the last four (36th to 39th) rounds of survey. 2. Sample Coverage and Information Sought The survey is conducted in 16 cities. The major metropolitan cities, viz., Delhi, Kolkata, Mumbai and Chennai are represented by 500 households each, while another twelve cities, viz., Jaipur, Lucknow, Bhopal, Ahmedabad, Patna, Guwahati, Bengaluru, Hyderabad, Kolhapur, Nagpur, Thiruvananthapuram and Bhubaneswar are represented by 250 households each. Total sample size for this survey is 5,000. The respondents are selected from each city to provide a good geographical coverage and ensuring adequate representation of gender and occupation. The survey schedule is organized in four blocks covering the respondent profile in Block 1, general and product group-wise price expectations in Blocks 2 and 3 respectively, and current and expected inflation rates in Block 4. The qualitative response options for price changes are (i) price increase more than current rate, (ii) price increase similar to current rate, (iii) price increase less than current rate, (iv) no change in prices, and (v) decline in prices. The quantitative response on inflation rate is collected in terms of specified intervals - the lowest being ‘less than 1 per cent’ and the highest being ‘16 per cent and above’, with size of each intermediate class being 100 basis points. 3. Survey Results 3.1 Movements of Price Expectations for the next Three-Month and the next One-Year periods: The percentage of respondents, expecting increase in general prices in the next three-month and the next one-year moderated during the financial year 2014-15. These proportions reached a minimum (72.4 per cent and 79.8 per cent respectively) in Q3:2014-15 before moving up marginally in Q4:2014-15. The percentage of respondents, expecting general price to increase by ‘more than current rate’ in the next three-month period decreased from 41.2 per cent in Q1: 2014-15 to 28.3 per cent in Q4:2014-15. Similarly, the said expectations for the next one-year period decreased from 47.4 per cent to 32.9 per cent for the same time horizon. The cross-tabulation of three-month ahead and one-year ahead general price expectations in the last four survey rounds are presented in Tables 3.1 to 3.4. Out of the respondents expecting ‘price increase more than current rate’ during three-month ahead, majority also expected the same for the next one-year period in all the four survey rounds during the year indicating consistently aligned opinion. Moderation in price expectations, as reflected in the decline in percentage of households expecting price increase more than current rate, occurred across all the product groups since Q2:2013-14 (Chart-1). However, the general price expectations are more closely aligned with price expectations on food-product group as compared to other product groups. Comparatively, less number of households expected price to increase more than current rate for ‘household durables’. On the other hand, since Q2:2013-14, highest proportion of households expected price to increase more than current rate for ‘housing prices’. However, this percentage has also declined over time. The trend is similar for both three-month ahead and one-year ahead expectations (Chart 2). 3.2 Respondents’ Current Inflation Perception vis-à-vis Expectations In terms of quantitative responses on inflation rates, the average inflation perception and expectations (three-month ahead and one-year ahead) remained elevated till Q2:2014-15 and then declined sharply to single digit in the last two quarters (Charts 3). It can be observed that inflation expectations broadly moved in tandem with the current inflation perceptions. Also, inflation expectations have been generally higher than the current perceptions. However, the median inflation expectations for three-month ahead period was lower than the current perception in Q3:2014-15 and Q4:2014- 15 - a phenomenon, last observed in Q4:2013-14. Distribution of households’ responses on inflation rate is presented in Table 1. It shows that highest proportion of respondents reported inflation rate as 'more than 16 per cent’ during the first two quarters of 2014-15. Subsequently, the distribution shifted towards the lower rates with higher share of respondents in the range ‘upto 10 per cent’. 3.3 Identification of Major Sources of Variation An analysis of variance (ANOVA) revealed that city has been a significant source of variation for current inflation perceptions and inflation expectations in every round (Table 4). Other significant sources of variation were age-group and occupation-category of the respondents. Age-group was the significant source of variation for current inflation perceptions and three-month ahead inflation expectations in Q2: 2014-15, whereas occupation-category was the significant source of variation for current inflation perceptions, three month and one-year ahead inflation expectations in Q3:2014-15. 3.4 City-wise Inflation Expectations From Charts 4 and 5, it can be seen that in each quarter of the year 2014-15, city-wise expected inflation rates varied considerably reflecting the divergence in consumption and price pattern in each city. Moderation in rate of inflation expectations during the last two quarters of 2014-15 was well spread across the cities (Charts 4 and 5). Hyderabad recorded the lowest inflation expectations for both periods of three-month ahead and one-year ahead in Q3:2014-15 whereas Delhi recorded the lowest in Q4:2014-15 (Table 5). 3.5 Occupation-wise Inflation Perceptions and Expectations Respondents from various occupation categories showed similar trend with respect to inflation perception over the quarters (Chart 6). Generally, retired persons and housewives reported relatively higher inflation rates whereas others category respondents, mainly unemployed and students, reported relatively lower inflation rates. 3.6 Bootstrap Confidence Interval for Estimates of Inflation Rates Drawing 10,000 re-samples using Simple Random Sampling with Replacement (SRSWR), the 99 per cent bootstrap confidence intervals for mean inflation are given in Table 6. It is observed that the confidence interval has a small width indicating that the point estimates are quite precise for estimating the population mean of households’ inflation perceptions and expectations. 4. Conclusions The median rates of inflation perceptions and expectations of households moderated to single digit in second half of 2014-15. The moderation is well spread across the cities and occupational categories covered in the survey. The moderation in price expectations was also observed across various product-groups. Among the product-groups, highest proportion of households expected ‘housing prices’ to increase more than current rate whereas lowest proportion was for 'household durables’. The general price expectations are more closely aligned with price expectations on food products as compared to other product groups. City has been a significant source of variation for inflation perceptions and expectations as observed throughout the survey history. Annex-Data Tables
* Prepared in the Division of Household Surveys, Department of Statistics and Information Management. Reserve Bank of India, Mumbai. The previous annual article was published in June, 2014 issue of the RBI Bulletin. The survey results are based on replies of the respondents and are not necessarily shared by the Reserve Bank. |
||||||||||||||||||||||||||||||||||||||||||||||||||||||||||||||||||||||||||||||||||||||||||||||||||||||||||||||||||||||||||

இந்த பக்கத்தை பகிரவும்:


இந்திய ரிசர்வ் வங்கி மொபைல் செயலியை நிறுவுங்கள் மற்றும் சமீபத்திய செய்திகளுக்கான விரைவான அணுகலை பெறுங்கள்!


