
IV. Monetary Conditions - ஆர்பிஐ - Reserve Bank of India


IV. Monetary Conditions
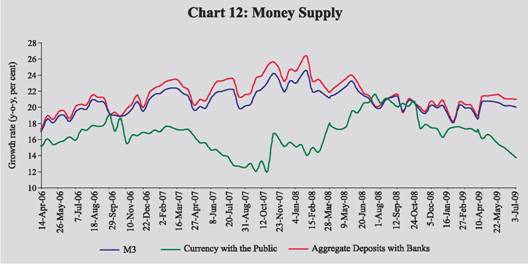
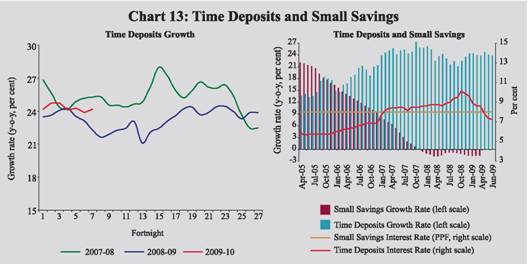
The expansionary and liquidity-enhancing measures taken by the Reserve Bank since September 2008 has ensured ample liquidity in the system, which is evident in the large and sustained absorption of surplus liquidity through the LAF in 2009-10 so far. Broad money growth (year-on-year) remained strong at 20.0 per cent (up to July 3, 2009), driven by robust growth in deposits (21.0 per cent) on the components side and significant increase in banking system's credit to the Government (48.0 per cent) on the sources side. Market absorption of the government borrowing programme was facilitated by dampened demand for credit from the private sector on the backdrop of a high deposits growth.The composition of deposits has been shifting gradually in favour of time deposits since October 2008, partly in response to expectations about deposit rates following the lower policy rates of the Reserve Bank.The deceleration in commercial banks' credit to the commercial sector witnessed over the period October 2008 to May 2009 has started a slow turnaround. IV.1 Monetary aggregates continued to exhibit strong growth in 2009-10 (up to July 3, 2009), mainly reflecting the large increases in commercial banks’ credit to the Government. The expansion in non-food credit, however, moderated to a large extent and net foreign exchange assets with the banking system also declined. Broad money growth during the first quarter of 2009-10 remained strong and above the Reserve Bank’s projected trajectory of 17.0 per cent for the year 2009-10.This was on account of strong growth in deposits, particularly time deposits. In the absence of adequate demand for credit from the private sector, commercial banks stepped up their lending to the Government. The increase in net commercial bank credit to the Government reflected the accommodation of enhanced market borrowing programme of the Government during 2009-10, that was essential to revive the growth momentum of the economy. Expansion in non-food credit to the commercial sector witnessed a sharp deceleration and remained below the Reserve Bank’s projected trajectory of 20.0 per cent growth for the year 2009-10.The reserve money growth during 2009-10 remained low and turned negative, mainly reflecting large reverse repo operations by the Reserve Bank to absorb the surplus liquidity from the system and the decline in net foreign exchange assets (adjusted for valuation) with the Reserve Bank. IV.2 The monetary policy responses since September 2008 have been aimed at mitigating the adverse impact of the global economic crisis on the Indian economy.The conduct of monetary policy had to contend with the speed and magnitude of the contagion and its potential spill-over effects on the domestic economy. Accordingly, since October 11, 2008, the Reserve Bank has reduced CRR by a cumulative 400 basis points to 5.0 per cent, repo rate by 425 basis points to 4.75 per cent and the reverse repo rate by 275 basis points to 3.25 per cent. Reserve Bank also took a series of measures to augment rupee and foreign exchange liquidity to avoid shortage of liquidity as a source for market volatility or contraction in credit.The liquidity conditions have remained easy throughout in the recent period, which was evident from the orderly conditions in the market as well as sustained net absorption under the LAF. Monetary Survey IV.3 Broad money (M3) growth (y-o-y) during 2009-10 (up to July 3, 2009) continued to remain strong, although with some moderation as compared with the high growth a year ago. On a year-on-year (y-o-y) basis, M3 growth was 20.0 per cent as on July 3, 2009 as compared with 21.1 per cent a year ago (Table 27 and Chart 12). The strong growth in M3 mainly reflected the sustained expansion in aggregate deposits during the period. Within aggregate deposits, time deposits registered a higher growth (y-o-y) during 2009-10 as compared with a year ago, partly reflecting some switching from demand deposits and other savings instruments to time deposits. With increase in risk perception in the face of snowballing uncertainty, risk free high interest rates offered by the banks on time deposits in relation to expected return on other financial instruments would have motivated investors to shift their financial savings to time deposits.The expectations of near-term decline in interest rates as a lagged response to the lower policy rates also contributed to the compositional shift in deposits in favour of term-deposits. Accordingly, demand deposits recorded a lower growth (y-o-y) as compared with the previous year. Demand deposits expanded by 8.4 per cent (y-o-y) as on July 3, 2009 as compared with 17.3 per cent a year ago. The net outflows from small savings schemes that started in December 2007 continued up to March 2009 (the latest period for which the data are available) (Chart 13). Growth in currency with the public moderated to 13.7 per cent (y-o-y) as on July 3, 2009 as compared with 20.6 per cent a year ago, mainly reflecting down turn in economic activity.
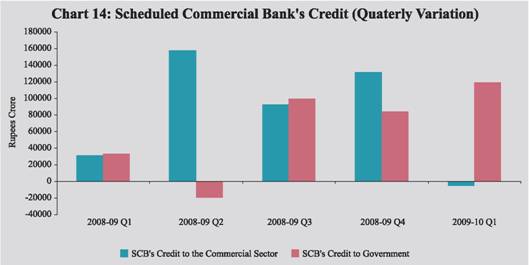
IV.4 On a financial year basis, growth in M3 during 2009-10 (up to July 3, 2009) was 4.7 per cent as compared with 3.4 per cent during the corresponding period of the previous year (Table 28). Currency with the public expanded by 2.6 per cent (up to July 3, 2009) as compared with 5.8 per cent during the corresponding period of the previous year. IV.5 On the sources side, broad money (M3) growth (y-o-y) was mainly driven by bank credit to the Government during 2009-10 (up to July 3, 2009). Growth in commercial banks’ credit to the commercial sector fell significantly (Chart 14). Net foreign exchange assets with the banking sector also declined. IV.6 Much of the financial year expansion in broad money (M3) during 2009-10 (up to July 3, 2009) resulted from the increase in bank credit to the Government from the commercial banks which also includes temporary acquisition of securities from the Reserve Bank under LAF.
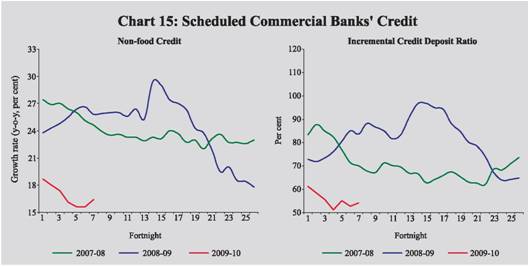
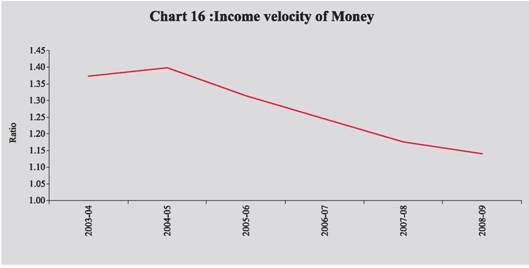
IV.7 Non-food credit growth (y-o-y) of scheduled commercial banks (SCBs) that reached its peak in October 2008, witnessed deceleration thereafter. This trend also continued in the first quarter of 2009-10. While it is not unusual for the first quarter to show deceleration in expansion of credit because of seasonal factors, the deceleration was particularly pronounced during the first quarter of 2009-10. This was because of the decline in credit by Rs.18,796 crore to petroleum and fertiliser companies during April-May 2009, as against an increase of Rs.6,530 crore in the corresponding period of the previous year. Since June 2009, some early signs of turnaround in the credit growth could be observed. Non-food credit by SCBs expanded by 16.4 per cent, y-o-y, as on July 3, 2009 as compared with 25.8 per cent a year ago. The lower expansion in credit relative to the expansion in deposits during 2009-10 resulted in a decrease in the incremental credit-deposit ratio (Chart 15). IV.8 Scheduled commercial Banks’ (SCBs’) investment in SLR securities as a per cent of their net demand and time liabilities (NDTL) increased during 2009-10 so far. SCBs’ investment in SLR securities expanded by 31.5 per cent (y-o-y) as on July 3, 2009 as compared with 19.5 per cent a year ago (Table 29). Commercial banks’ holdings of such securities as on July 3, 2009 was at 30.5 per cent of their NDTL as compared with 27.7 per cent a year ago. However, adjusted for LAF collateral securities on an outstanding basis, SCB’s holding of SLR securities was 26.9 per cent of their NDTL as on July 3, 2009. IV.9 The flow of credit from scheduled commercial banks witnessed sizeable moderation (y-o-y) during 2009-10 (up to July 3, 2009) as compared with a year ago. Within the commercial banks the expansion in credit declined sharply for private banks while foreign banks registered a negative growth (Table 30). IV.10 During 2003-04 to 2008-09, Indian economy experienced an average real GDP growth of 8.5 per cent, average WPI inflation of 5.8 per cent and average money supply growth of 17.9 per cent. Growth and inflation conditions, however, changed significantly during the course of 2008-09, and the broad money growth at 18.6 per cent at end-March 2009 in the face of moderating growth and near zero (year-on-year) inflation has to be seen in the context of significant fall in the velocity of circulation of money or increase in income elasticity of money demand (Chart 16).
IV.11 Disaggregated data on sectoral deployment of gross bank credit available up to May 22, 2009 showed that 47.4 per cent of incremental non-food credit (y-o-y) was absorbed by industry as compared with 43.2 per cent a year ago. The expansion of incremental non-food credit to industry during this period was led by infrastructure, iron & steel, engineering and construction industries. The agricultural sector absorbed 16.9 per cent of the incremental non-food bank credit as compared with 10.1 per cent a year ago. Personal loans that accounted for 7.6 per cent of the incremental non-food credit witnessed some moderation; within personal loans, housing loans decelerated to a large extent. Growth in loans to commercial real estate, however, remained high (Table 31). IV.12 Apart from banks, the commercial sector mobilised resources from a variety of other sources such as capital markets, commercial papers (CPs), non-banking financial companies (NBFCs), financial institutions, external commercial borrowings, American Depository Receipts (ADRs)/Global Depository Receipts (GDRs) and foreign direct investment. During 2008-09 flow of resources from domestic non-bank sources increased while flow of resources from external sources declined sharply as compared with the previous year. Among the domestic non-bank sources, resources raised through systemically important NBFCs, gross private placements by non-financial entities, total gross accommodation by four Reserve Bank-regulated AIFIs and gross investment by LIC increased, while resources raised by other sources declined. Within external sources, resources raised through external commercial borrowing, ADR/ GDR issues and short-term credit declined significantly, while investment through FDI routes registered an increase. Thus, besides the decline in the flow of non-food credit during 2008-09 as compared with 2007-08, the flow of resources from non-bank sources also declined substantially, resulting in lower annual flow of financial resources to the commercial sector (Table 32). During 2009-10 so far, latest available data indicate that flow of financial resources to the commercial sector was lower as compared with the corresponding period of the previous year.
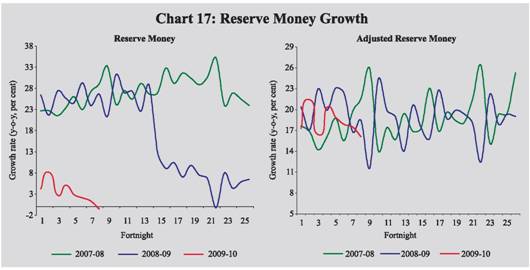
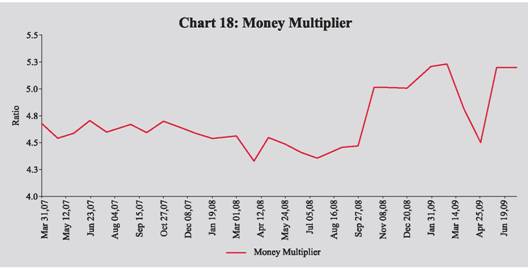
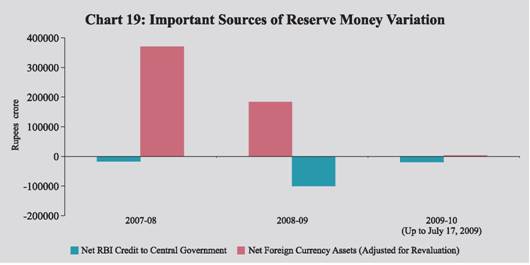
Reserve Money Survey IV.13 Reserve money registered a decline of 0.6 per cent, y-o-y, as on July 17, 2009 as compared with an increase of 26.6 per cent a year ago. In the context of sharp changes in CRR during 2008-09, it is more appropriate, for analytical purposes, to compare reserve money movements adjusted for CRR. The decline in reserve money should not be interpreted as an indication of monetary contraction, since it reflects the impact of a deliberate expansionary monetary policy action in the form of reduction in CRR. While a reduction in CRR may lead to a corresponding fall in reserve money in the first round, the higher money multiplier resulting from lower CRR leads to higher growth in broad money, though with a lag. The adjusted reserve money, thus, makes the trends over time more comparable, since they are adjusted for policy induced changes to the reserve money. Adjusted for the first round effect of the changes in CRR, reserve money growth (y-o-y) as on July 17, 2009 was 16.1 per cent as compared with 18.4 per cent a year ago (Chart 17). IV.14 The money multiplier, which had declined from 4.7 at end-March 2007 to 4.3 at end-March 2008 in the wake of CRR hikes, increased to 5.2 as on March 31, 2009, reflecting subsequent lowering of CRR by 400 basis points. The money multiplier, however, had declined to 4.5 as at end-April 2009 reflecting large excess cash holdings by banks. The money multiplier reverted to its trend by June 2009 (Chart 18). IV.15 On a financial year basis during 2009-10 (up to July 17, 2009) reserve money declined by 4.2 per cent as against an increase of 2.5 per cent in the corresponding period of the previous year (Table 33). On the sources side, net Reserve Bank credit to the Centre decreased while net foreign exchange assets (adjusted for valuation) increased marginally. Net Reserve Bank’s credit to the Centre decreased by Rs.19,780 crore (up to July 17, 2009) as against an increase of Rs.55,581 crore during the corresponding period of the previous year. The Reserve Bank’s foreign currency assets (adjusted for valuation) increased by Rs.3,977 crore as against a decrease of Rs.18,139 crore during the corresponding period of the previous year (Chart 19). Adjusted for the first round impact of the changes in CRR (up to July 17, 2009), reserve money declined by 4.1 per cent as compared with a declined of 1.7 per cent during the corresponding period of the previous year.
IV.16 Movements in the Reserve Bank’s net credit to the Central Government during 2009-10 (up to July 17, 2009) largely reflected the liquidity management operations of the Reserve Bank and changes in Central Government deposits with the Reserve Bank. Liquidity condition eased from mid-November 2008, and on an average, Reserve Bank started absorbing large amount of liquidity through reverse repo under the LAF. Accordingly, Reserve Bank’s holding of government securities (up to July 17, 2009) declined on account of an increase in absorption under LAF (Rs.1,39,175 crore). On the other hand, unwinding of MSS securities (Rs.66,101 crore) led to a decline in Central Government deposits with the Reserve Bank and, therefore increased net Reserve Bank credit to the Centre. The Centre’s surplus cash balances with the Reserve Bank also decreased (Rs.9,547 crore). Furthermore, net open market purchases under OMO/special market operations (SMO) led to higher holding of Central Government securities/bonds (Rs.43,658 crore) by the Reserve Bank. Reflecting combined effect of these developments, the Reserve Bank’s net credit to the Centre decreased during 2009-10 (up to July 17, 2009) as against an increase during the corresponding period of the previous year. IV.17 To sum up, broad money continued to exhibit high growth during 2009-10 (up to July 3, 2009), reflecting large market borrowing programme of the Government on the sources side and high growth in deposits on the component side of monetary aggregates. Sustained moderation in nonfood credit growth since October 2008 gave banks additional space to subscribe to the government securities; since end-May 2009, however, some early sign of turnaround in the credit growth could be observed. |
|||||||||||||||||||||||||||||||||||||||||||||||||||||||||||||||||||||||||||||||||||||||||||||||||||||||||||||||||||||||||||||||||||||||||||||||||||||||||||||||||||||||||||||||||||||||||||||||||||||||||||||||||||||||||||||||||||||||||||||||||||||||||||||||||||||||||||||||||||||||||||||||||||||||||||||||||||||||||||||||||||||||||||||||||||||||||||||||||||||||||||||||||||||||||||||||||||||||||||||||||||||||||||||||||||||||||||||||||||||||||||||||||||||||||||||||||||||||||||||||||||||||||||||||||||||||||||||||||||||||||||||||||||||||||||||||||||||||||||||||||||||||||||||||||||||||||||||||||||||||||||||||||||||||||||||||||||||||||||||||||||||||||||||||||||||||||||||||||||||||||||||||||||||||||||||||||||||||||||||||||||||||||||||||||||||||||||||||||||||||||||||||||||||||||||||||||||||||||||||||||||||||||||||||||||||||||||||||||||||||||||||||||||||||||||||||||||||||||||||||||||||||||||||||||||||||||||||||||||||||||||||||||||||||||||||||||||||||||||||||||||||||||||||||||||||||||||||||||||||||

இந்த பக்கத்தை பகிரவும்:


இந்திய ரிசர்வ் வங்கி மொபைல் செயலியை நிறுவுங்கள் மற்றும் சமீபத்திய செய்திகளுக்கான விரைவான அணுகலை பெறுங்கள்!


