 IST,
IST,
Monetary Policy: Confronting Supply-driven Inflation
Monetary policy’s response to supply shocks in pursuit of its goal of price stability has been brought into sharp focus by the ongoing global inflation crisis. Using crude oil price as an exemplar of supply shocks, simulations from the RBI’s Quarterly Projection Model (QPM) show that when the shock is transitory, inflation returns to equilibrium without the need for any monetary policy action. On the other hand, repeated supply shocks trigger second round effects through cost-push, expectations, exchange rate and demand channels, warranting pre-emptive monetary policy action. Credibility can reduce the monetary policy response; even so, by frontloading monetary policy actions, credibility is demonstrated by showing commitment to the inflation target. The required monetary policy response is lower when there is a fiscal policy response to supply-side shocks, but the latter entails macroeconomic costs, including potentially a slowing down of medium-term growth. Introduction The current inflation crisis is global. According to the World Bank, global median inflation is at its highest level since 2008. For advanced economies (AEs), it is at its highest level since 1982. Inflation is above target in the majority of AEs and emerging markets and developing economies (EMDEs) thathave adopted inflation targeting (World Bank, 2022)1. This inflation surge draws its origins from a series of supply shocks – pandemic lockdowns; supply chain disruptions; elevated commodity prices and the war in Ukraine – exacerbated more recently by firming demand and shifts from services to goods and back. Reflecting these pressures, the energy component of global consumer price inflation is at its highest level since early 1980s. For over 40 per cent of EMDEs and most low-income countries, consumer price index (CPI) food inflation is expected to remain in double digits through 2022 (World Bank, ibid). Consequently, the global inflation crisis is just the face of one of the most severe food and energy crises in recent history that now threatens the most vulnerable across the globe (Patra, 2022). Food shortages are adding to the pain of soaring prices and even among the rich nations, food security is endangered. In response, the most widespread monetary policy tightening is underway across the world. National actions are appearing synchronised because imported inflation pressures are being exacerbated by country specific shocks acting at the same time. As central banks aggressively frontload rate increases and liquidity withdrawals, apprehensions of eminentrecession are rising2 and loss of momentum is already being reflected in the recent purchasing managers indices (PMI) as well as in the pervasive risk aversion in financial markets. EMDEs are at the receiving end and their macroeconomic and financial conditions are worsened by currency depreciation, capital outflows and reserves losses. India has not been immune to this risk-off sentiment gripping global investors and financial markets, in addition to inflation having remained above target and at or outside the tolerance threshold for 6 months. Assessing the initial impact of the geo-political spillovers, GDP projections have been revised downwards by 60 basis points (bps) for 2022-23, while inflation projections have been raised by as much as 220 bps. The policy rate has been effectively raised by 130 bps and liquidity withdrawal is underway (RBI, 2022). In a world in which elevated inflation is globalised, it is the direction of the change that matters, not the height. In May 2022, India’s CPI inflation declined by as much as 80 bps. High frequency indicators suggest that the momentum of recovery is holding up. Against this backdrop, an animated debate has swung from regarding the Reserve Bank of India (RBI) as being behind the curve (Bakshi, 2022) or acted too little, too late (Subramanian and Felman, 2022) to the other end of the bi-polarity that it has acted for the wrong reasons (Sengupta, 2022), given the supply-side nature of inflation against which monetary policy is powerless (Aiyar, 2022). Using the RBI’s Quarterly Projection Model (QPM), our article addresses this debate with the help of counterfactual scenarios of adverse crude oil price shocks as a case study. Central to the exercise is the role of credibility and anchoring of inflation expectations. The results show that India’s flexible inflation targeting (FIT) framework, coordinated with supply-side policy actions, can redistribute the macroeconomic costs of shocks by taking into account the behaviour of firms in setting prices and of households in bargaining for wages. The rest of the article is divided into three sections. Section II sets out a brief discussion on the channels of transmission of crude oil price shocks. The challenges confronting monetary policy decision making in the face of adverse supply shocks are the focus of Section III. Conclusion and policy perspectives are given in Section IV. II. QPM: Channels of Fuel Price Transmission The QPM belongs to the genre of consensus macroeconomic New Keynesian open economy structural models. Drawing on this tradition, it consists of 1) an aggregate demand equation; 2) an expectations augmented Philips curve; 3) a monetary policy rule; and 4) an external block for the determination of exchange rates. A defining feature is the focus on nominal rigidities in price/wage settings and in mark-ups, providing monetary policy the exploitable trade-off to affect goal variables like output and inflation. Trend variables like potential output are assumed to be supply-driven and therefore exogenous to the model. Inflation is a result of deviations of aggregate demand from its underlying trend. In India, the prominence of food and fuel in the consumption basket amplifies the dominance of supply-side shocks in economic activity, with spillovers to the formation of inflation. Therefore, such country-specificcharacteristics3 are incorporated into the QPM, enabling gains in empirical regularity. We can now turn to the theme of the article by drilling down intothe ‘fuel’ block in the QPM4 and interlinkages with other blocks, since crude oil price impacts growth and inflation through multiple channels (Chart 1). The immediate impact of changes in crude oil price is on global variables - higher crude oil price increases other international commodity prices, feed into global inflation and weaken global demand and growth, the latter being also impacted by the monetary policy response in the form of a rise in global interest rates to head off the inflation surge. In the next stage, the disturbance to global macroeconomic conditions caused by the crude price rise feeds into domestic output and inflation. The direct impact on inflation occurs due to the pass-through to domestic petroleum product prices. Second round effects occur through cost-push – petroleum prices increase prices of intermediate goods and services which, in turn, push up prices of final goods and services. There is also a demand channel of transmission to domestic inflation at work – higher petroleum product (PoL) prices reduce the consumption of non-PoL items of households and profit margins of firms, leading to lower cash flows and investment. As a result, domestic aggregate demand moderates, causing inflation to ease.  On balance, the cost-push increase in inflation is much more painful than output losses. If the Indian basket of crude price increases by 10 per cent, inflation could increase by around 30 bps at its peak, with GDP growth weaker by 20 bps (Chart 2). Hence, monetary policy tightening is required to push inflation back to target. The monetary policy reaction widens the output gap, compresses demand and thereby brings down inflation. The fuel block in the QPM incorporates the dynamics of the impact of fuel taxes on petroleum products. Shocks to fuel taxes are long lasting, leading to changes in the tax structure that stay until the tax changes are exogenously reversed (Chart 3). In the context of recent actions to reduce excise duty on petroleum products in India, the dynamics of a fuel tax cut can be traced to a reduction in headline inflation through a) the direct effects on inflation due to reduction in domestic petroleum product prices; b) second round effects through a decline in intermediate costs and eventually prices of final goods; c) the demand channel – lower PoL prices increase the consumption of non-PoL items by households and profit margins of firms; and d) an increase in the fiscal deficit due to revenue losses, which leads to higher market borrowings, higher debt, higher country risk premium, exchange rate pressure and a pick-up in inflation. If fuel taxes are cut by 10 per cent, inflation could decline by around 15 bps, with GDP increasing by 20 bps. 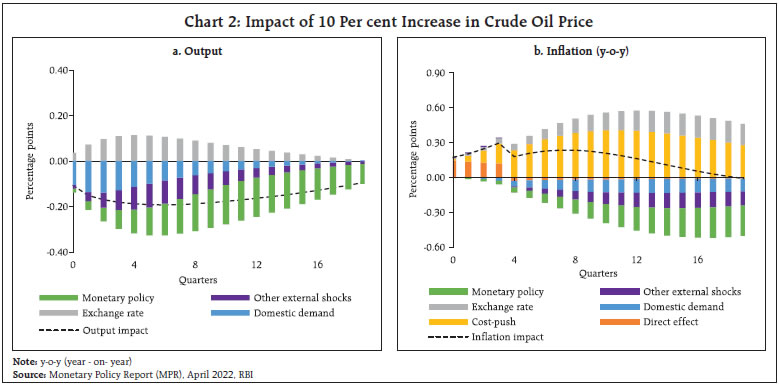 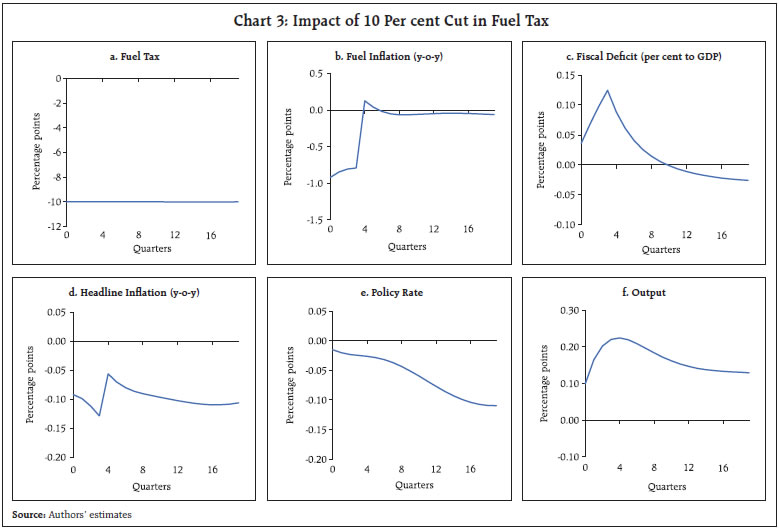 III. Case Study of Crude Oil Price Shocks When the economy faces supply shock/s,5 the monetary policy response is conditioned by a) the nature of the shock; b) aggregate demand conditions; c) monetary policy credibility; and d) the reaction of other agents in the economy to the shock. III. 1. Transitory Versus Repetitive Supply Shocks Macroeconomic policy responses to transitory6and repeated7 supply shocks may differ markedly for a 10 per cent increase in crude oil price (Chart 4). In both cases, the initial impact (direct impact) on headline inflation remains the same. In the case of a transitory or one-off shock, inflation returns to equilibrium without the need for any monetary policy action. On the other hand, repeated supply shocks presented as a persistent 10 per cent increase in crude oil price triggers second round effects through the various channels described earlier, resulting in ratcheting up of inflationary pressures. This warrants pre-emptive monetary policy action.  There are non-trivial costs associated with misjudging the nature of the shock (Chart 5). If monetary policy decides to look through the second round effects of repetitive increases in crude oil price, inflation expectations will become unanchored, leading to an upward drift in inflation away from its pre-shock level (Chart 5.i a-c). On the other hand, if monetary policy chooses to react to a transitory crude price shock by increasing the policy rate, it will impart volatility to output without any noticeable impact on inflation, which would have otherwise returned to the target (Chart 5.ii a-c). Thus, the key takeaway is that monetary policy can ignore the initial impact of an adverse supply shock as it lies outside its realm and remit, but it is essential for it to react to second round effects to avoid the generalisation of inflation. It is important to carry out an assessment of the life of the shock for an optimal monetary policy response. 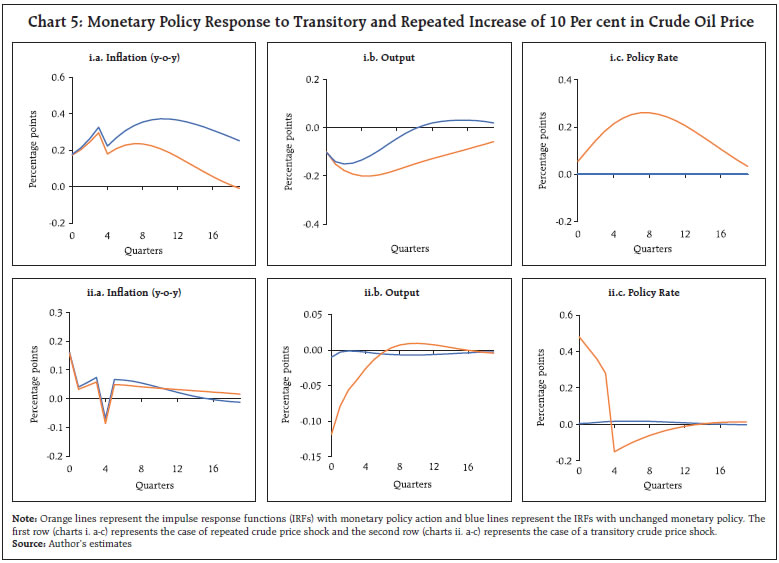 III.2. Supply Shocks and Aggregate Demand The monetary policy response to supply shocks is also conditioned by the state of aggregate demand conditions in the economy i.e. whether there is slack in the economy or excess demand. In the former, the Phillips curve will be flatter, while it will be steeper in the case of the latter. In the event of a 10 per cent adverse shockto crude oil price when the Phillips curve8 isflatter,9 the responsiveness of inflation to aggregate demand conditions will be lower, requiring sharper increases in the policy rate than otherwise to bring down inflation in the face of second round effects (Chart 6). This inflicts more slack on the economy. Onthe other hand, when the Phillips curve is steeper,10 inflation is more responsive to aggregate demand, warranting a smaller monetary policy response and hence a lower sacrifice of growth. When the economy is going through a contractionary phase, a supply shock can aggravate the dilemma for monetary policy, which can ill afford to weaken demand conditions further by responding to the inflationary impact of the supply shock. Hence, the conduct of monetary policy emphasises the role of inflation expectations. If agents in the economy believe in monetary policy’s steadfast commitment to inflation within a credible FIT framework, large policy rate increases can be avoided. This leads into the issue of the credibility of monetary policy.  III.3. Supply Shocks under Perfect and Imperfect Credibility With a 10 per cent shock to crude oil priceunder perfect credibility11, inflation expectations of all agents in the economy are fully aligned with the target. Hence, monetary policy need not react even to second round effects as firms will not pass on these inflationary impulses, preferring to absorb them in their profit margins because they believe that passing on the crude price shock to consumers will lead to higher interest rates in the economy that will adversely affect their cost of borrowing (Chart 7). 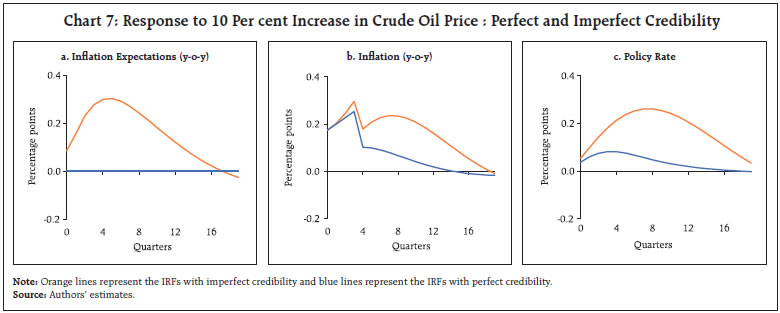 Even with perfect credibility, however, monetary policy cannot look through the second round effects of repeated supply shocks. The inflation target may be breached for a prolonged period and this could un-anchor expectations and eventually get reflected in higher inflation. On the other hand, if credibility is not perfect, inflation expectations will be adaptive. In the case of unfavourable supply shocks, inflation expectations will increase, leading to generalised inflation and hence a higher policy rate than otherwise will be required. Thus, higher credibility can reduce – not substitute for – the monetary policy response to second round effects of repeated supply shocks. Another dimension of monetary policy credibility is the timing of its response. With imperfect credibility, a delay in the monetary policy response to repeated unfavorable supply shocks leads to a further loss of credibility, unhinging of inflation expectations and eventually, higher inflation outcomes with a higher sacrifice of growth (Chart 8). On the other hand, by frontloading monetary policy actions, credibility in the commitment to the inflation target is enhanced. This will anchor inflation expectations, necessitating less aggressive policy increases and, therefore, a lower growth sacrifice.  III.4. Role of Fiscal Policy We assume two counterfactual scenarios under a 10 per cent increase in crude oil price viz., a) a fuel tax cut that keeps retail prices unchanged, but this results in a slippage relative to budgetary projections; and b) a fuel tax cut which is offset by a commensurate reduction in capital expenditure to prevent fiscal slippage (Chart 9). In the first scenario, there is a widening of the fiscal deficit due to revenue losses which has inflationary consequences. Furthermore, second order effects set in. The widening trade deficit due to higher outgo on imports leads to depreciation pressures on the exchange rate. The initial increase in the fiscal deficit also imposes additional pressure on the exchange rate due to higher country risk premium. Overall, although the peak impact on headline inflation could be substantially lower than in a scenario with no cut in fuel taxes, the combination of fiscal slippage and higher market borrowing by the government, exchange rate pressures and a higher country risk premium may produce large destabilising macroeconomic effects. 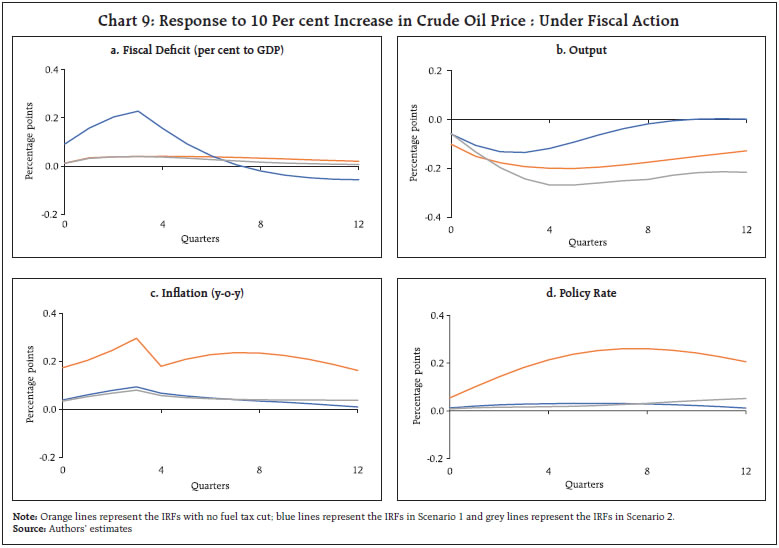 In the second scenario, taxes on petroleum products are reduced to absorb the full impact of the crude oil price increase (therefore, no increase in retail prices), but the primary deficit is kept unchanged by reducing capital expenditure equivalently. In this scenario, the peak impact on inflation is lower as the exchange rate depreciates by a relatively lower magnitude and the country risk premium is unaffected in the short run because of the unchanged primary deficit. The required interest rate tightening in this scenario is also lower. The decline in output is, however, much more in view of the lower capital expenditure, and more prolonged due to multiplier effects. The role of monetary policy in the context of inflation driven up by supply shocks is engaging attention in India as well as across the world. ‘Team transitory’ that would argue for monetary policy looking through supply shocks is losing out to ‘Team permanent’ which advocates fighting inflation with monetary policy irrespective of the sources of inflationary pressures. As we have argued in this article, the answer to this conundrum is conditional on several factors such as the nature of the shock, aggregate demand conditions prevailing in the economy, monetary policy credibility, and the role played by other agents in response to the supply shocks. We have attempted to model each of these factors in discrete scenarios. In real life policy making, however, these factors come into play together with differing intensity, often interacting with each other, and have to be considered simultaneously. In the wake of the pandemic and now the war in Ukraine, the Indian economy has faced repeated supply shocks. The flattening of the Phillips curve during the pandemic would have required a large and unaffordable growth sacrifice for disinflation. At the current juncture, however, supply shocks are larger and unrelenting, carrying the risk of unanchoring inflation expectations. They are also accompanied by a rebound in pandemic related revenge spending. With the gradual closing of the output gap underway, disinflation is less costly than before. Consequently, coordinated monetary and fiscal policy responses are set in motion on an ongoing basis. With limited policy space, frontloading of monetary policy actions can keep inflation expectations firmly anchored, re-align inflation with the target and reduce the medium-term growth sacrifice. References Aiyar, S. (2022, June 9). Will monetary tightening help fix India’s inflation problem? The Economic Times. https://economictimes.indiatimes.com/news/economy/policy/will-monetary-tightening-help-fix-indias-inflation-problem-swaminathan-aiyar-explains/articleshow/92099604.cms?from=mdr Bakshi, I. (2022, April 27). On inflation, RBI has been behind the curve. The Indian Express. https://indianexpress.com/article/opinion/columns/on-inflation-rbi-has-been-behind-the-curve-7888896/ Benes, J., Clinton, K., George, A. T., Gupta, P., John, J., Kamenik, O., Laxton, D., Mitra, P., Nadhanael, G. V., Portillo, R., Wang, H., & Zhang, F. (2016). Quarterly Projection Model for India: Key Elements and Properties. RBI Working Paper Series. /documents/87730/30842423/WPSN8EC0A00B61AC2462797F9C1DDCCBB5078.pdf Benes, J., Clinton, K., George, A. T., John, J., Kamenik, O., Laxton, D., Mitra, P., Nadhanael, G. V., Wang, H., & Zhang, F. (2016). Inflation- Forecast Targeting For India: An Outline of the Analytical Framework. RBI Working Paper Series. /documents/87730/30842423/WPSN709d22101a1f84445917d8487a62358ac.pdf Orphanides, A., Small, D. H., Wieland, V., & Wilcox, D. W. (1997). A Quantitative Exploration of the Opportunistic Approach to Disinflation. Board of Governors of the Federal Reserve System Finance and Econ. Disc. Series 97-36. https://doi.org/10.2139/ssrn.56155 Patra, M. D. (2022), Minutes of the Monetary Policy Committee Meeting, June 6 to 8, 2022. https://www.rbi.org.in/scripts/FS_PressRelease.aspx?prid=53904&fn=2752 Patra, M. D., Behera, H., & John, J. (2021). Is the Phillips Curve in India Dead, Inert and Stirring to Life or Alive and Well? RBI Bulletin. /en/web/rbi/-/publications/rbi-bulletin/is-the-phillips-curve-in-india-dead-inert-and-stirring-to-life-or-alive-and-well-20629 RBI (2022), Monetary Policy Statement. 2022-23. Various. /en/web/rbi/monetary-policy/other-links/monetary-policy-documents?category=14908751 Sengupta, R. (2022, May 31). It is unclear why RBI has hiked interest rates now. The Indian Express. https://indianexpress.com/article/opinion/columns/it-is-unclear-why-rbi-has-hiked-interest-rates-now-7907057/ Subramanian, A., & Felman, J. (2022, June 15). On inflation, how the RBI failed, why it matters. The Indian Express. https://indianexpress.com/article/opinion/columns/on-inflation-how-the-rbi-failed-why-it-matters-7969756/ World Bank. (2022). Global Economic Prospects, June. World Bank. https://openknowledge.worldbank.org/handle/10986/37224  II. Key Equations in QPM The QPM has 154 equations, of which 57 are behavioral equations. Only key equations are presented below. 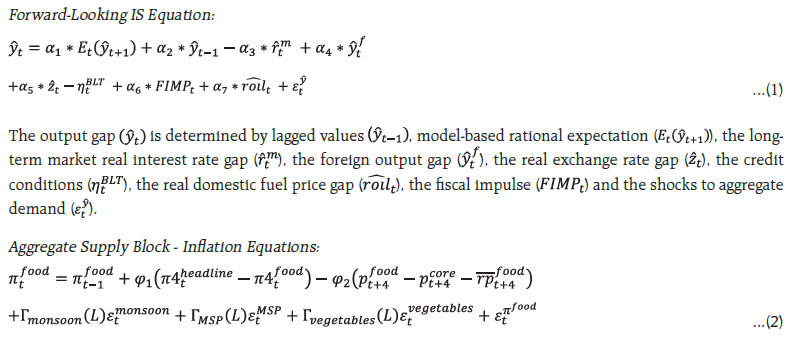  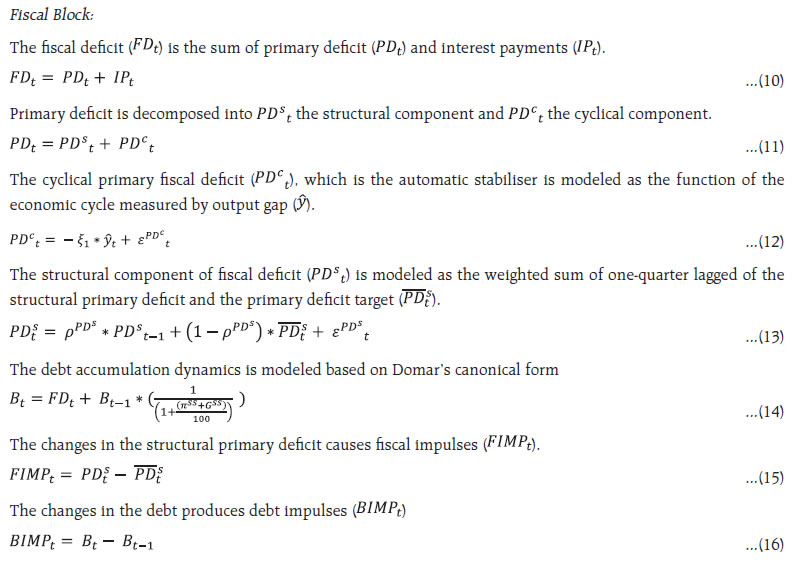 * This article is prepared by Joice John, Deepak Kumar and Michael Debabrata Patra of the Reserve Bank of India. The views expressed in this article are those of the authors and do not represent the views of the Reserve Bank of India. 1 Global Economic Prospects, June 2022. 2 In a survey of economists conducted by Wall Street Journal, the probability of recession in the United States in the next 12 months has risen to 44 per cent from 28 per cent in April and 18 per cent in January. 3 The QPM embeds many India-specific features like the behaviour of different inflation components and their interlinkages, sluggishness in monetary policy transmission, the predominance of the bank lending channel, endogenous credibility, monetary-fiscal linkages, fuel pricing, capital flow management and exchange rate dynamics. The schematic diagram representing interlinkages in the QPM and the key equations are presented in the Appendix. For a fuller overview, see Benes, Clinton, George, Gupta, et al. (2016). 4 The fuel block has market-driven and administered components of fuel. The market-driven component is determined by crude oil price, the exchange rate and fuel taxes. The administered component is modeled as an exogenously driven process. 5 If there are favorable supply shocks, monetary policy decision making is relaxed as inflation declines, growth gather momentum and monetary policy gains credibility or the “Opportunistic Approach to Disinflation” (Orphanides et al., 1997). The reverse holds in the event of an unfavourable shock. 6 Transitory shock means the crude oil price returns to the pre-shock level in next quarter. 7 Repeated shocks mean the crude oil price returns to the pre-shock level over 5 years. 8 When the Philips curve is flatter the elasticity of inflation to aggregate demand will be lower, implying that every unit of disinflation will require more reduction in demand than otherwise; and when it is steeper the elasticity will be higher, requiring less demand compression for every unit of reduction in inflation. For recent estimates of the Phillips curve in India, see Patra et al. (2021). 9 The output gap coefficient in the Phillips curve is calibrated to 0.05. 10 The output gap coefficient in the Phillips curve is calibrated to 0.30. 11 Credibility is defined on an index between 0 to 1. 1 means perfect credibility; for imperfect credibility, we assume the index is at 0.5. When credibility is perfect, inflation expectations are completely forward looking. (Benes, Clinton, George, John, et al., 2016) |
கடைசியாக புதுப்பிக்கப்பட்ட பக்கம்:


