 IST,
IST,


RBI WPS (DEPR): 06/2011: The Velocity Crowding-out Impact: Why high money growth is not always inflationary
RBI Working Paper Series No. 06 Abstract: In the mainstream monetary policy consensus that prevailed prior to the global crisis, there was increasing de-emphasis on money and credit aggregates in the conduct of monetary policy, because of the overwhelming faith on the interest rate, both as an instrument of policy and as an indicator of overall monetary and liquidity conditions. In the aftermath of the global crisis, however, there seems to be a renewed emphasis on money and credit trends, though how the money growth indicator could be used in the actual conduct of monetary policy remains largely unclear. The Reserve Bank, despite abandoning explicit monetary targeting in 1998, still continues to announce indicative money and credit growth trajectories and also monitors their trends in order to identify any lead information that may be relevant for policy. In the analysis of the information content embodied in money growth, recognizing the possible sources of instability in money demand and resultant changes in money velocity becomes critical. In the context of the severe “velocity crowding out of quantitative easing” that was experienced in the US in the midst of the global crisis, it is important to recognise that external developments, particularly the risk of contagion from a crisis, could at times add significant instability to domestic money demand. Shocks to money demand from both anticipated and unanticipated factors could make the velocity unstable, adding thereby noise to the analysis of the money growth variable. This paper studies the money velocity trends for India, and using the standard determinants of velocity from the literature, it aims at exploring the possibility of generating forward looking assessment of velocity, so that money growth trends could be better explained relative to other economic variables, particularly output and prices. Every projected money growth trajectory, ideally, is linked to conditional predictability of velocity, which though is not always feasible.But in the absence of a reference to velocity trends, money growth alone at times may be misleading, even in the short-run. As per the empirical findings of this paper, conventional determinants of velocity appear to be statistically significant for Indian data, but the estimated parameters alone may not be sufficient for undertaking a forward looking assessment of velocity, particularly during periods of major uncertainty that could cause velocity to deviate significantly from its medium-term trend. JEL Classification: E41, E51, E52, E58 Key words: Velocity of money, Money demand, Velocity crowding-out, Financial crisis, Cointegration. Introduction In the analysis of conventional money, output and prices relationship, the velocity of money is generally presumed to be stable, if not constant, particularly in the short-run. Shocks to velocity at times, however, could be significant in the short-run, as a result of which the money growth indicator may add significant noise to monetary analysis. During the recent global financial crisis and the subsequent Great Recession, for example, growth in both narrow and broad money in the US was significant, reflecting largely the impact of quantitative easing, but the velocity of money also fell sharply because of the financial crisis, leading to “velocity crowding-out of quantitative easing”. In India, broad money (M3) growth decelerated during 2009-10 and remained below the Reserve Bank’s indicative trajectory all through 2010-11. Since real GDP growth in both these years remained strong with high headline inflation, the conventional monetary arithmetic would have suggested a higher rate of growth in broad money (M3). Reference to the trends in velocity of money and analysis of its determinants, thus, could be important in such situations. Volatile movements in velocity in the short-run could either amplify or dampen the expected relationship between money on the one hand and output and prices on the other. Even though explicit monetary targeting has been abandoned by most of the major central banks around the world, some of them, including India, still use “money growth” variable as a second pillar/part of the multiple indicators approach to monetary policy. Smaghi (2011) emphasized the continued relevance of monetary and credit aggregates for monetary policy by stating that “…this crisis has certainly proved that the conventional wisdom of the last decade – that money does not matter, even for monetary policy – is wrong….The ECB consistently used these (monetary and credit) parameters even when they were derided as relics of a defunct monetary doctrine.” Because of unstable money demand functions, central bankers' consensus position as of now has been that “we did not abandon the monetary aggregates, they abandoned us”. Since mid-1970s, the performance of the money demand estimates has increasingly fallen short of policy requirements, primarily reflecting “…inaccurate forecasting ability and parameter instability – both of which remain largely unexplained today despite extensive research devoted to determining the reasons for this poor performance.” (Serletis, 2007) The increasing neglect of money because of the primacy attached to “interest rate” for explaining monetary policy, however, is fraught with the risk of being “…led to the erroneous belief that we could turn Milton Friedman on his head, and think that inflation is always and everywhere a real phenomenon”(King, 2003). Even Bernanke (2003) had underscored the point that “…The imperfect reliability of money growth as an indicator of monetary policy is unfortunate, because we don’t really have anything satisfactory to replace it”. Hetzel (2004) in fact had cautioned that “… because central banks do not use money as an indicator or target, an ‘out of sight out of mind’ confusion about the role of money in price level determination can arise.” The Reserve Bank, even after abandoning the monetary targeting and switching over to the LAF in 1998, has consistently announced indicative money growth projections. Without reference to trends in velocity and its determinants, particularly in the event of short-term shocks to velocity, however, communicating the trends in actual money growth as well as the indicative money growth trajectory could be a challenge. Because of the recent increase in volatility of money velocity (caused by the financial crisis and the subsequent swings in risk perceptions in the markets), reference to velocity has generally increased in analyses of trends in monetary aggregates of countries around the world. Against this background, this paper revisits the debate on the determinants of money velocity in the Indian context, with the aim of adding to the information content of the money growth variable that is commonly used in policy as well as market analyses. Section-II documents in brief the theoretical perspectives on money velocity and the relevance of the concept of velocity in monetary analysis. Trends in velocity of money, empirical assessment of the plausible determinants of velocity, and certain misconceptions about velocity are presented in Section-III. Empirical assessment of the determinants of velocity in India, and how the estimated parameters could be relevant to analyses of monetary aggregates have been covered in Section-IV. Concluding observations are set out in Section-V. Section-II: Theoretical Perspectives on why Velocity Matters in Monetary Analysis The quantity theory of money continues to be the most fundamental benchmark reference point for any monetarist analysis involving the causal relationship between monetary aggregates on the one hand and output and prices on the other. The theory, which is essentially an identity (i.e., MV=PT), has often been very simplistically interpreted to drive the message that “an increase in money supply causes proportional change in the price level”. In this identity, M represents the stock of money; V is the transaction velocity of money, i.e. the number of times money may change hands in facilitating multiple transactions; P stands for the price level, relevant to the transactions financed by money; and T covers all transactions in a money-economy where each transaction may involve money as a “medium of exchange”. PT is the value of all transactions undertaken with money (i.e. not only new goods and services, but also all old and second hand goods, inputs used in the production of new goods and services, and financial transactions in the financial markets that may not be directly related to the financing needs of the real economy). If V is time invariant or constant, and money is neutral in both long-run and short-run (i.e. no impact on output), then increase in money could lead to proportional increase in the price level. If money is non-neutral in the short-run (which is the mainstream belief that underpins the conduct of monetary policy), then increase in money supply could have dual effects, i.e. on output as well as inflation. If V is time variant, then a 10 per cent increase in money supply may coincide with equivalent drop in velocity; as a result, the increment in money growth may at times coexist with no change in PT. In the MV=PT identity, the distinction between “exogenous M” and “endogenous M”, and more particularly between “money supply” and“money demand” is important for meaningful analysis. The analysis of Fisher (1911) version of the identity would suggest that an “exogenous” increase in money supply would transmit to endogenous change in aggregate nominal demand, and in equilibrium, lead to proportional increase in prices through higher expenditure. Few analytical points are important to note here: (a) only in case of an initial equilibrium, the proportional relationship between money supply and prices may hold; (b) the chain of causation is direct from increase in money supply to increase in nominal value of aggregate expenditure, unlike the Keynesian or neo-classical versions where increase in money supply operates through a lower interest rate to cause an increase in nominal expenditure (most of the econometric models continue to rely on this indirect transmission, though monetarist models still emphasize the direct channel); and most importantly, (c) V is not a constant, but independent of both money supply and price level changes. As an economic variable, it may be non-constant both in the short-run and the long-run. Its variability could be conditioned by variations in other macroeconomic variables. While using Y (output / real income) as a proxy of T in policy analysis, it is often ignored that even Fisher (1911) had made a distinction between transactions related to income (Y) and those related to financial transactions (F). This suggests that the theoretical identity should be presented as: MV = PyY + PfF Where, Py and Pf are prices of goods and services (covered in GDP) and financial transactions, respectively. It may not be correct to presume that financial transactions are undertaken only in pursuit of real output. The global financial crisis revealed that financial transactions could be much larger than what may be necessary for meeting the needs of the real sector, and hence the PfF part in the identity is necessary. However, when Y is used as a proxy for T, instead of “transaction velocity of money”, “income velocity of money” becomes more appropriate as a concept. Besides meeting the transaction related demand, money may be demanded for its store of value function as well. The Cambridge approach (of Marshall, Pigou and Keynes) to study the relationship between money, output and prices, introduced the “money demand” dimension (as opposed to the supply side emphasis in the quantity theory) and emphasized that besides demand associated with transactions (T), money may be demanded as a “store of value” for its convenience and security, which in turn may change depending on the trends in “interest rates”. In this case, the identity could then be represented as: 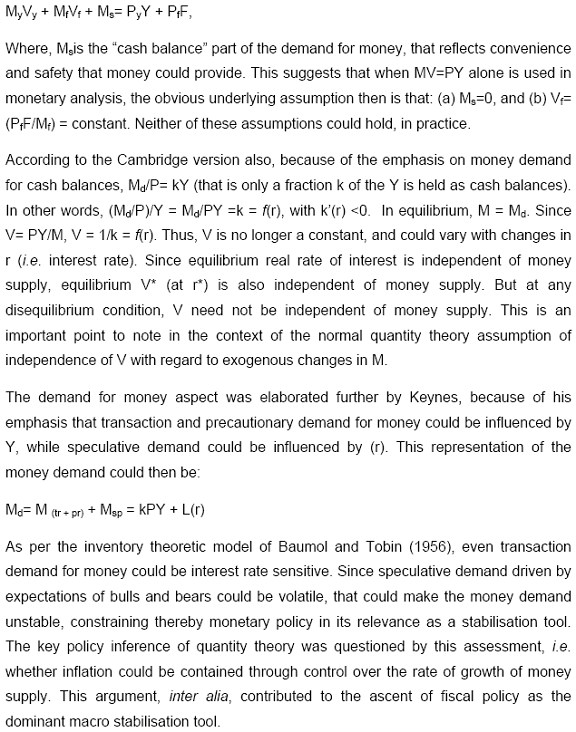 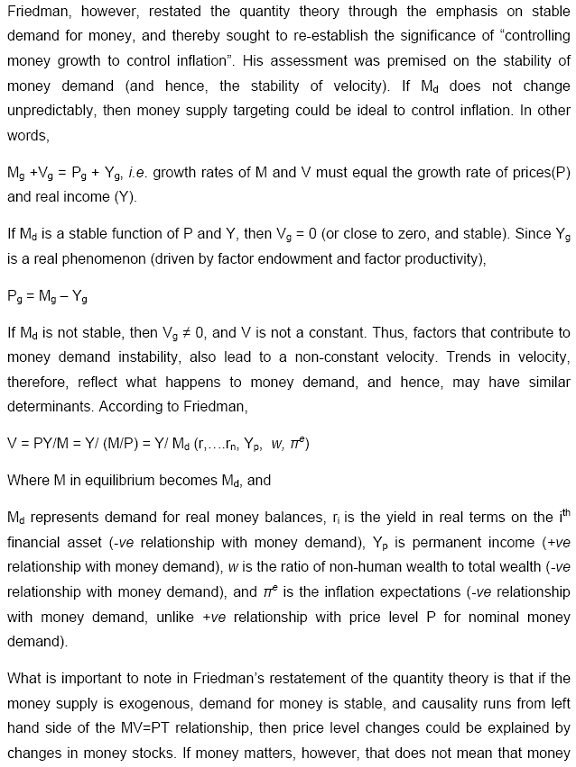 can be managed prudently by the authorities to contain inflation. Due to the mistaken belief among policy makers that there existed an exploitable tradeoff between inflation and employment (i.e. the Phillips Curve relationship), and the tendency to overexploit the relationship, there is always the risk of discretionary monetary management leading to a higher inflation regime coexisting with lower employment and growth. Possible scope for non-neutrality of money, at least in the short-run, does not imply that policy makers can use it to the advantage of the economy through discretionary policies.The preferred option, therefore, could be a rule based money growth framework (i.e., the constant rate of money growth). Accordingly, Friedman (1968) highlighted in his Presidential Address to the American Economic Association that: The best course of action is to rely on the equilibrating forces of the market, imperfect as they may be, and on the stability of money demand, imperfect as it too may be, rather than seek a better approximation to perfection through “fine-tuning” policy. General abandonment of monetary targeting in practice later, though, stemmed from: (a)empirically observed unstable money, output and prices relationships, (b) Goodhart’s law (i.e. whenever past regularity in statistical relationships is used for policy control purposes, the regularity would collapse), and (c) the endogenous money supply process. Because of the latter, monetary policy independence, in the contemporary world, is seen only in terms of ability to set domestic policy rates independently. Market determined interest rates, though, may still not respond to policy rate changes, depending on a host of factors such as the fiscal stance, capital flows, financial innovations (including non-banking sources of funding), financial regulations, credit market rigidities, etc, which could constrain effective transmission. Thus, abandonment of monetary targeting had justifications, but interest rate based conduct of policies also has limitations. These limitations may be particularly severe in dealing with a financial crisis (i.e. zero interest rate bound, requiring quantitative easing), asset price inflation (involving use of excessive leverage in an environment of ample liquidity conditions and neglect of money and credit aggregates) and persistent supply side shocks to inflation (with food and commodity price inflation in particular exhibiting little sensitivity to policy interest rate changes). The return of the focus on quantity of money after the global crisis, or at least the realization of the costs of benign neglect of money and credit aggregates suggests that money demand analysis would regain some of its importance in central banks, even if only in the form of a second pillar or as a part of the multiple lead indicators for conduct of monetary policy. In such an environment, having a realistic assessment of the near term outlook for money velocity could help in not only setting the indicative money growth trajectories, but also in explaining money growth trends in central bank communications. Section-III: Determinants of Velocity - How to Interpret Trends in Velocity? Theoretical and empirical literature suggests that there could be multiple determinants of velocity, such as the level of economic development, financial innovations and financial deepening, interest rate changes effected by a central bank, inflation and inflation expectations, employment uncertainty, household sector’s net worth and leverage, and market optimism/pessimism. Expectations driven by the outlook for the economy and market trends significantly condition velocity and this determinant has been a major source of volatility in money velocity in the recent period, particularly since the global crisis. Financial innovations could influence velocity by both reducing the transaction costs and enhancing the liquidity of financial assets (and hence liquidity of financial wealth). For example, securitization makes bank credit tradable and liquid, and market financing of economic activities also competes with bank credit. Greater use of ATM/credit/debit cards allows flexibility to economize on non-interest bearing cash, and unused credit limits in credit cards are akin to substitute of cash. Many of the new payment modes for electricity, gas and dividends, such as direct credit and direct debit also economize on the use of cash, but depending on the frequency of payments there could be shocks to money velocity. Most important shocks to velocity from financial innovations could be the sudden change in the interactions between “funding liquidity” and “market liquidity”. In an advanced financial system, the volume of financial transactions could be large and as long as the markets remain liquid, the pressure on funding liquidity could be modest. But when the markets turn illiquid (as happened in the case of CDOs/ABSs in the case of the sub-prime financial crisis), the demand for funding liquidity may exhibit a sudden spurt, which in turn would raise the demand for liquidity support from the lender of the last resort, i.e. the central bank. Periods of financial crisis or stress in financial systems, thus, could add significant volatility to money velocity. The following points have generally been highlighted in most of the recent writings on money velocity:
Velocity crowding-out of the impact of QE in the US – Massive liquidity injection and resultant expansion in base/broad money may coexist with no corresponding increase in nominal GDP (i.e. PY), if velocity falls sharply. In the US, large increases in both M1 and M2 have been offset nearly “one for one” by the decline in velocity - leading to velocity crowding-out - rather than increase in nominal GDP (i.e.PT). As could be seen from Panel Chart-1, M1has expanded by as much as US$ 0.4 trillion since December 2007, whereas M2 has increased only by about US$ 1.2 trillion (as against increase in base money of as high as US$ 1.5 trillion). More importantly, while M1 has increased by about 30 per cent since December 2007, the M1 velocity has dropped by 2 (from 10 to 8) suggesting a large enough (almost 200 per cent) contractionary impact, more than offsetting the expected positive impact of M1 expansion on nominal GDP. M2 in turn has increased by about 20 per cent since December 2007, and the fall in velocity from 1.9 to 1.7 (or by 0.2, equivalent of 20 per cent fall in money) implies almost “one-for-one” offset for the expected impact of expansion in M2 on nominal GDP. The fall in velocity has both conventional and non-conventional dimensions. Conventionally, in the midst of a crisis, money injected by a central bank may not get distributed efficiently through the banking system to non-banks. That may imply fall in velocity, as well as lower growth in M2. If the crisis does not involve a bank run by depositors, then demand for safer form of money (i.e. currency and demand deposits) may increase, as a result of which M1 may show strong growth. In the US, with interest rate falling to near zero, the opportunity cost of money also became negligible, which partly explains higher demand for narrow money. Sharper fall in velocity of M1 is because of reluctance among banks as well as the public to part with liquidity. The non-conventional dimension of the collapse in velocity is the sudden and significant unwinding of financial innovations. In the MV=PT assessment, T should include financial transactions as well, but in practice output (Y) is used as a proxy for transactions in monetary analysis. In a liquid market, growth in financial innovations could imply large decline in velocity. Given the manner in which the velocity is derived (i.e. nominal GDP/money stock), the impact of growth in financial innovations and subsequent collapse is difficult to explain through trends in “measured” velocity. According to Fisher, during the Great Depression both money supply and velocity had declined (which precipitated the recession). Between October 1929 and March 1932 while the money stock had declined by 13 per cent, the velocity had also fallen by 72 per cent. During the recent Great Recession, however, the Fed prevented monetary contraction, but velocity declined. A central bank can only print more money, but it cannot arrest falling velocity driven by collapsing confidence of the public about the financial system. This highlights why money velocity is so important to the analysis of monetary aggregates or quantity based monetary policy actions. Some common misconceptions about velocity of money Since velocity is important to monetary analysis, it is important to avoid some of the common misconceptions about velocity. First, velocity is not a substitute of money; i.e. it cannot be a determinant of nominal income or inflation. This is because velocity is never the “cause” but always the “effect”, depending on how the financing of transactions and associated demand for money may change. The causality, thus, can only be from transactions to velocity, not the other way round. In the case of money, however, causality could be bi-directional; excess money supply can raise nominal income and prices, assuming the money supply process to be exogenous. Similarly higher demand for money resulting from higher nominal growth in GDP could cause money supply to increase, making the money supply process endogenous. In the latter case, however, if velocity increases, then money growth may not match the increase in nominal income. Thus, velocity is important to explain the behaviour of money growth, but it is not a substitute of money. Velocity is always passive, and it does not cause anything. Second, velocity is not the same thing as money multiplier. Money multiplier explains the process through which the “base money” created by a central bank multiplies in the banking system to the stock of broadmoney (M3) at any point of time. Currency to deposit ratio (which depends on the behaviour of the public), required reserves to total deposits (which depends on the central bank policy) and excess reserves maintained by banks with the central bank as percentage of total deposit liabilities (which depends on the behaviour of commercial banks) are the key determinants of money multiplier. The money multiplier is the link between “broad money” and “reserve money”, whereas velocity is the link between “broad money” and “nominal GDP”. While money multiplier could be derived as “broad money/reserve money”, velocity is derived as “nominal GDP/broad money”. Velocity refers to the number of times the available money stock may roll over or change hands to finance transactions equivalent of nominal GDP, whereas money multiplier is the magnitude by which base money is amplified in the banking system to the stock of broad money. Third, a very common perception has been that money growth alone is the culprit, and hence must be always contained, consistent with a money growth policy rule. This approach could be particularly dangerous in an environment of sharp fall in velocity. Unless the falling velocity is countered by corresponding large expansion in money, recession could deepen, as happened during the Great Depression of 1930s. In the US for example, broad money growth was generally moderating prior to the recent global crisis, primarily because the velocity was rising faster than normal. Financial innovations, such as securitization, CDOs, CDS, etc. contributed to the above trend increase in velocity relative to the normal increase in velocity that one would have expected as a result of normal financial deepening of the economy. The financial crisis, however, involved intense deleveraging and collapse of the super debt cycle. The unwinding of financial innovations and the credit freeze involved sudden sharp fall in velocity. This necessitated a high dose of quantitative easing, without any fear of stoking inflation. Thus, in certain circumstances, large increase in money need not lead to loss of purchasing power of money or inflation. Money injected, only when spent or rolled over frequently, can become inflationary. Persistently falling money velocity in India and the recent volatility An assessment of money velocity in relation to trends in nominal GDP (i.e., PY) as presented in panel chart-2 suggests the following:
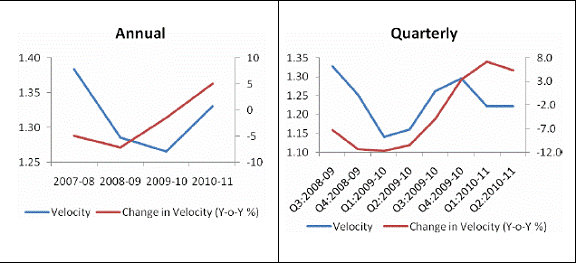
Thus, the subdued growth in M3 in 2010-11 could be explained through the increase in money velocity, which resulted from the return of confidence in the financial system and the economy, consolidation of recovery after a slowdown, and return to normal trend from the fast paced fall in the velocity that was witnessed in the previous two years (Chart-3). Chart-3: Money Velocity Trends since the Global Crisis
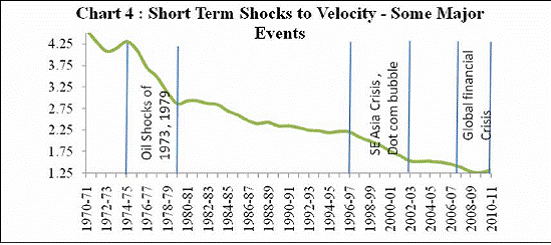
By how much the velocity might improve during the course of the year could have been difficult to predict at the beginning of the year, since it is often used as a derived variable once the other variables (i.e. M, P and T) in the identity are known. But forward looking assessment of velocity, taking into account its normal long-term trend and short run shocks, could be important for: (a) setting an indicative money growth trajectory, and (b) communicating such a path as part of policy. One needs to note the fact that the growth in the “parallel economy” is not captured in the data on ‘PT’, which may depress the derived velocity. In other words, transactions in the black economy also involve corresponding demand for money, but since such transactions would not be reflected in the nominal GDP figure, the derived velocity may be lower. If the size of the black economy is large and growing, then explaining the velocity by studying only its conventional determinants may not be useful for policy. Section IV: Empirical Assessment of Determinants of Velocity in India The volatile deviations in velocity around the long term trend (as depicted in Chart A and E for annual data) suggest the need to identify both structural as well as transitory determinants of velocity. GDP and a financial deepening indicator (proxied, say by credit to GDP ratio) could be seen as the structural determinants of velocity, while interest rate changes could be viewed as the major short-term determinant. If money demand is not very sensitive to policy interest rate changes, then the sensitivity of velocity will also be modest. The most transitory determinant of velocity could be uncertainties in the economy or the financial system, both global and domestic, which may affect the behaviour of not only households and corporates but also money creating banks. At times the confidence channel of contagion could be more significant than the trade or capital flows channel, and that could significantly alter the velocity in the short-run. As could be seen from Chart-4, significant short-term shifts in the overall falling trend in velocity have happened around periods of major global/domestic shocks. For empirical estimation, a dummy variable that relates to the events mapped out in Chart-4 has been used. While GDP (the main driver of transaction demand for money) has been taken in log form, velocity, interest rate, credit to GDP ratio (as a proxy for financial deepening), are taken without any transformation. WPI in levels has been included in log form as a proxy for inflation expectations. Variable selection: Velocity is obtained as a ratio of nominal income i.e., GDP at market prices (current prices) to broad money M3, GDP refers to real income i.e., GDP at factor cost (constant prices with base year 2004-05), interest rate proxy for annual data is the SBI lending rate and for the short run it is 91 day Treasury Bill rate, and credit ratio here refers to Bank credit to GDP ratio. The empirical relationship between velocity and its determinants was studied both for the annual data (over the period 1971-2009) and quarterly data (1996 to 2010, i.e. the period for which quarterly GDP data are available). The quarterly estimates are particularly emphasised in the paper because those could be more relevant in the current context. Tests of stationarity suggests all variables to be I(1), as presented in Table-A. Many of the economic variables in level form may be non-stationary or I(0), and in such cases the general presumption is that those could be either trend stationary or difference stationary. Nelson and Plosser (1982) showed why most economic time series data could be better characterized as difference stationary, and the same approach has been followed here. All series have been tested for presence of unit root even after allowing for a structural break, if any, using the Zivot Andrews Test. Annual velocity series shows a significant structural break; accounted for this break the series becomes stationary. Following the years of oil crisis, velocity fell steeply until the early 1980s and thereafter entered a phase of gradual decline up until the late 1990s. Quarterly WPI series also shows a structural break and likewise is I(0) after accounting for the break. The hypothesis of presence of any long-run relationship between these variables is tested through Johansen and Juselius (1992) co-integration approach. The trace and maximum eigenvalue tests suggest the presence of 1cointegrating vector for both annual data and quarterly data (Table-B). Based on expected theoretical relationship that could be relevant for meaningful economic analysis, the following long-term relationship became evident for the annual and quarterly data, respectively. Annual Data:
Quarterly Data:
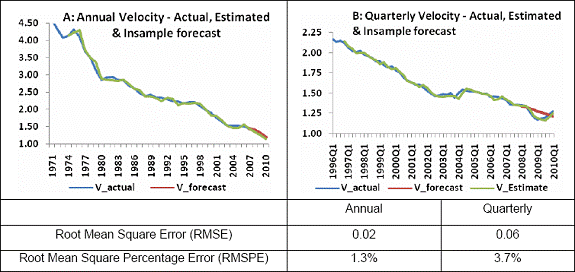
The annual estimates indicate that the signs of the relationships with regard to two major determinants of velocity (i.e. output-Y and interest rate-R) are as per expectations, even though the interest rate coefficient is statistically insignificant. This corroborates the possibility of weak interest rate sensitivity of money demand, which would have improved though for the sample period relating to the more recent period. That is seen in the quarterly estimates where the interest rate coefficient is statistically significant. More importantly, the financial deepening indicator (i.e. currency to GDP ratio- CY) also clearly emerges as a statistically important determinant of velocity. The proxy used for inflationary expectations also turns out to be significant with a positive sign indicating that anticipated higher inflation could cause a higher velocity. The dummy variable (that captures the impact of short-run disturbances on velocity) appears statistically significant in both annual and quarterly estimates, but the signs are opposite. While the estimates signify the role of short term shocks as a separate determinant of velocity, opposite signs pose a challenge for meaningful policy inference. Recognizing this, two alternative in-sample forecasts are presented (Chart 5 - a & b). Compared to the quarterly (seasonally adjusted) estimates, annual forecasts suggest better in-sample performance of forecasts, even though forecast performance in practice would need to be validated over time. The empirical findings, thus, highlight two things: (a) an assessment of determinants of velocity could help in explaining the money velocity, and hence deviations of actual money growth from expected path that could be seen as consistent with normal money, output and prices relationship, and (b) the parameter estimates may not be very useful in predicting the velocity, particularly in a period of economic instability. Chart 5: Performance of Velocity Forecasts
Section V: Concluding Observations Persistent and accelerated decline in the value of money cannot materialize unless accompanied by corresponding large expansion in the stock of money. This is a fundamental macroeconomic principle, notwithstanding the animated debate on alternative monetary policy frameworks and suitability of any one of them for any specific country. In the pre-global crisis period, the de-emphasis on monetary and credit aggregates was primarily driven by dissatisfaction with monetary targeting. In the post-crisis period, there seems to be a return of the emphasis on money and credit aggregates, but largely due to the realisation about the role of leverage in causing a financial crisis or sustained easy money conditions fuelling asset price bubbles, rather than money replacing the interest rate instrument for attaining monetary policy goals relating to inflation or output. Money growth remains a key medium-term determinant of inflation, but deviations from trend growth in money in the short-run must not be resisted, since such deviations may be justified by short-term shocks to money demand, and hence to money velocity. What becomes important for a central bank then is to explain the monetary trends in its communications, particularly deviations from the normal trend, through analysis of short-run shocks to money velocity. As shown in this paper, the money velocity has exhibited a sustained declining trend over last six decades, and this pattern cannot be seen as a source of uncertainty in the assessment of money, output and prices relationship. The major uncertainty though has been the short-term shocks to velocity, which seem to be particularly significant during periods of crises (such as the South East Asian crisis, the bursting of the IT bubble or the global financial crisis), episodes of oil/commodity price spirals, or even the domestic balance of payments crisis in the early 1990s and periods of sharp swings in domestic asset prices. As shown in the paper, the pace of decline in velocity accelerated for India during 2008-09. The more than normal pace of decline in velocity reflected the post-crisis concerns in the financial system, including the impact of the confidence channel of contagion. In 2010-11, however, the return to the normal trend implied an increase in incremental velocity, which in turn explains why the money growth remained subdued during the year. Even though the more obvious factor highlighted in explaining the subdued growth in M3 has been the moderation in the growth of deposits (which account for about 85 per cent of M3), the increase in velocity explains why a lower rate of money growth could coexist with a high growth in nominal GDP in 2010-11 that resulted from both robust growth and high inflation. This paper highlights that velocity crowding-out effects at times could be large in the short-run, and more importantly, significant enough to distort the information content of money growth for macroeconomic analysis. In India, as in other EMEs, the income velocity of money has exhibited a declining trend over last six decades, which reflects the dominant impact of growing monetisation of the economy. Financial inclusion initiatives and the associated further monetisation could sustain the declining trend going forward, even though further deepening of financial markets and financial sector reforms could weaken the pace of moderation in velocity. This forward looking assessment could be relevant for setting the indicative money growth trajectory every year and also for explaining the trends in monetary aggregates relative to trends in other macroeconomic variables, in particular output and prices. It is also important to monitor possible sources of short–run shocks to money demand, and hence sudden shifts in the pattern of velocity. Empirical estimates of this paper suggest that GDP, interest rate and financial deepening are the major determinants of velocity, but the dummy variable representing short-term shocks is also statistically significant. As a result, at times, lower growth in M3 relative to normal trend consistent with output and price trends need not necessarily imply tightening of monetary conditions. Similarly, higher growth in M3, at times, relative to normal may not have to be seen as a risk to inflation. Short-run trends in money growth should be seen along with expected changes in velocity. In the medium-run, however, velocity could be expected to remain anchored to the long-run trend, and hence, money growth in the medium-term is more likely to be consistent with the inflation and output trends than in the short-run. @ Sitikantha Pattanaik is Director and Subhadhra S is Research Officer in the Department of Economic and Policy Research. They are grateful to Arghya Mitra, Snehal Herwadekar and Abhilasha for useful comments. Views presented in the paper are personal. The authors can be reached at spattanaik@rbi.org.in and subhadhras@rbi.org.in . 2 Framakis and Bilke (2011) noted that UK and the Euro-area exhibited downtrend in velocity, unlike the rising long-term trend in velocity in the US, which reflect the difference in the structure of their financial systems; i.e. while in the US capital market dominates retail banking (implying expected role of financial innovations in yielding a rising velocity), in the UK and Euro-area retail banking is still popular. Their assessment suggests that after the short-term crisis induced shocks to velocity in these countries, respective velocities will return to their normal long-term trends by the end of 2011. 3 While the relationship between M and PT (or PY) is established, there are differences of opinion on segregating the relationship with respect to P and T (or Y), depending on whether money is viewed as neutral only in the long run or it is neutral even in the short-run. 4 Contagion effect from external economies is not explicitly modeled. Hassan and Wilbratte (2008) viewed that velocity of broad money could be an important variable in the assessment of international transmission of shocks. Data availability on variables relating to financial sophistication, wealth, etc. is a constraint to empirical research on velocity. Based on the available relevant data, this study used a VECM model.References: Bordo, Michael D., and Lars Jonung, “The Long-Run Behavior of the Velocity of Circulation: The International Evidence”, Cambridge: CambridgeUniversity Press, 1987. Brunner, Karl and Allan H. Meltzer (1962), “Predicting Velocity: Implications for Theory and Policy”, Paper presented at the joint meeting of the American Finance Association and the Econometric Society in Pittsburgh, December 29. DeLong, J Bradford (2009), “Simple Keynesianism for Monetarists: A Primer”, University of California at Berkeley and NBER. El-Shagi, Makram and Sebastian Giesen (2010), “Money and Inflation: The Role of Persistent Velocity Movements”, March 04, Halle Institute for Economic Research. Farmakis, Lefteris and Laurent Bilke (2011), “Modelling Money Velocity: A Cross Country Analysis”, Nomura –Macro Insights, February 22. Friedman, M (1956), “The Quantity Theory of Money: A Restatement”, In Studies in the Quantity Theory of Money (Ed.) Chicago; University of Chicago Press. Friedman, M (1968), “The Role of Monetary Policy”, Presidential Address, American Economic Association. Fisher, I (1911), “The Purchasing Power of Money”, London, Macmillan. Hetzel, Robert L (2004), “How Do Central Banks Control Inflation?”, Federal Reserve Bank of Richmond Economic Quarterly, Vol. 90/3. Humphrey, Thomas M. (1993), “The Origins of Velocity Functions”, Federal Reserve Bank of Richmond Economic Quarterly, Volume 79/4 Fall. Jadhav, Narendra (1994), “Velocity of Money”, in “Monetary Economics for India”, Macmillan India Ltd. King, Mervin (2003), “No Money, No Inflation – The Role of Money in the Economy”, In Central Banking, Monetary Theory and Practice, Ed. by Mizen, Paul Cheltenham, Edward Elgar. Morgan, Marry S. (2006), “Measuring Instruments in Economics and the Velocity of Money”, Working paper No. 13/06, Department of Economic History, London School of Economics. Nelson, C R and C I Plosser (1982), “Trends and Random Walks in Macroeconomic Time Series”, Journal of Monetary Economics, 27. Smaghi, Bini (2011), “Lessons for Monetary Policy from the Recent Crisis”, Speech at the roundtable, organized by University of Chicago Alumni Club, January 19. Serletis, Apostolos (2007), “The Demand for Money: Theoretical and Empirical Approaches”, Springer, 2nd Edition. Shirvani, Hassan, and Barry Wilbratte, “The Long and Short Run Determinants of the Velocity of Broad Money: Some International Evidence”, Southwestern Economic Review, Volume 35(1), Spring 2008. Siklos, Pierre L (1993), “Income Velocity and Institutional Change: Some New Time Series Evidence, 1870-1986.” Journal of Money, Credit and Banking, August. Appendix Table 1- Variance Decomposition4
| ||||||||||||||||||||||||||||||||||||||||||||||||||||||||||||||||||||||||||||||||||||||||||||||||||||||||||||||||||||||||||||||||||||||||||||||||||||||||||||||||||||||||||||||||||||||||||

இந்த பக்கத்தை பகிரவும்:


இந்திய ரிசர்வ் வங்கி மொபைல் செயலியை நிறுவுங்கள் மற்றும் சமீபத்திய செய்திகளுக்கான விரைவான அணுகலை பெறுங்கள்!
எங்கள் செயலியை நிறுவ QR குறியீட்டை ஸ்கேன் செய்யவும்


கடைசியாக புதுப்பிக்கப்பட்ட பக்கம்:


