 IST,
IST,
Chapter III : Financial Markets
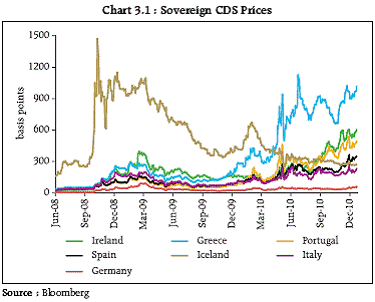
Prolonged period of financial system fragility, weak economic growth outlook and worsening fiscal strains in advanced economies have together created a climate that is not congenial for financial stability. The current policy support, both implicit and explicit, has not helped in addressing such risks. Funding risks could crystallise with a spill over into India, especially in view of the growing significance of the finance channel. The current two-track recovery in global economy coupled with divergent monetary policy actions has propelled capital flows to EMEs. Risk of asset bubbles in Indian financial markets is a possibility if the current rate of flows is sustained. Moreover, complacency can arise out of strong economic recovery, international investor confidence in the form of FII flows and current level of business and consumer confidence. Hence, the situation warrants watchful monitoring as they embody potential for build-up of risks. 3.1 The most notable development since the previous FSR in March 2010 has been the disturbances in global financial markets caused by concerns over the sustainability of the fiscal position in several European countries. The stress felt in the sovereign bond markets spread quickly to bank funding markets in May 2010 resulting in broader risk aversion among investors. The domestic financial markets were orderly apart from a liquidity constraint due to some structural and seasonal factors. The global financial markets 3.2 Some strains have redeveloped over concerns about liquidity and solvency of Ireland’s large banking system and, as a result, its sovereign debt. The Ireland shock has led to a larger question about the future of the monetary union. In earlier years, before the introduction of the Euro, the adjustment process could have been facilitated in part by exchange rate depreciation that reflected the country’s risk. 3.3 In contrast, Iceland which had similar problems to Ireland in the form of an oversized banking sector, but with an independent currency, defaulted on its debt and passed on some of the losses to lenders. Iceland’s sovereign CDS, at the time of writing, was trading below Ireland’s (Chart 3.1). While Iceland may have avoided a deeper slump, the default might have damaged its long term prospects.
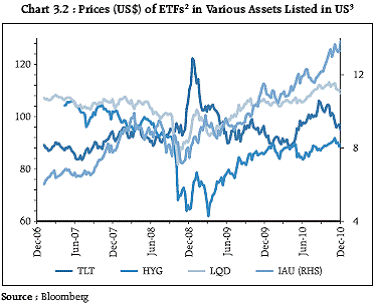
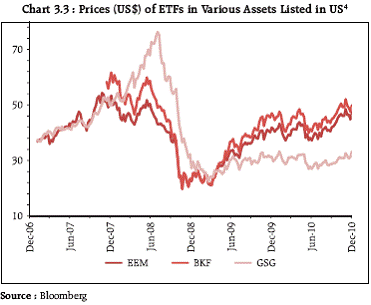
Accommodative monetary policy persists 3.4 Having reduced policy rates to near zero levels, the Federal Reserve expanded its balance sheet size as the next policy tool. Japan too embarked on Quantitative Easing (QE) by setting up a fund of JPY 5 Trillion (approximately US$ 60 billion) to buy various assets including Japanese treasury securities. In Europe, the ECB has started a Securities Market Program wherein it effectively became a buyer-of-last-resort for the peripheral European sovereign bonds whose markets became dysfunctional and relaxed rating criteria in its collateral policy. Concerns about the health of the banking sector in Europe (particularly in the directly affected countries) and some southern European sovereigns and Ireland remain. Systemic Leverage on the rise 3.5 Corporate bond issuers were able to raise both short and long term money at record low interest rates that compare favourably with dividend yields on their stocks thus incentivising higher leverage. Leveraged loan1 sales are approaching a three-year high, enabling companies to slash borrowing costs, as yields relative to junk bonds reached the narrowest in many months. Asset bubbles may reemerge 3.6 The low and benign interest rates in advanced economies accompanied by lower market volatility since the crisis have given rise to fears of asset bubbles in various markets (Charts 3.2 and 3.3). A low yield environment encourages investors to enter into ‘crowded trades’ such as emerging market assets. Bank of Japan has opined that “such easy monetary conditions are likely to contribute to the emergence of another bubble” (Governor Masaaki Shirakawa, October 2010).
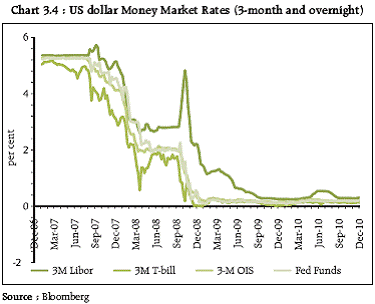
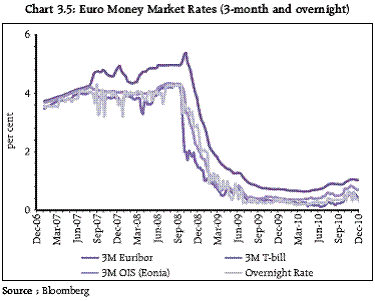
Moral hazards of accommodation 3.7 The above developments raise the spectre of increased systemic leverage with potentially disruptive effects when normalisation of monetary policy starts. The Japanese experience with a long period of deflation fighting measures including quantitative easing shows that given the low cost of forbearance in a low interest rate regime, banks tend to have a lesser incentive to monitor underlying credit weaknesses of the borrowers and loans may be extended/restructured more liberally. New credit may also be extended on overoptimistic assumptions of servicing capacity based on current low interest rates. Such actions may impact the credit quality of the loan portfolio of banks and the health of their balance sheets. All of these raise the spectre of increased systemic leverage. 3.8 A prolonged period of very low interest rates (Charts 3.4 and 3.5) carries several risks for financial markets, especially if economic decisions are taken by private players, including banks, on the assumption that the accommodative policy stance will continue indefinitely. They could start relying on central bank facilities on a routine basis creating dependencies on policy support.
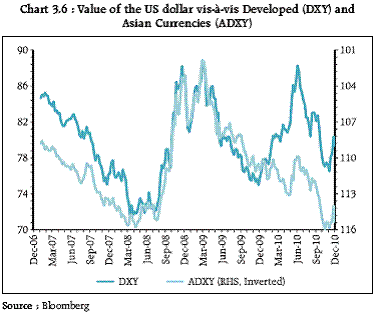
Tensions over Currency Valuations 3.9 Easy monetary policy followed in advanced countries, especially the US, has led to a weakening US dollar (Chart 3.6). Japan intervened in mid-September 2010 as its currency closed in on its all-time high against the US dollar. Central banks in several EMEs have also responded with stepped up foreign exchange market intervention. Persistence of accommodative policies could lead to tensions over currency valuations, especially amongst countries enjoying large current account surpluses with the US.
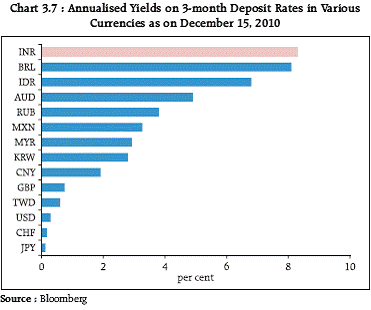
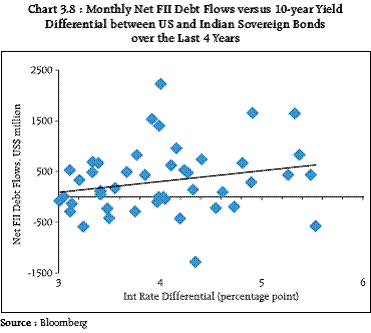
Domestic Financial Markets 3.10 The domestic financial markets functioned in an orderly manner since March 2010 though some strains in inter-bank liquidity persisted. The growth prospects of the Indian economy coupled with higher yield has attracted capital flows into Indian financial markets. While such flows aid in funding the current account deficit, large and lumpy flows can distort valuations in financial markets and fuel asset bubbles. 3.11 Excessive capital flows remain one of the key risks faced by the Indian economy. India, like many emerging markets especially in Asia, has recovered from the financial crisis-led slowdown much faster than the advanced world. Significant policy tightening in India has resulted in widening of the interest rate differential vis-à-vis advanced economies (Chart 3.7). In an environment of low risk aversion, it is not surprising that capital flows to the country have risen in tandem with the increase in the interest rate differentials in recent months (Chart 3.8).
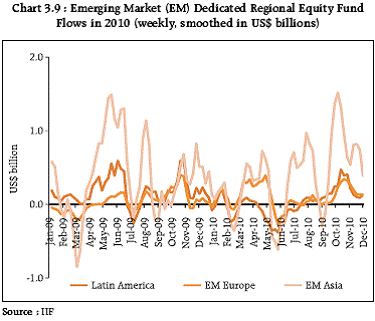
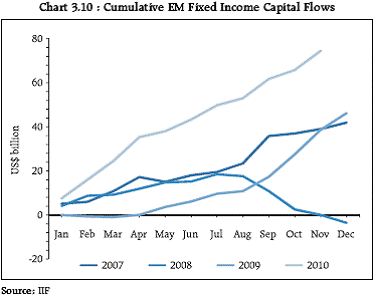
3.12 Large capital flows potentially create imbalances in the near term especially when, in the absence of large and deep capital markets, incremental growth in absorption capacity5 fails to match the pace of flows. Increased reliance on non-FDI flows 3.13 A potentially worrying feature of capital flows to India has been the dominance of portfolio flows as compared to the more stable investment flows. Foreign portfolio capital inflows (gross) constituted more than half of all capital inflows last year. Such capital is typically volatile and requires watchful management. Further, by their very nature, such portfolio flows tend to inflate Real Effective Exchange Rate (REER) (with potential impact on trade balance) as compared to FDI flows which in fact have reduced REERs in some regions6 . Rising prominence of the finance channel increases contagion risks 3.14 There are four channels of transmission of shocks viz. trade, finance, commodity prices and expectations. In India, an analysis of the trends in cyclical synchronisation shows that the finance channel of transmission was more pronounced during recent periods, reflecting the strengthening of the global integration of the Indian economy through increasing financial flows. Financial variables, viz., bank credit, capital inflows, call rate and the Sensex explain as much as 50 per cent of the variation in GDP for data from 1996 to 2009 using a vector autoregressive model. The impact of the financial channel was pronounced on account of capital flows (RBI, July 2010). 3.15 This increasing synchronisation also raises the risk of the disruptive impact of sudden reversals on domestic markets. IMF’s econometric tests on portfolio flows to emerging markets suggest that such flows (Charts 3.9 and 3.10) tend to be “persistent” and have “high degrees of autocorrelation” over several months. The inflow of such funds into EM countries, like India, is often self reinforcing with success in initial investments by a fund leading to further allocation by the same fund as well as emulation by others.
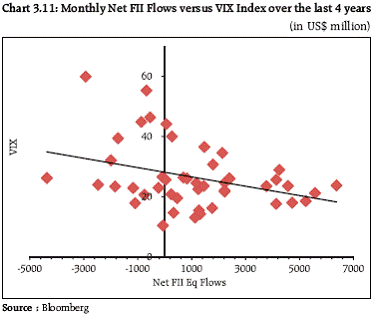
3.16 Typically, flows are expected to be more stable under orderly conditions in global financial markets whereas any rise in risk aversion as indicated by the VIX Index (popularly referred to as the “fear gauge”) could lead to a reduction or even reversal of flows (Chart 3.11). As mentioned earlier, the strains have resurfaced in global markets and a return to higher volatility and risk aversion cannot be ruled out.
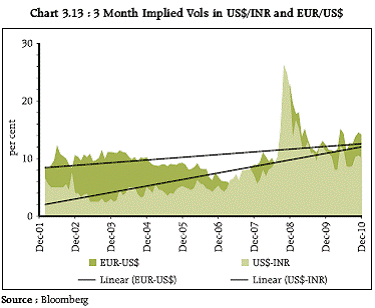
3.17 The transmission of shocks from advanced economies is accentuated by the presence of international banks through affiliates. While the presence of these banks has benefits in terms of enhanced efficiency, liquidity provision, risk-sharing, and overall superior growth opportunities, it also enhances the ease of transmission of global shocks to the domestic economy, for example through volatilities in cross-border lending. “Domestically-owned banks in emerging markets are not immune to transmission and associated lending growth contraction. The ex ante balance sheets of source countries appear to matter for the ex post consequences”7. Approach to capital flows 3.18 There are no easy options to managing excessive capital flows. Emerging markets like India are continuing to face the usual dilemma of the impossible trinity. There is a consensus emerging that macroprudential tools are more appropriate than monetary policy to address excessive capital flows. In the Indian context, a combination of price, end-use restrictions and quantity based measures have been calibrated to tackle such flows. Capital controls as options for capital account management can, in theory, help in cherry picking of flows. But such controls can be circumvented. The Reserve Bank’s policy toward capital account management is conscious of such possibilities. Foreign exchange markets: Rising integration 3.19 The exchange rate displayed two-way movements consistent with the Reserve Bank’s policy of maintaining orderly conditions in the market rather than targeting any level of the exchange rate. The Reserve Bank’s exchange rate policy is designed so as not to intervene in foreign exchange markets if capital flows are “driven by changing economic fundamentals”. Its exchange rate intervention is limited to absorbing lumpy and volatile flows that threaten macroeconomic and financial stability (Governor D. Subbarao, October 2010). The broad traded range during the period of review was `44 to `47 against the US dollar. Volatility aligning to international levels 3.20 Increased correlation across markets and faster and easier “pass through” of global disturbances to the domestic markets has led to increased volatilities, especially in the domestic equity and currency markets. Sentiments in Indian foreign exchange market are often aligned to the broad US dollar strength or weakness, generalised risk appetite or aversion and FII purchase or sale activity in the equity market (Chart 3.12). As a result, volatilities in domestic foreign exchange market have started aligning to those of advanced markets (Chart 3.13). This carries the risk of higher hedging costs for the real sector.
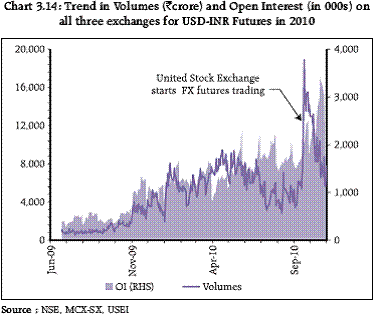
Trends in the currency futures market 3.21 With the launch of the United Stock Exchange of India (USEI) in September 2010, currency futures in India are traded on three exchanges. In a departure from trends globally, turnover in currency futures is comparable to that of OTC foreign exchange forwards and swaps markets. Trading volumes in currency futures, particularly with the start of the USEI, have risen sharply without a concomitant rise in open interest which suggests preponderance of speculative day-trading (Chart 3.14). Such speculative activities, if prevalent, could be facilitated by low transaction costs (as exchanges are not charging transaction fees) and the non-applicability of the securities transaction tax. At the same time, tighter spreads on currency futures are indicative of higher liquidity. While this is encouraging, undue reliance on ‘speculators’ for market liquidity can be disruptive during periods of market stress.
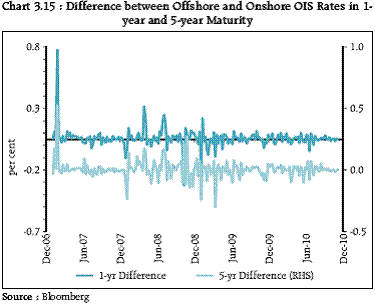
Large offshore Rupee market 3.22 Recent estimates8 point to a large and growing share of offshore currency markets - 52 per cent of total daily turnover for foreign exchange forwards [Non-deliverable Forward9 (NDFs )] and swaps and 34 per cent for interest rate swaps, forward rate agreements and interest rate options (though there is some understatement of the size of the onshore market). Prevalence of a large offshore market raises systemic concerns with regard to both monetary policy and financial stability as the offshore and onshore markets do not operate in silos. 3.23 An internal study looking to gauge the interlinkages between the onshore and offshore market points out that change in NDF premia Granger-cause changes in onshore forward premia. In turn, the changes in the onshore spot rate Granger-cause the same in NDF premia. Such linkages cause a broad alignment between the onshore and offshore markets (Chart 3.15) that makes pass-through of external shocks easier.
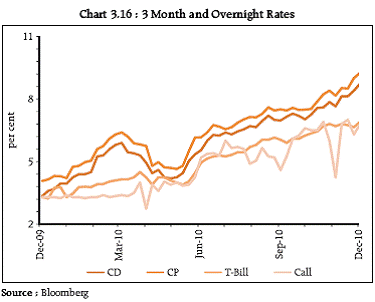
3.24 In the Indian context, the major participants in the NDF markets are understood to be hedge funds and multinational firms (both domestic and foreign). Such participants tend to be guided more by international developments than domestic factors. Adding to the risks arising from NDF markets is the fact that information and flows going through in such markets are not available in a reliable and transparent manner. This opacity prevents the central bank from having an adequate early warning mechanism to tackle balance sheet adjustments and disorderly winding down of large one-way bets driven by market players. Indian money markets: resilient with a few soft spots 3.25 Money market rates increased as policy rates were hiked and liquidity conditions tightened. Call money rates rose from around 3.5 per cent to 7 per cent in mid-December 2010. CP and CD rates have risen more sharply than warranted by rate hikes by the Reserve Bank. 3 month CD/CP rates have scaled 9 per cent in mid-December from around 4 to 5 per cent at end-March 2010 (Chart 3.16).
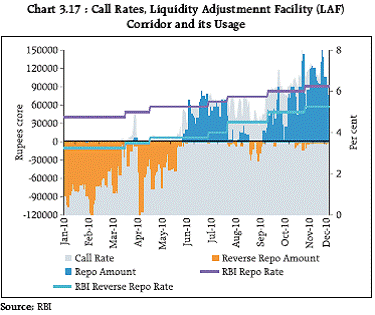
Liquidity deficit requires watchful management 3.26 Liquidity conditions exhibited some strains initially due to large payouts to the Government for allocation of 3G spectrum and Broadband Wireless Access. Tight money market conditions have been accentuated by structural factors such as significantly above-trend currency expansion and relatively sluggish growth in bank deposits even as the credit growth accelerated in 2010-11. In recent weeks, liquidity tightened beyond the Reserve Bank’s “comfort level”, as a result of build-up of government balances (Chart 3.17).
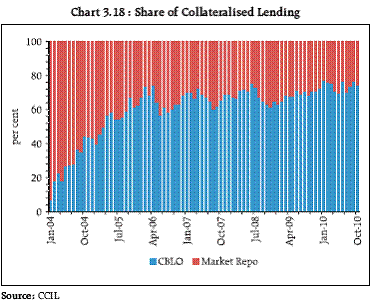
3.27 The strains are being managed through a combination of policy measures and active liquidity management by the Reserve Bank aimed at bringing primary liquidity and liquidity deficit closer to the comfort zone and to stabilize overnight interbank rates. The latest measures in this regard include a reduction in the Statutory Liquidity Ratio by one percentage points to 24 per cent and conduct of open market operations for purchase of securities through auctions. These actions announced in the Mid-Quarter Monetary Policy Review on December 16, 2010 can potentially inject liquidity of the order of `48,000 crore on an enduring basis. 3.28 Persistent and excessive deficits induce unpredictability in both availability and cost of funds, making it difficult for the banking system to price their liabilities/assets or sustain credit delivery. The success of the latest policy measures is contingent upon the market’s response to the OMO purchase auctions. The liquidity situation will require watchful management in the coming months. Inter-bank markets substantially collateralised but remain largely overnight 3.29 The focus of the Reserve Bank has been to encourage collateralisation, development of an appropriate yield curve and better risk management by market participants. Policy measures in this regard include restricting access of the call money market to banks and primary dealers, widening the availability of products, putting in place guaranteed clearing of government securities transactions, addressing information asymmetry through trade reporting, monitoring and appropriate disclosure requirements. Accounting treatment of repo transactions has been revised to reflect the economic essence of repo as a collateralised instrument and to reflect the fair picture of risks faced by lenders and borrowers. 3.30 The collateralised market exists in two forms: Market Repo and Collateralised Lending and Borrowing Obligation (CBLO)10 . Repos in government securities permitted only to eligible participants, mostly regulated entities, are settled through a CCP (CCIL). The market has shown distinct preference for the CBLOs as it offers greater flexibility, much like a tri-party repo (Chart 3.18).
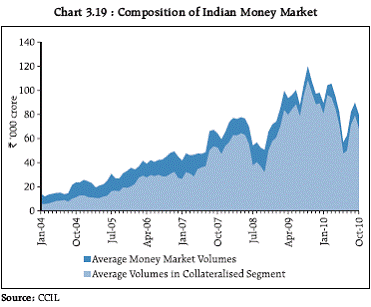
3.31 Insurance companies and mutual funds are the major providers of funds in the inter-institutional money market. Their shift from the call money market has contributed to the collateralisation of the overnight money market (Chart 3.19).
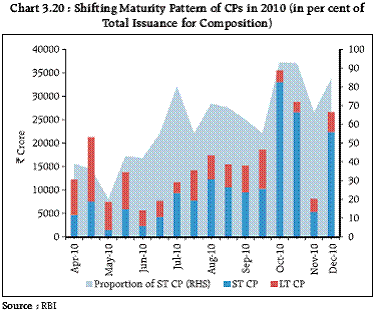
3.32 Repo market creates a strong link between asset prices (collateral value) and funding costs for institutions through the process of margining. While a credit squeeze (liquidity hoarding in a downward market by cash lenders) helps the cash lender’s position, it forces borrowers in the repo market into deleveraging of illiquid assets (earlier offered as collateral). This leads to investor concerns about counterparties which feed into funding concerns for financial institutions. For India, this is not an issue (so far) because the repo market is almost entirely in government securities and banks as borrowers have recourse to central bank funding against government securities on a daily basis under LAF. Intraday volatility in call rates 3.33 Call money rates generally stayed within the LAF corridor while the corridor itself was reduced by 50 basis points in line with the attainment of greater normalcy in global and domestic financial markets. However, call money market rates in the country often display intraday volatility. Volatility tends to increase towards the end of the day in thin market conditions when some banks seek funds to cover unexpected Real Time Gross Settlement (RTGS) flows. The LAF facility operated by the Reserve Bank once every morning proved to be inadequate during stressful liquidity conditions. Considering this aspect, the Reserve Bank has decided to conduct LAF twice a day – one in the morning and another in the second half of the day. Non-uniform distribution of excess SLR securities leads to volatilities in call rates 3.34 Recourse to liquidity under LAF is dependent upon availability of government securities in excess of mandatory Statutory Liquidity Ratio (SLR) holdings. Since the distribution of excess SLR holdings is not uniform across banks, those short on funds and excess SLR securities have to depend on other banks to access funds from the Reserve Bank. At times, such indirect access is constrained by availability of limits - interbank as well as regulatory (lending and borrowing as a proportion of capital funds) limits. In view of such market microstructure issues, the call money rates tend to breach the LAF corridor in tight liquidity conditions (Chart 3.17). Impact of government balances on money market rates 3.35 The Reserve Bank as holder of Central Government balances receives tax payments at regular intervals, the flow back of which is dependent upon government spending. Pay-ins by the telecom companies (post auctions for 3G on mobile and Broadband and Wireless Access services) to Central Government stressed the liquidity conditions in May and June 2010. However, the tight liquidity conditions continue to persist on account of structural factors as indicated in paragraph 3.26 of this Chapter. Going forward, in the background of greater exchange rate flexibility and increases in the tax/GDP ratio, Government balances may become more critical in affecting liquidity conditions. Idiosyncrasies in development of term money volumes 3.36 In India, banks, primary dealers, insurance companies and mutual funds typically lend temporary surpluses only in the overnight markets making the term money market very shallow. To an extent, the lack of a term money market is due to the balance sheet structure of the banks in India. Inter-bank claims or purchased funds11 account for a small proportion of the banks’ assets in India. The liability side is deposit driven, with emphasis on low cost current account and savings account (CASA) deposits, reflecting the “lendand- hold” model of Indian banking as opposed to the originate-and-distribute model that relies more on wholesale market funding. This feature has, however, lent stability to the banking system. 3.37 In addition, there is the general issue of the public sector banks (PSBs) not being active in the financial markets. Borrowing in the call money market segments is dominated by foreign and private sector banks that hold less than 30 per cent of the banking system’s assets. PSBs comfortably raise wholesale resources through Certificates of Deposit (CDs) and bulk deposits when warranted or deploy short-term surpluses through large ticket corporate loans at a premium over the prevailing call money or reverse repo rate, even when on a risk adjusted basis a term loan to another bank may have been equally attractive or prudent. The inertia of PSBs evidenced in financial markets is possibly a result of their focus on traditional banking products coupled with an organisational structure which does not incentivise active treasury management. 3.38 CDs represent a term instrument which is used by the major participants in the money market i.e. banks, PDs, MFs and insurance companies. Volumes in the CD market are high and growing - outstanding amount of CDs is nearly `3,53,000 crore (as on December 24, 2010) with fortnightly average issuance size of around `25,000 crore. Though the CD rates are not pure inter-bank rates (i.e. free from reserve requirements, stamp duty, etc), they are still largely reflective of the term structure. Measures such as (i) polling of 3, 6, 9 and 12 month CD rates (ii) wider dissemination of primary market details (iii) trading on the NDS platform for enhancing price transparency (iv) reporting of CD issuances (to the Reserve Bank) by banks through a return filed through the Online Financial Reporting System (OFRS) and (v) rationalising the stamp duty structure on CDs can provide impetus to the growth of a robust CD market in India. Shortening of Maturity patterns of Commercial Papers (CPs)/ CDs 3.39 Mutual Funds are the major investors in CPs and CDs. The issue of circularity of funding whereby banks invest in instruments of mutual funds who in turn invest in CPs and CDs was highlighted in the FSR of March 2010. In recent months, significant growth in CPs and CDs of tenor up to 3 months was evidenced. This trend appears to be largely driven by regulatory instructions requiring mutual funds and asset management companies to mark-to-market all money market instruments having residual maturity greater than 91 days (Chart 3.20). This trend could potentially raise liquidity and rollover risks for the issuing entities in times to come.
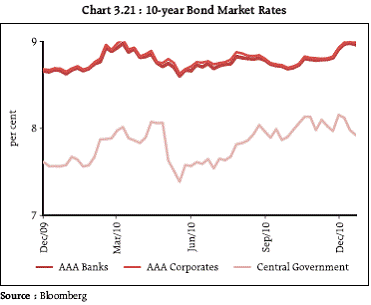
Domestic Bond Markets: More depth and liquidity needed 3.40 Since the last FSR, the bond yields at the shorterend have firmed up considerably in response to rate hikes and the tight liquidity conditions in the money market. The yield curve is much flatter now. Corporate spreads in the 5 and 10-year sectors have narrowed as the yields on government securities have risen more in comparison, possibly due to the large primary market supply (Chart 3.21).
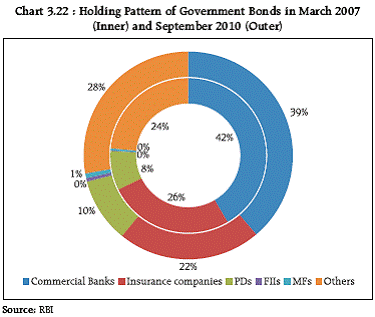
3.41 Bond markets in India and elsewhere in EMEs are characterised by lack of incentives to trade actively. A supply-heavy market on account of large government borrowings is a key factor behind the lack of active trading interest. The Banks and insurance companies are statutorily required to maintain a relatively high proportion of liabilities in approved securities, mainly government bonds (Chart 3.22). For financial stability reasons, regulations allow banks in India to hold the entire mandated proportion under the Held-till- Maturity (HTM) category which also reduces the tradable portion of securities portfolio held by banks.
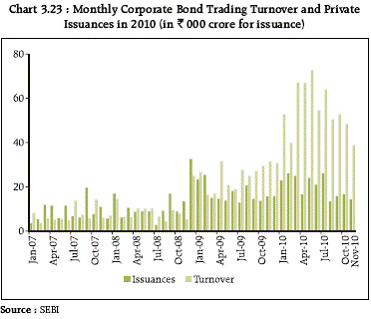
Hedging possible but not preferred 3.42 Interest rate swaps (IRS) were introduced in India for hedging interest rate risk of investment portfolios. The market for interest rate swaps is fairly liquid up to 5 years though hedging a government bond portfolio using IRS involves a significant degree of basis risk. 3.43 To an extent, the lack of incentive to manage risks dynamically works against the success of hedging products like the Interest Rate Futures (IRFs). The futures contract is settled by physical delivery and since most of the securities in the deliverable basket, including the cheapest to deliver, are illiquid, pricing of the contract is not easy. Moreover, the duration of bank portfolios is lower than that of the underlying of the 10-year bond futures contract and therefore, it is not best-suited for hedging purposes. In order to address these issues, the Reserve Bank is, in consultation with the Securities and Exchange Board of India (SEBI), examining the introduction of cashsettled IRF contracts in 2-year and 5-year notional coupon bearing Government of India securities and 91-day Treasury Bills. Corporate bond market growing but slowly 3.44 A vibrant corporate bond market is considered imperative for bringing about the much needed shift in the Indian financial system of disintermediation away from the banks. However, inspite of persistent policy focus, this is one area where the outcomes have been less than satisfactory. While volumes in the secondary market have increased four-fold between 2007 and 2010 (Chart 3.23), the absolute amounts remain low. Many proactive policy measures have been taken in the recent past to improve the market microstructure necessary for facilitating marketisation of corporate bonds, including improving the issuance procedures, standardisation of market conventions, putting in place efficient trading and settlement mechanism and enabling repoability of corporate bonds. Trades in corporate bonds have to be mandatorily reported and are centrally settled12 though the secondary market is not liquid enough to facilitate guaranteed settlement .
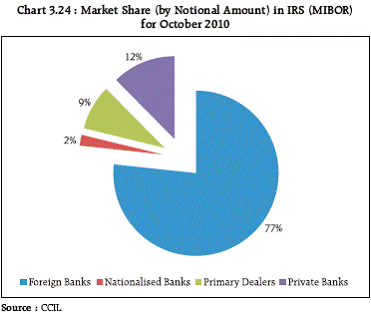
3.45 However, the intractable issues pertain to the structural elements relating to the lack of appetite for credit risk among non-bank institutional investors, particularly insurance funds and pension funds. While part of it can be attributed to discomfort with the existing legal framework for enforcing security and the bankruptcy regime, large supply of risk-free sovereign securities and securities of quasi-sovereign entities, including financial institutions, works as a disincentive to go down the credit curve. Some tax related issues also remain to be addressed. 3.46 A case has been sought to be built in favour of allowing banks to guarantee bonds. While this may be expedient, the underlying objective of de-risking the bank balance sheets will not be met. Further, this would hamper the process of true price discovery for credit risk in the market through corporate bonds. 3.47 Going ahead, the proposed introduction of Credit Default Swaps (CDS) could provide a fillip to the development of the domestic corporate bond markets. The introduction of CDS in India will have to be calibrated with the introduction of standardised contracts with centralised reporting and standardised day-end pricing of outstanding contracts initially, to be followed by migration to CCP cleared and guaranteed settlement over a period of time, as has been the international experience in this respect (Box 3.1). Concentration in Indian financial markets 3.48 The OTC derivative markets in India, as also the government securities market to an extent, display a significant degree of concentration. While concentration in financial markets is not unusual, the domination by a few banks in the OTC interest rate derivatives market (Chart 3.24) heightens the risks of illiquidity during times of market stress. During stressful times, market makers tend to withdraw their services in order to use their inventory, counterparty limits and liquidity to protect their own portfolios. Each participant has an incentive to withdraw, and if they all do so; the worst case scenario, markets can become dysfunctional13 . The skewed participation also raises the risks of faster transmission of disturbances from global financial markets.
Box 3.1: Proposed Safeguards in Credit Default Swaps (CDS) Credit risk transfer products like CDS have the potential to change an institution’s risk profile, destabilize the cash market and increase systemic risk. Build-up of excess leverage, opacity and counterparty risk management emerged as key issues in the financial crisis with regard to Over-the-Counter (OTC) markets, particularly in CDS. In India, CDS is sought to be introduced with adequate safeguards. An Internal Group of the Reserve Bank has suggested that several measures be put in place before CDS is introduced in India for Corporate debt. It has sought mandatory reporting of trades and setting up of a trade repository for capturing the CDS trades before the eventual migration to a centralized clearing system. Some other safeguards suggested in the report to address systemic risks in CDS are:
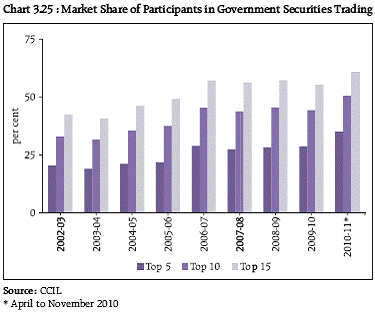
Exchange traded versus OTC design Both CDS indices and Single name CDS trade OTC. While interbank trades in respect of indices are generally cleared through exchange clearing houses, progress in migrating to centralised clearing and settlement in respect of single name CDS contracts has been slow worldwide. An exchange-traded product provides a sound platform for price discovery, which is neutral and independent. Counterparty credit risk gets transferred to clearing houses of exchanges which act as CCPs. Market activity is significantly more transparent and at the same time more anonymous. As the experience with currency products demonstrate, exchange traded contracts can ‘crowd in’ a variety of participants, thereby deepening the market, reducing bid-offer spreads and market impact cost. Further, exchanges through its day-end (and occasional intra-day margins) make credit valuation adjustment upfront and transparent. While the merits of CCP settlement are undeniable, the advantages of the exchanges in managing the risk of a diverse class of contracts are largely contingent on the liquidity of underlying contracts. Given the current state of development of the corporate bond market, liquidity in all single name CDS cannot be assured. Large pool of illiquid contracts with the clearing house concentrate risks, provide little netting benefits by way of central clearing to the counterparties and in the event of credit defaults (which tend to be correlated), can be potentially destabilising to the system. Credit risks inherent in illiquid contracts are better managed by banks as it can be dovetailed within the counterparty client limits. Moreover, there are no established benchmarks for margining of credit contracts (unlike foreign exchange futures where the existence of maturity specific exchange rate volatility predated introduction of currency futures). In the absence of such historical data, the margining regime in the exchanges runs the risk of either being too conservative or too low thereby either impairing liquidity or endangering clearing house solvency respectively. These factors have made exchanges reluctant to clear the less liquid segments of the single name contracts and transition to exchange settlement of single name CDSs has been slow in Europe and US notwithstanding a clear mandate to the exchanges for the same. 3.49 Concentration is high in government securities market in terms of both the number of participants and the number of securities actively traded. The top 15 participants accounted for more than 60 per cent of outright trades in government securities in 2010-11 (April to November) (Chart 3.25). Similarly, a single security accounted for over 46 per cent of traded volumes in the government securities market in September 2010 while the top three traded securities accounted for over 75 per cent of the trading volume during the month. Overall, only a tiny fraction (0.43 per cent in September 2010)14 of the outstanding stock of government debt gets traded on any day. The shallow liquidity in the government securities market lowers the economic utility of market based valuations of securities and limits exit options for the participants during stressful market situations.
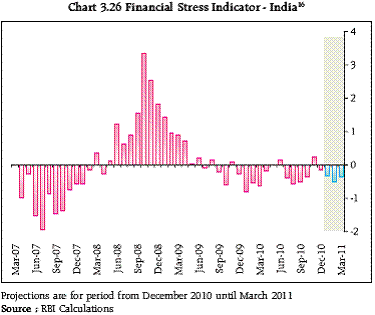
3.50 Higher participation by ‘larger’ banks (in terms of balance sheet size) is critical for better market liquidity. Presently, it is the banks with smaller balance sheets that dominate trading in the secondary markets (Table 3.1). This skewed participation hampers volume growth and makes the market prone to bouts of illiquidity. Financial Stress Indicator – healthier conditions forecasted 3.51 The Financial Stress Indicator15 mirrored the heightened global stress scenario in the third quarter of 2008-09 in the wake of the failure of Lehman Brothers. In response to the swift and calibrated monetary and fiscal measures initiated in India, the FSI has been on the downward trajectory since November 2008. The recent period, as manifested in the FSI, (Chart 3.26) has been stress-free barring two occasions in which small and temporary stress levels were discerned. In May 2010, tensions in European sovereign bond market caused volatility across global financial markets while in November 2010, it was volatility in the foreign exchange market as reflected in rise in Exchange Market Pressure (EMP)17. Going forward, the financial markets as a whole are expected to remain stress-free during last quarter of 2010-11.
Concluding Remarks 3.52 The exogenous threats to stability of financial markets in India are likely to be more potent than endogenous ones. The two-track recovery in global growth and divergent paths of monetary policy measures between advanced and emerging economies has increased the risk of large and auto-correlated capital inflows with the potential to create imbalances in Indian financial markets, especially if they exceed the country’s absorption capacity. Dominance of volatile portfolio flows facilitates sharp reversals (in the wake of external shocks) and could destabilise domestic financial markets. External shocks could arise as a result of higher systemic leverage that is incentivised by the prolonged low interest rate regime. They could also arise as a result of tensions in markets over currency valuations. 3.53 In India, the finance channel for spread of contagion has become stronger than the trade channel in recent years and this could facilitate a faster and wider spread of contagion. Domestic financial markets remained resilient. Banking system liquidity has remained tight beyond the comfort zone of the central bank. The latest measures to ease liquidity are contingent upon the success of the OMO purchase auctions and higher government spending. Volatility in the foreign exchange market may remain high due to increased integration and a growing offshore market. Narrow participation in the interest rate swap market can render it illiquid in times of market stress. Development of the term money and corporate bond markets will be challenging despite there being no serious regulatory impediments. Given the dominant position of banks in the financial sector, active participation from the larger banks is critical for the vibrancy in most segments of the financial markets. 1 A loan provided to a company that already holds large debt on its balance sheet and therefore carries a higher risk of default. Such loans are arranged typically through a syndicate and given to firms perceived to be good candidates for turnaround. Such loans are often used in leveraged buy-outs (LBOs) of firms. 2 ETFs, which are growing in popularity among international investors, have been used to depict movements in various asset classes. 3 Barclays ETFs (iShares) listed in US stock exchanges for various assets classes have been used to depict their movement. TLT is the iShares Barclays 20+ Treasury Bond Fund and tracks the eponymous Index. It is composed of Treasury bonds of maturities higher than 20 years. HYG refers to the iShares iBoxx $ High Yield Corporate Bond Fund. LQD and IAU are similarly the iShares iBoxx $ Investment Grade Corporate Bond Fund and iShares Gold Trust respectively. 4 EEM refers to Barclays iShares MSCI Emerging Markets Bond Index Fund and seeks to track the MSCI TR Emerging Markets Index of equities. BKF stands for the MSCI BRIC Index Fund for equities. GSG is the iShares S&P GSCI Commodity-Indexed Trust. 5 Generally the current account deficit of a country constitutes its absorption capacity. 6 Damyana Bakardzhieva, Sami Ben Naceur, and Bassem Kamar, The Impact of Capital and Foreign Exchange Flows on the Competitiveness of Developing Countries, IMF, July 2010 7 Global Banks and International Shock Transmission: Evidence from the Crisis, Nicola Cetorelli, Linda S. Goldberg, Federal Reserve Bank of New York, May 2010 8 BIS Triennial Central Bank Survey of 2010 9 Non-deliverable Forward is a forward contract in which counterparties agree to settle the difference between the contracted NDF price and the prevailing spot price on maturity in cash. Such transactions typically take place in an offshore location in order to overcome regulations banning a certain current or capital account transaction or owing to convenience of operating from an offshore venue. In India, the current account transactions are liberalized and can be freely undertaken onshore while there are some capital account transactions that are prohibited. 10 CBLO is a money market product conceived and developed by CCIL. It can be traded with guaranteed settlement at CCIL among participants and has a maximum tenor of one year. 11 Typically, banks can provide their liquidity needs by two methods: stored liquidity and/or purchased liquidity. The former utilizes onbalance sheet liquid assets and a well-crafted deposit structure to provide all funding needs; the latter uses non-core liabilities and borrowings to meet funding needs. CFSA Report (2009) recommends that “It may be worthwhile considering specific regulatory capital charge if a bank’s dependence on purchased liquidity exceeds a defined threshold”. 12 Repo in corporate bonds was allowed in March 2010 after ensuring settlement on DVP basis through transitory pooling accounts of exchange clearing houses with the Reserve Bank. 13 Gary J. Schinasi, Restoring Financial Stability, 2006 14 Average daily trading volumes in government dated securities, treasury bills and state development loans during September 2010 as a percentage of the outstanding stock of government dated securities, treasury bills and state development loans as on September 30, 2010. 15 The FSI is designed to capture the contemporaneous severity of the developments as they transpire in domestic financial markets and in the banking sector. It has four components viz. Banking, foreign exchange, debt and equity markets. The Banking component includes sensitivity i.e. beta of banking sector’s stock index (Bankex) to broader market (Sensex), spreads on CDs over treasury bills, GARCH volatility of Bankex and growth in real rate of non-food credit of banks. The Forex component includes EMP and GARCH volatility of the US$/INR exchange rate. The Debt segment incorporates changes in the slope of the sovereign yield curve and spreads of CPs over treasury bills in 3 month maturity. The equity component includes level of Nifty and its GARCH volatility. Details of construction methodology were furnished in FSR March 2010. 16 The projections use univariate time series models (ARIMA, ARCH, and GARCH) to forecast each of the ten component indicators of the FSI from the four broad sectors viz. banking, exchange rate, debt and equity markets. The shaded portion represents the forecast value from December 2010 to March 2011. The mean value is almost zero as FSI is constructed based on standarised value 17 EMP is defined as a function of change in exchange rate, reserve level and MIBOR rate |
கடைசியாக புதுப்பிக்கப்பட்ட பக்கம்:


