 IST,
IST,


Methodologies
Macroeconomic Stability Map The Macroeconomic Stability Map is based on seven sub-indices, each pertaining to a specific area of macroeconomic risk. Each sub-index on macroeconomic risk includes select parameters representing risks in that particular field. These sub-indices have been selected based on their impact on macroeconomic or financial variable such as GDP, inflation, interest rates or assets quality of banks. The seven sub-indices of the overall macroeconomic stability index and their components are briefly described below: Global Index: The global index is based on output growth of the world economy. A fall in output growth affects overall sentiments for the domestic economy in general and has implications for demand for domestic exports, in particular. Capital flows to the domestic economy are also affected by growth at the global level. Therefore, a fall in output growth is associated with increased risks. Domestic Growth: The domestic growth index comprises of growth of gross domestic product. A fall in growth, usually, creates headwinds for bank asset quality, capital flows and over-all macroeconomic stability. Hence, a fall in growth is associated with increased risks. Inflation: Wholesale Price Index Inflation is used to arrive at the Inflation Index. Increase in inflation reduces purchasing power of individuals and complicates investment decision of corporates. Therefore, an increase in inflation is associated with higher risks. External Vulnerability Index: The Current Account Deficit to GDP Ratio, Import Cover and ratio of Short Term Debt to Total Debt are included in the external vulnerability Index. In the Indian context, the CAD depicts the resources that need to be raised to finance imports that are in excess of exports. Capital flows from abroad can be volatile and could pose a problem in being able to finance the CAD, thereby increasing external vulnerability. Similarly, reserves cover of imports and ratio of short term debt to total debt are indicators of external vulnerability. Rising CAD and ratio of short term debt to total debt and falling import cover depict rising vulnerability. Fiscal Index: The fiscal index is based on fiscal deficit and primary deficit. Higher deficits are associated with higher risk. High government deficit, in general, reduces the resources available to the private sector for investment and also has implications for inflation. Corporate Index: The health of the corporate sector is captured through profit margin. The risks emanating from the sector are inversely related to it. Similarly, the interest coverage ratio depicts whether firms are able to meet the interest expenses. A lower interest coverage ratio is associated with higher risks. Household Index: Incremental credit to deposit ratio and retail non-performing assets comprise the household index. Increase in both variables is associated with higher risk. The current map is based on the data available till June 2012. Financial Markets Stability Map With the objective to measure stability of the financial market, Financial Market Stability Map has been prepared based on the indicators of four sectors/markets namely banking sector, foreign exchange market, equity market and debt market. The indicators selected from various sectors/markets are following; i) Banking Sector: Banking Beta of CNXBANK Index and NIFTY Index, CD Rate and CD rate minus Implied Forward rate, ii) Foreign Exchange Market: CMAX of daily INR-US Dollar exchange rate, which is defined as Xt/Max(Xi, i=1,2,..upto one year). Where, Xt is the INR-US Dollar exchange rate at time t, and 25 Delta Risk Reversals of foreign exchange rate, iii) Equity Market: Inverse of NIFTY CMAX and India VIX, and iv) Debt Market: Corporate bond which is average return of corporate bonds rated A, AA, and AAA, 10-years Government bond yield and CP Rate. Variance-equal transformation has been used to convert the indicators at same level before construction of the Map. Four indicators for the four selected sectors/market were prepared based on simple average of elementary indicators which are presented as a cobweb map. The current map is based on the data available till November 2012. Banking Stability Map and Indicator The Banking Stability Map and Indicator (BSI) present an overall assessment of changes in underlying conditions and risk factors that have a bearing on stability of the banking sector during a period. Following ratios are used for construction of each composite index:
The five composite indices represent the five dimensions of Soundness, Asset-quality, Profitability, Liquidity and Efficiency. Each index, representing a dimension of bank functioning, takes values between zero (minimum) and 1 (maximum). Each index is a relative measure during the sample period used for its construction, where a high value means the risk in that dimension is high. Therefore, an increase in the value of the index in any particular dimension indicates an increase in risk in that dimension for that period as compared to other periods. For each ratio used for a dimension, a weighted average for the banking sectors is derived, where the weights are the ratio of individual bank asset to total banking system assets. Each index is normalized for the sample period as ‘Ratio-on-a-given-date minus Minimum-value-in-sample-period divided by maximum-value-insample- period minus Minimum-value-in-sample-period’. A composite measure of each dimension is calculated as a weighted average of normalised ratios used for that dimension, where the weights are based on the marks assigned for assessment for CAMELS rating. Based on the individual composite indices for each dimension, the Banking Stability Indicator is constructed as a simple average of these five composite sub-indices. For the current map and indicator, the sample period for assessment was taken from March 2001 to September 2012. Stress Testing of Derivatives Portfolio of Select Banks The stress testing exercise focused on the derivatives portfolio of a representative sample set of banks. The top 26 banks in terms of notional value of derivatives portfolio as at end December 2011 were selected for the analysis. Each bank in the sample was asked to assess the impact of stress conditions on their respective derivatives portfolios as on September 30, 2012. In case of domestic banks, the derivatives portfolio of both domestic and overseas operations was included. In case of foreign banks, only the domestic (i.e. Indian) position was considered for the exercise. For derivatives trade where hedge effectiveness was established was exempted from the tests, while all other trades were included. The stress scenarios incorporated four sensitivity tests consisting of the spot USD/INR rate and domestic interest rates as parameters
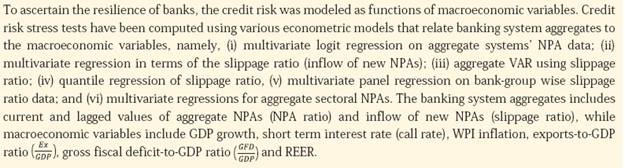
Single Factor Sensitivity Analysis – Stress Testing As a part of quarterly surveillance, stress tests are conducted covering credit risk, interest rate risk, equity price risk, foreign exchange risk, liquidity risk etc. Resilience of the commercial banks in response to these shocks is studied. The analysis covers all scheduled commercial banks. Single factor sensitivity analysis on credit risk of scheduled urban co-operative banks and non-banking financial companies are also conducted. Credit Risk To ascertain the resilience of banks, the credit portfolio was shocked by increasing NPA levels, for the entire portfolio as well as for select sectors, along with a simultaneous increase in provisioning requirements. For testing the credit concentration risk, default of the top individual borrowers and the largest group borrower is assumed. The estimated provisioning requirements so derived were adjusted from existing provisions and the residual provisioning requirements, if any, were deduced from banks’ capital. The analysis was carried out both at the aggregate level as well as at the individual bank level, based on supervisory data as on September 30, 2012. The scenario assumed enhanced provisioning requirements of 1 per cent, 30 per cent and 100 per cent for standard, sub-standard and doubtful/loss advances, respectively. The assumed increase in NPAs was distributed across sub-standard, doubtful and loss categories in the same proportion as prevailing in the existing stock of NPAs. The additional provisioning requirement was applied to the altered composition of the credit portfolio. Liquidity Risk The aim of liquidity stress tests is to assess the ability of a bank to withstand unexpected liquidity drain without taking recourse to any outside liquidity support. The analysis is done as at end-September 2012. The scenario depicts different proportions (depending on the type of deposits) of unexpected deposit withdrawals on account of sudden loss of depositors’ confidence and assesses the adequacy of liquid assets available to fund them. The definitions of liquid assets are taken as:
• It is assumed that banks would meet stressed withdrawal of deposits through sale of liquid assets only. • The sale of investments is done with a hair cut of 10 per cent of their market value. • The stress test is done on a static mode. Equity price risk, foreign exchange risk and interest rate risk The fall in value of the portfolio or income losses due to change in equity prices, appreciation/ depreciation of INR, shifting of INR yield curve are accounted for the total loss of the banks because of the assumed shock. The estimated total losses so derived were reduced from the banks’ capital. For interest rate risk in the banking Book, Duration Analysis approach was considered, for computation of the valuation impact (portfolio losses) on the investment portfolio. The portfolio losses on investments were calculated for each time bucket based on the applied shocks. The resultant losses/gains were used to derive the impacted CRAR. The valuation impact for the tests on banking book was calculated under the assumption that the HTM portfolio would be marked to market. In a separate exercise for interest rate shocks in trading book, the valuation losses were calculated for each time bucket on the interest bearing assets using duration approach. Urban Co-operative Banks Credit Risk Stress tests on credit risk were conducted on Scheduled Urban Co-operative Banks (SUCBs) using their asset portfolio as at end-March 2012. The tests were based on single factor sensitivity analysis. The impact on CRAR was studied under two different scenarios. The assumed scenarios were as under: Scenario I:
Liquidity Risk Liquidity stress test based on cash flow basis in 1-28 days time bucket was also conducted, where mismatch [negative gap (cash inflow less than cash outflow)] exceeding 20 per cent of outflow in 1 to 28 days time bucket was considered stressful. Scenario I: Cash out flows in 1-28 days time bucket goes up by 50 per cent (no change in cash inflows) Scenario II: Cash out flows in 1-28 days time bucket goes up by 100 per cent (no change in cash inflows) Non-Banking Financial Companies (ND-SI) – Credit Risk Stress tests on credit risk were conducted on Non-Banking Financial Companies (Non-Deposit taking and Systemically Important) using their asset portfolio as at end-June 2012. The tests were based on single factor sensitivity analysis. The impact on CRAR was studied under two different scenarios. The scenario assumed increase in the existing stock of NPAs by 200 and 500 per cent. The assumed increase in NPAs was distributed across sub-standard, doubtful and loss categories in the same proportion as prevailing in the existing stock of NPAs. The additional provisioning requirement was adjusted from the current capital position. The stress were conducted at individual NBFCs as well as at an aggregate level. Systemic Liquidity Index The SLI uses the following four indicators representing various segments of the market: Weighted Average Call Rate – RBI Repo Rate 3 month Commercial Paper (CP) Rate – 3 month Certificate of Deposits (CD) Rate 3 month CD Rate – 3 month Implied Deposit Rate Weighted Average Call Rate - 3 Month Overnight Index Swap (OIS) Rate In order to create the Systemic Liquidity Index (SLI), the Standard normal or Variance-equal weighted method has been used. Macro Stress Testing
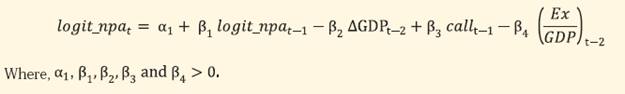
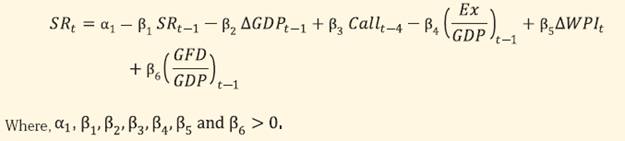
While the multivariate regressions allows evaluating the impact of selected macroeconomic variables on the banking system’s NPA and capital, the VAR model reflects the impact of the overall economic stress situation on the banks’ capital and NPA ratio, which also take into account feed-back effect. In these methods, conditional mean of NPA/slippage ratio is estimated and assumed that the impact of macro variables on credit quality will remain same irrespective of the level of the credit quality, which may not always be true. In order to relax this assumption, quantile regression has been adapted to project credit quality, in which, in place of conditional mean the conditional quantile has been estimated. The Modeling Framework The following multivariate models were run to estimate the impact of macroeconomic shocks on the aggregate NPA (npa) / slippage ratio (SR):1
The analysis was carried out on slippage ratio at the aggregate level for the commercial banking system as a whole.
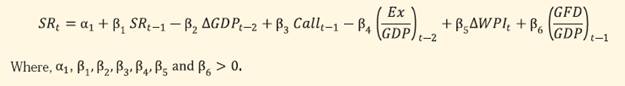
In order to judge the resilience of banking on various macroeconomic shocks, Vector Autoregressive (VAR)3 approach has been adopted. The advantage of VAR model is that, it allows to fully capture the interaction among macroeconomic variables and banks’ stability variable. It also captures the feedback effect. In notational form, mean-adjusted VAR of order p (VAR(p)) can be written as
In order to estimate, VAR system, slippage ratio, call rate, inflation, growth and REER were selected. The appropriate order of VAR has been selected based on minimum information criteria as well as other diagnostics and suitable order was found to be two. Accordingly, VAR of order 2 (VAR(2)) was estimated and stability of the model was checked based on roots of AR characteristic polynomial. Since, all roots are found to be inside the unit circle, this selected model was found to be fulfilling the stability condition. The impact of various macroeconomic shocks was determined using impulse response function of the selected VAR.
In order to estimate slippage ratio at desired level of conditional quantile, following quantile regression at 0.75 quantile (which is the present quantile the slippage ratio) was used:
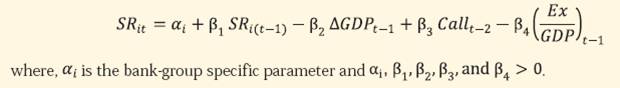
Bank-group wise panel regression was modeled where slippage ratio was considered as functions of macroeconomic variables. The bank-group effect were identified along with the overall model specifications.
The impact of macroeconomic shocks on various sectors was assessed by employing multivariate regression models using aggregate NPA ratio for each sector separately. The dependent variables consisted of lagged NPAs, sectoral GDP growth, inflation, and short-term interest rate. Derivation of the NPAs and CRAR from the slippage ratios, which were projected from the above mentioned credit risk econometric models, were based on the following assumptions: credit growth of 16 per cent; recovery rate of 5 per cent; write-offs at 2.5 per cent and risk weighted assets growth of 18 per cent, whereas, profit growth assumed to be at 15 per cent, 5 per cent and -5 per cent under baseline, medium risk and severe risk, respectively. The regulatory capital growth is assumed to remain at the minimum by assuming minimum mandated transfer of 25 per cent of the profit to the reserves account. The distribution of new NPAs in various sub-categories was done as prevailing in the existing stock of NPAs. Provisioning requirements for various categories of advances are 0.4 per cent for standard advances, 20 per cent for sub-standard advances, 75 per cent for doubtful advances, and 100 per cent for loss advances. The projected values of the ratio of the non-performing advances were translated into capital ratios using the “balance sheet approach”, by which capital in the balance sheet is affected via the provisions and net profits. It is assumed that the existing loan loss provisioning coverage ratios remain constant for the future impact. 1 Slippage ratio, exports/GDP, and the call rate are seasonally adjusted. 2 For detailed model specifications, please refer to FSR – December 2010. The logit transformation of NPA ratio is define as: 3 For detailed VAR model specifications, please refer to FSR – June 2011. |
|||||||||||||||||||||||||||||||||||||||||||||||||||||||||||||||||||||||||||||

இந்திய ரிசர்வ் வங்கி மொபைல் செயலியை நிறுவுங்கள் மற்றும் சமீபத்திய செய்திகளுக்கான விரைவான அணுகலை பெறுங்கள்!
எங்கள் செயலியை நிறுவ QR குறியீட்டை ஸ்கேன் செய்யவும்


கடைசியாக புதுப்பிக்கப்பட்ட பக்கம்:


