(Amount in Rs. crore) |
REGION/STATE/UNION TERRITORY |
RURAL |
SEMI-URBAN |
OFFICES |
DEPOSITS |
CREDIT |
OFFICES |
DEPOSITS |
CREDIT |
| |
|
1 |
2 |
3 |
4 |
5 |
6 |
1. |
NORTHERN REGION |
1,952 |
36,468 |
20,704 |
1,250 |
36,515 |
16,314 |
| |
Haryana |
318 |
5,564 |
3,414 |
246 |
7,070 |
4,252 |
| |
Himachal Pradesh |
371 |
5,885 |
1,901 |
87 |
2,134 |
928 |
| |
Jammu & Kashmir |
34 |
464 |
97 |
34 |
750 |
246 |
| |
Punjab |
675 |
16,818 |
8,046 |
544 |
18,984 |
7,274 |
| |
Rajasthan |
511 |
4,140 |
3,914 |
321 |
6,734 |
3,504 |
| |
Chandigarh |
15 |
1,505 |
360 |
_ |
- |
_ |
| |
Delhi |
28 |
2,092 |
2,973 |
18 |
842 |
109 |
2 |
NORTH-EASTERN REGION |
393 |
3,448 |
1,517 |
223 |
7,360 |
2,068 |
| |
Arunachal Pradesh |
3 |
55 |
11 |
10 |
585 |
156 |
| |
Assam |
336 |
2,873 |
1,373 |
161 |
5,114 |
1,476 |
| |
Manipur |
5 |
50 |
22 |
10 |
185 |
79 |
| |
Meghalaya |
19 |
183 |
28 |
5 |
153 |
20 |
| |
Mizoram |
- |
- |
- |
- |
- |
- |
| |
Nagaland |
3 |
5 |
3 |
19 |
956 |
233 |
| |
Tripura |
27 |
281 |
81 |
18 |
367 |
103 |
3. |
EASTERN REGION |
3,026 |
35,647 |
12,830 |
1,126 |
31,905 |
9,112 |
| |
Bihar |
917 |
10,364 |
3,410 |
332 |
8,369 |
2,034 |
| |
Jharkhand |
378 |
5,158 |
1,390 |
194 |
6,852 |
2,146 |
| |
Orissa |
535 |
5,067 |
2,798 |
238 |
5,647 |
2,169 |
| |
Sikkim |
21 |
223 |
130 |
17 |
841 |
328 |
| |
West Bengal |
1,171 |
14,786 |
5,087 |
331 |
9,710 |
2,276 |
| |
Andaman & Nicobar |
4 |
49 |
15 |
14 |
485 |
159 |
4. |
CENTRAL REGION |
2,817 |
35,021 |
18,058 |
1,469 |
34,955 |
15,845 |
| |
Chhattisgarh |
150 |
1,788 |
676 |
90 |
2,091 |
629 |
| |
Madhya Pradesh |
683 |
5,936 |
4,481 |
343 |
7,289 |
3,786 |
| |
Uttar Pradesh |
1,819 |
24,621 |
11,874 |
878 |
20,996 |
9,096 |
| |
Uttarakhand |
165 |
2,675 |
1,027 |
158 |
4,579 |
2,332 |
5. |
WESTERN REGION |
2,215 |
28,417 |
16,452 |
1,399 |
41,644 |
19,777 |
| |
Goa |
114 |
3,663 |
560 |
145 |
10,013 |
3,067 |
| |
Gujarat |
802 |
13,061 |
5,145 |
507 |
15,202 |
5,793 |
| |
Maharashtra |
1,295 |
11,600 |
10,740 |
733 |
15,779 |
10,685 |
| |
Dadra & Nagar Haveli |
4 |
93 |
8 |
7 |
355 |
136 |
| |
Daman & Diu |
- |
- |
- |
7 |
295 |
97 |
6. |
SOUTHERN REGION |
2,882 |
33,548 |
31,044 |
2,925 |
63,346 |
43,390 |
| |
Andhra Pradesh |
874 |
8,256 |
10,562 |
619 |
13,072 |
10,392 |
| |
Karnataka |
851 |
9,453 |
7,595 |
491 |
9,369 |
6,878 |
| |
Kerala |
88 |
1,384 |
834 |
874 |
18,824 |
10,096 |
| |
Tamil Nadu |
1,045 |
14,062 |
11,891 |
920 |
21,386 |
15,826 |
| |
Lakshadweep |
7 |
79 |
11 |
2 |
178 |
11 |
| |
Puducherry |
17 |
313 |
151 |
19 |
517 |
187 |
| |
ALL-INDIA |
13,285 |
172,549 |
100,606 |
8,392 |
215,725 |
106,505 |
STATEMENT NO. 5 : STATE AND POPULATION GROUP–WISE DISTRIBUTION OF NUMBER OF REPORTING OFFICES, AGGREGATE DEPOSITS AND GROSS BANK CREDIT–NATIONALISED BANKS–DECEMBER 2008 |
(Amount in Rs. crore) |
REGION/STATE/UNION TERRITORY |
URBAN/METROPOLITAN |
TOTAL |
| |
OFFICES |
DEPOSITS |
CREDIT |
OFFICES |
DEPOSITS |
CREDIT |
| |
|
7 |
8 |
9 |
10 |
11 |
12 |
1. |
NORTHERN REGION |
3,398 |
349,880 |
272,754 |
6,600 |
422,862 |
309,772 |
| |
Haryana |
600 |
27,993 |
18,571 |
1,164 |
40,627 |
26,236 |
| |
|
(68) |
(5,043) |
(3,238) |
|
|
|
| |
Himachal Pradesh |
42 |
3,498 |
1,574 |
500 |
11,517 |
4,403 |
| |
Jammu & Kashmir |
96 |
2,866 |
1,332 |
164 |
4,081 |
1,675 |
| |
Punjab |
747 |
33,409 |
26,803 |
1,966 |
69,212 |
42,122 |
| |
|
(322) |
(13,622) |
(13,067) |
|
|
|
| |
Rajasthan |
576 |
23,763 |
25,620 |
1,408 |
34,636 |
33,039 |
| |
|
(179) |
(8,768) |
(18,027) |
|
|
|
| |
Chandigarh |
125 |
11,865 |
13,823 |
140 |
13,371 |
14,182 |
| |
Delhi |
1,212 |
246,486 |
185,032 |
1,258 |
249,420 |
188,114 |
| |
|
(1,212) |
(246,486) |
(185,032) |
|
|
|
2 |
NORTH-EASTERN REGION |
234 |
12,308 |
3,958 |
850 |
23,117 |
7,543 |
| |
Arunachal Pradesh |
- |
- |
- |
13 |
640 |
167 |
| |
Assam |
158 |
8,405 |
2,897 |
655 |
16,392 |
5,746 |
| |
Manipur |
16 |
556 |
213 |
31 |
791 |
315 |
| |
Meghalaya |
25 |
1,615 |
394 |
49 |
1,952 |
442 |
| |
Mizoram |
9 |
246 |
84 |
9 |
246 |
84 |
| |
Nagaland |
— |
— |
— |
22 |
961 |
237 |
| |
Tripura |
26 |
1,486 |
369 |
71 |
2,134 |
553 |
3. |
EASTERN REGION |
2,388 |
144,908 |
81,462 |
6,540 |
212,460 |
103,404 |
| |
Bihar |
407 |
20,582 |
5,170 |
1,656 |
39,315 |
10,614 |
| |
|
(149) |
(10,862) |
(2,841) |
|
|
|
| |
Jharkhand |
246 |
12,856 |
4,861 |
818 |
24,866 |
8,397 |
| |
Orissa |
299 |
16,269 |
8,264 |
1,072 |
26,983 |
13,231 |
| |
Sikkim |
- |
- |
- |
38 |
1,064 |
458 |
| |
West Bengal |
1,436 |
95,200 |
63,167 |
2,938 |
119,696 |
70,529 |
| |
|
(817) |
(65,305) |
(56,114) |
|
|
|
| |
Andaman & Nicobar |
- |
- |
- |
18 |
535 |
174 |
4. |
CENTRAL REGION |
2,996 |
153,726 |
63,502 |
7,282 |
223,702 |
97,405 |
| |
Chhattisgarh |
176 |
12,938 |
5,400 |
416 |
16,817 |
6,706 |
| |
Madhya Pradesh |
667 |
28,627 |
13,763 |
1,693 |
41,853 |
22,031 |
| |
|
(266) |
(13,991) |
(8,778) |
|
|
|
| |
Uttar Pradesh |
2,009 |
104,701 |
42,138 |
4,706 |
150,319 |
63,108 |
| |
|
(936) |
(53,793) |
(21,703) |
|
|
|
| |
Uttarakhand |
144 |
7,460 |
2,200 |
467 |
14,714 |
5,560 |
5. |
WESTERN REGION |
3,456 |
422,352 |
425,529 |
7,070 |
492,413 |
461,759 |
| |
Goa |
- |
- |
- |
259 |
13,676 |
3,627 |
| |
Gujarat |
1,115 |
71,404 |
47,898 |
2,424 |
99,667 |
58,836 |
| |
|
(744) |
(48,786) |
(40,850) |
|
|
|
| |
Maharashtra |
2,341 |
350,948 |
377,631 |
4,369 |
378,327 |
399,055 |
| |
|
(1,714) |
(326,045) |
(365,721) |
|
|
|
| |
Dadra & Nagar Haveli |
- |
- |
- |
11 |
448 |
144 |
| |
Daman & Diu |
- |
- |
- |
7 |
295 |
97 |
6. |
SOUTHERN REGION |
4,307 |
247,833 |
249,593 |
10,114 |
344,728 |
324,026 |
| |
Andhra Pradesh |
1,318 |
62,988 |
70,412 |
2,811 |
84,317 |
91,366 |
| |
|
(514) |
(40,239) |
(51,584) |
|
|
|
| |
Karnataka |
1,240 |
87,554 |
73,224 |
2,582 |
106,376 |
87,697 |
| |
|
(612) |
(65,397) |
(59,003) |
|
|
|
| |
Kerala |
411 |
15,683 |
12,814 |
1,373 |
35,891 |
23,744 |
| |
Tamil Nadu |
1,306 |
79,639 |
92,175 |
3,271 |
115,088 |
119,892 |
| |
|
(569) |
(52,328) |
(62,509) |
|
|
|
| |
Lakshadweep |
- |
- |
- |
9 |
257 |
22 |
| |
Puducherry |
32 |
1,969 |
967 |
68 |
2,799 |
1,306 |
| |
ALL-INDIA |
16,779 |
1331,008 |
1096,797 |
38,456 |
1719,282 |
1303,908 |
| |
|
(8,102) |
(950,665) |
(888,465) |
|
|
|
Note: Figures in brackets relate to Metropolitan Centres. |
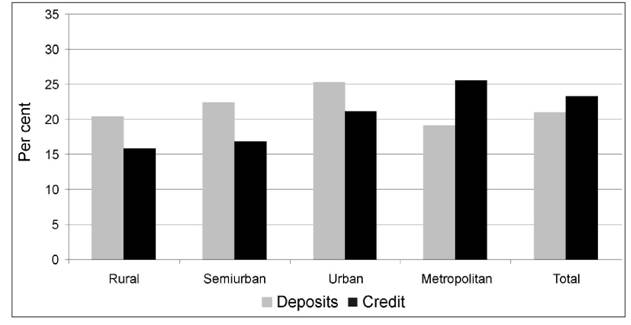
Graph 1 : Population Group-wise Annual Growth Rates in
Aggregate Deposits and Gross Bank Credit – December 2008
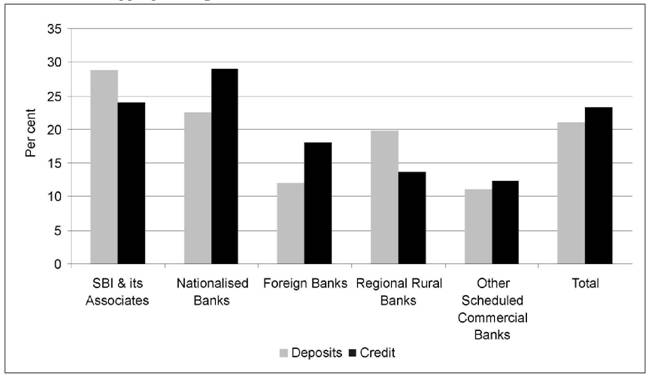
Graph 2 : Bank Group-wise Annual Growth Rates in
Aggregate Deposits and Gross Bank Credit – December 2008
|


