 IST,
IST,


V. Financial Markets
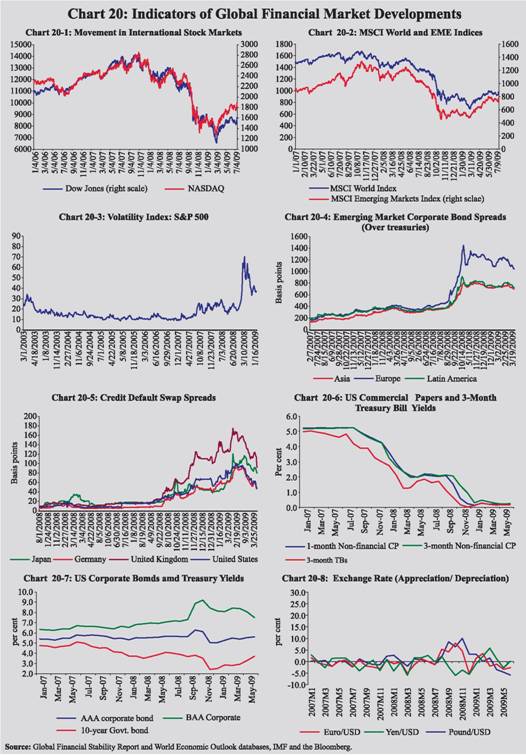
The uncertainty about the depth and duration of the global economic recession continued to influence financial markets, though policy measures aimed at stabilising the markets appear to have gained some traction over the period. By the second quarter of 2009, the international markets gained a modicum of stability upon greater public policy action, however, some segments of financial market still appear vulnerable. The Indian markets had functioned normally even during the peak of the financial crisis, and by November 2008, the excessive volatility was contained through appropriate policy response from the Reserve Bank. With receding risks and volatility, the markets improved further in the first quarter of 2009-10 as spreads narrowed significantly and market activity picked up. Reflecting ample liquidity and lower policy rates, the call rate hovered around the LAF reverse repo rate. In the commercial paper market, interest rates moderated. Taking cues from the global developments and the domestic political stability, equity markets regained a large part of the market wealth that had been eroded following the Lehman episode. Resumption of capital flows in the first quarter of 2009-10 reversed the trend of depreciating rupee. The yield curve steepened at the short end, reflecting abundant liquidity, while the medium to long-term yield increased exhibiting mainly the concerns of large government borrowing. V.1 The global financial markets that remained under stress till Q1 of 2009, witnessed reduction in volatility and risk spreads in Q2 with rebound in activity in some market segments. The flow of new macroeconomic data indicating possible moderation in the pace of slowdown in real activity, better clarity in the rescue plans for the financial sector and on the extent of losses of some major banks, led to resumption of risk appetite and, hence, notable rally in stock prices in the advanced economies. The expected bottoming out of the slowdown in some of the EMEs and the global trends led to a quick rebound in the equity markets across these countries. The comfortable liquidity conditions in money markets along with the further reduction in the policy rates in some of the advanced economies led to continued moderation in the money market rates and restored a semblance of normalcy in the various segments of the market with narrowing spreads. Notwithstanding, according to the Global Financial Stability Report update of the IMF (July 2009), sluggish credit growth in advanced economies, impaired securitisation markets, credit constrain for low quality borrowers, and mounting fiscal burden entail some vulnarabilities. The improving investor risk appetite towards the EMEs was reflected in the significant narrowing of bond spreads. The government bond yields although moderated in response to ample liquidity in the system, the retreat from safe haven concerns and worries about the ballooning deficits and public debt led to hardening of the long-term bond yields. V.2 The Indian markets, which continued to function normally even during the global financial crisis, witnessed significant reduction in volatility and risk aversion in the first quarter of 2009-10. The sustained policy easing had ensured the return of the overnight money market rates below the upper bound of the Liquidity Adjustment Facility (LAF) corridor. The spreads on various money market segments narrowed significantly and there was a general improvement in the market activity. The resumption in capital flows also enhanced the foreign exchange liquidity and led to appreciation of the domestic currency. The equity markets, on the positive global cues (as mentioned earlier), acceleration in the pace of capital flows to India, positive news on domestic real activity with the fourth quarter of 2008-09 GDP growth turning out higher than expected, and greater political stability, exhibited rebound and outperformed most of the EMEs’ and advanced countries’ equity markets. There was, however, some correction in equity prices following the Union Budget and the delayed progress of the monsoons. Subsequently, the equity prices resumed their upward trend. The yield curve although initially shifted southward in response of easy liquidity conditions, started northward movement in the subsequent period, particularly in the medium to long-term tenor, reflecting the market response to the large Government borrowing programme. International Financial Markets V.3 The global financial markets, after experiencing one of the most severe shocks,witnessed signs of stabilisation in Q2 of 2009 with rebound in activity in some of the market segments. The incipient signs of slowdown in the pace of deterioration of economic conditions in the advanced economies, better than expected corporate performance and confidence building measures by the governments and central banks helped in bolstering general confidence in the markets. The positive outcomes were reflected in a general rise in the investor risk appetite leading to significant recovery in equity prices from their lowest levels in October 2008, narrowing down of credit spreads in some market segments and a decline in the implied volatilities (Chart 20). A series of policy induced measures contributed to waning of market uncertainty and helped stabilise the financial markets in Q2 of 2009. These include further steps by the central banks to ease monetary conditions, the action plan of the G-20 announced in April 2009, publication of the specific rescue package plans for banks, particularly in the US and the UK, and the release of the results of US Fed’s bank stress-tests based action plan. V.4 The central banks continued to ease monetary conditions with the ECB cutting its main refinancing rate by 50 basis points (in May 2009) to a low of one per cent. In the Q2 of 2009, the actions of central banks, including a number of unconventional measures led to drop in treasury yields in advanced economies, mostly at the short end. Although long-term yield moderated for a while, it started hardening due to a number of developments such as return of the risk appetite and retreat from flight to safety among the investors, the concerns arising from rising fiscal deficits and mounting debt burden due to large rescue plans of the governments and sharply declining tax revenues due to recessionary conditions. Developments in interbank markets witnessed narrowing of spreads, with Libor-OIS (overnight index swap) spread and foreign exchange swap spreads showing gradual narrowing down between end-February and end-May 2009. V.5 The equity markets in developed countries as well as EMEs witnessed perceptible recovery since March 2009, with intermittent decline on negative news (Chart 20-1, 2 and 3). Although activity in most economies continued to remain weak with declining output, markets rallied on the macroeconomic data that indicated moderation in the pace of deterioration in economic activity and some early indications of bottoming out in some economies. The Baltic Dry Index, which measures the volume of dry shipping cargo movement and is generally used as an indicator of global economic activity, started moving upward significantly. Between March and July 17, 2009, NASDAQ rose by 23.4 per cent, though marked by intermittent volatility due to occasional adverse news. The rally in the stock markets was somewhat broad-based covering financials, industrials and consumer durables, underpinned by improved corporate earning expectations and reduction in uncertainty in the financial sector due to clear public policy actions. V.6 In the credit market also, investor risk tolerance increased in Q2 with US banks’ credit spreads declining upon public policy action and signs of stabilisation of markets and there was also a generalised decline in risk perception towards EMEs (Chart 20-4 and 5). The spreads, however, continued to remain higher than the pre-Lehman level and weaknesses were evident in the asset backed securities (ABS) and commercial paper (CP) markets. Improving outlook for defaults was reflected in narrowing CDS spreads in Q2 of 2009 across the developed markets. Reflecting the easing pressure on short-term funding markets, the CP spreads witnessed easing (Chart 20-6) and spread on lower rated corporate bonds also moderated (Chart 20-7). V.7 The investor appetite for EME equities rebounded with MSCI increasing by 41.5 per cent between end-March and July 22, 2009, with a few EME stock markets recovering to the pre-Lehman levels (Table 34). In the foreign exchange market, the appreciating trend of the US dollar witnessed in 2008-09 was reversed with the US dollar depreciating against most currencies during 2009-10 (up to July 21, 2009) (Chart 20-8). Between end-March 2009 and July 21, 2009, the US dollar depreciated by 6.4 per cent, 12.6 per cent and 4.2 per cent against the euro, the pound sterling and the Japanese yen, respectively. Among the Asian currencies, it depreciated against the Indian rupee, Indonesian rupiah, Malaysian ringgit, South Korean won and Thai baht (Table 34). V.8 Notwithstanding the improvement in global financial markets, the international financial system still remains fragile on account of heavy dependence on the public support, rising concerns emanating from mounting debt burden of countries, and the lack of clarity about the future exit strategies from monetary easing and fiscal support.
Domestic Financial Markets V.9 Reflecting the impact of the measures taken by the Reserve Bank, the Indian financial markets returned to normalcy much earlier than the international financial markets. Call rates in the money market have settled back into the informal LAF corridor since November 2008, having breached the upper bound in the preceding two months. In the foreign exchange market, the Indian rupee generally depreciated against major currencies up to the end of the financial year 2008-09, before appreciating in the first quarter of 2009-10, as the capital flows resumed. In the credit market, the lending rates of scheduled commercial banks (SCBs) began to soften at a gradual pace since November 2008. The activity in the government securities market was subdued for most of Q4 of 2008-09, however, the volume picked up in Q1 of 2009-10 and yields rose, particularly of the medium to long-term maturity. Indian equity markets, picking up global cues, staged recovery in the last week of March 2009, which continued in Q1 of 2009-10 (Table 35).
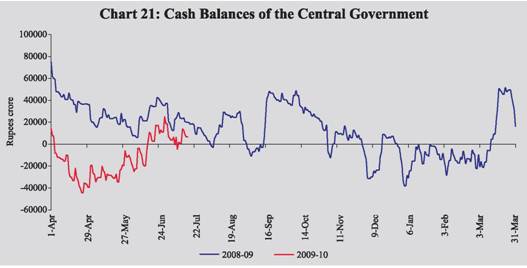
Liquidity Conditions V.10 Against the backdrop of global and domestic developments, the Reserve Bank carried forward its stance of maintaining comfortable liquidity in the system. The ample liquidity was also reflected in the large build up of reverse repo balances with the Reserve Bank. The policy rates were reduced further by 25 basis points in April 2009. Liquidity conditions eased significantly during Q1 of 2009-10, mainly reflecting the MSS unwinding, Open Market Operation (OMO) and decline in cash balances of the Central Government with the Reserve Bank, notwithstanding higher market borrowings. In order to ensure smooth government market borrowings, the Reserve Bank expressed its intention to purchase government securities amounting to Rs.80,000 crore under the OMO programme for the first half of 2009-10. Cash Management of the Government V.11 During 2009-10 (up to June 30), the Central Government took recourse to ways and means advances (WMA) and overdrafts (OD), while it was holding surplus cash balances all through the corresponding period of the previous year (Chart 21 and Table 36). This reflected, inter alia: (i) the lower level of outstanding surplus cash balance as at end-March 2009, and (ii) the increased drawdown of surplus cash balances by States during Q1 of 2009-10. The cash balance turned positive on June 16, 2009 on account of the quarterly advance tax inflows.
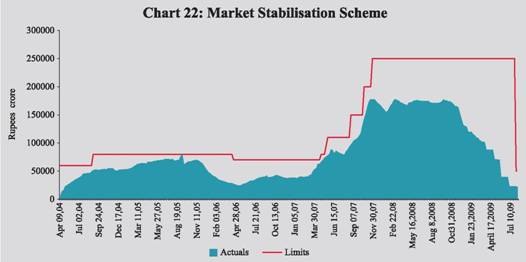
Liquidity Management V.12 The money market continued to witness further easing of liquidity during Q1 of 2009-10 mainly on account of: (i) MSS unwinding (around Rs.65,000 crore including de-sequestering of Rs.28,000 crore); (ii) OMO auction-based purchases (Rs.28,189 crore); and (iii) decline in Central Government cash balances (around Rs.3,400 crore) (Chart 22 and Table 37). The outstanding amount under the reverse repo window of the LAF peaked at Rs.1,45,770 crore during Q1 of 2009-10 (on May 8, 2009). The net absorption increased further to Rs.1,56,655 crore (both LAF and SLAF) on July 3, 2009. The liquidity availed under the foreign exchange swap facility and term repo facility generally declined during April-June 2009. The LAF rates, i.e., repo and reverse repo, were further reduced by 25 basis points effective from April 21, 2009 to 4.75 per cent and 3.25 per cent, respectively. V.13 On a review of the liquidity conditions, it was decided that only one LAF would be conducted with effect from May 6, 2009 and the second LAF would be conducted only on reporting Fridays. The average daily net absorption under the LAF continued to remain over Rs.1,00,000 crore during June 2009, notwithstanding advance tax collections around the middle of the month. During Q1 of 2009-10, the monetary easing continued in the form of OMO purchases and unwinding of MSS. Despite the large market borrowing programme, the surplus liquidity in the system was reflected in the large absorption through reverse repo (Table 38).
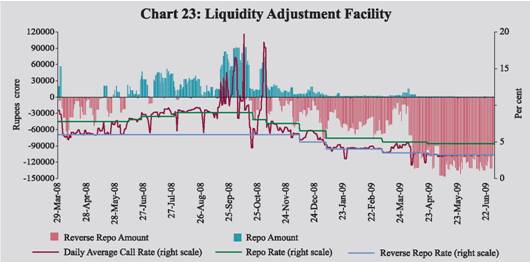
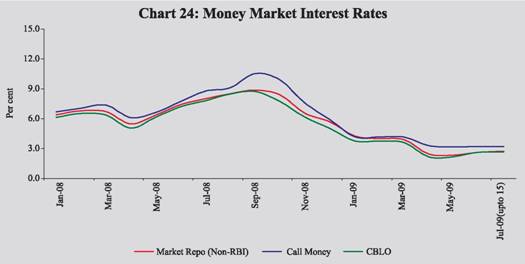
Money Market V.14 As before, the money market continued to remain orderly during Q1 of 2009-10. The call money rate began declining from the beginning of the quarter mainly due to significant easing of liquidity conditions on account of decline in government surplus, MSS unwinding and OMOs as well as reduction by 25 basis points in the LAF policy rates announced in April 2009. Thus, reflecting the surplus liquidity and lower policy rates, call rate continued to hover around the reverse repo rate during Q1 of 2009-10 at 3.2 per cent as compared with 4.2 per cent during the last quarter of 2008-09 (Chart 23). The average call rate was placed at 3.2 per cent for July 2009 (up to July 23). V.15 Interest rates in the collateralised segments of the money market - the market repo (outside the LAF) and the collateralised borrowing and lending obligation (CBLO) – also moderated in tandem with the call rate during Q1 of 2009-10 and continued to remain below the call rate (Chart 24). The weighted average interest rate in the collateralised segment of the money market moderated further to 2.4 per cent during Q1 of 2009-10 from 3.8 per cent during Q4 of 2008-09. Transaction volumes in CBLO and market repo segments continued to remain at a relatively high level during Q1 of 2009-10. Around 75 per cent of the lending in the collateralised segment was contributed by the mutual funds, which reflected their enhanced lending capacity. The collateralised market remained the predominant segment of the money market, and accounted for more than 80 per cent of the total volume in the money market.
Certificates of Deposit V.16 The certificates of deposit (CDs) issued by SCBs, which picked up momentum in Q4 of 2008-09, increased in Q1 of 2009-10, reflecting the general improvement in liquidity with the investors such as mutual funds and financial institutions. The outstanding amount of CDs as on June 19, 2009 accounted for 7.4 per cent of total aggregate deposits of the issuing banks. The overall weighted average discount rate (WADR) of CDs moderated by about 260 basis points between March and June 2009 in line with the other money market rates (Table 39). Commercial Paper V.17 The volume in the CP market increased significantly from its lowest levels in December 2008, with a significant pick up in Q1 of 2009-10, reflecting the revival of demand for funds by the NBFCs and working capital demand by the corporates (Tables 39 and 40). Mutual funds were the major investors in the CP market and the preferred tenor of CP issuances was 6 months to 1 year. Despite pick up in volumes, moderation in interest rates on CPs continued in Q1 of 2009-10, with a decline of 468 basis points over March 2009.
Treasury Bills V.18 The Treasury Bills, which were issued for enhanced amount in 2008-09 and were due for redemption, were rolled over in Q1 of 2009-10. On a review of cash position of the Government, the maturing amount was decided to be rolled over further till September 2009. The primary market yields softened during Q1 of 2009-10, reflecting the impact of policy rate cut in April 2009 and ample liquidity in the money market (Table 41).
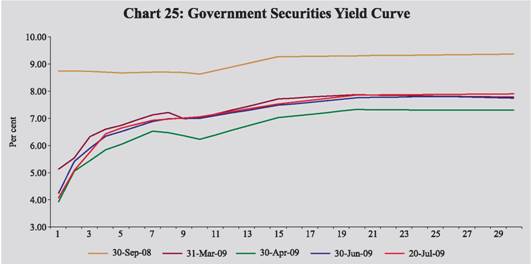
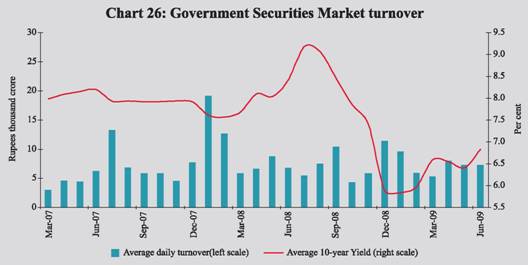
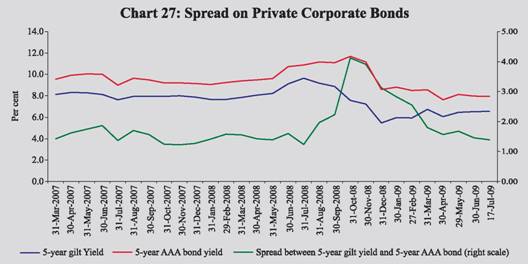
Government Securities Market Central Government Securities V.19 Gross and net issuances of dated securities of the Central Government during 2009-10 are budgeted to be higher by 65.2 per cent and 83.4 per cent, respectively over 2008-09. During 2009-10 (up to July 22), the Central Government completed a large part (44.2 per cent) of the budgeted borrowing programme (including amounts raised through additional borrowing and de-sequestering of MSS account). The ample liquidity available in the system facilitated the borrowings without putting much pressure on interest rates. In view of the expected increase in Government’s borrowing requirements, the market borrowing programme was front-loaded, as a result of which there were deviations from the amounts notified in the issuance calendar. In order to facilitate the Government’s higher financing requirements, on May 2, 2009, Rs 28,000 crore was de-sequestered from the MSS cash account and transferred to the normal cash account of the Central Government and an equivalent amount of government securities formed part of borrowing of the Government (Table 42). State Government Securities V.20 The allocation of market borrowings for seventeen State Governments received during 2009-10 (up to July 22, 2009) was placed at Rs. 49,883 crore. The Annual Policy Statement for 2009-10 has projected States’ net market borrowings at Rs.1,26,000 crore. During 2009-10 (up to July 22), despite higher borrowings, interest rate on the State Government securities moderated, reflecting the market liquidity (Table 42). Secondary Market V.21 During Q1 of 2009-10, yields in the government securities in the secondary market moderated initially, reflecting substantial easing of liquidity conditions, decline in inflation rate, OMO purchase auctions and reduction in LAF policy interest rates. The 10-year bond yield declined from 7.01 per cent to 6.23 per cent between end-March and end-April 2009. Thereafter, the bond yields, however, started rising following the increase in the size of primary auctions (from Rs.12,000 crore to Rs.15,000 crore) and subsequently on concerns of expected rise in Government market borrowings. The 10-year yield strengthened more than the short end maturity, indicating the expected pressure on interest rates (Chart 25). The turnover in government securities market also started showing signs of pick up in Q1 of 2009-10 (Chart 26). V.22 The yield curve is generally kinked at the 10-year tenor, reflecting the concentration of trading around that tenor but remains more or less flat beyond 15 years. The yields were generally higher by end-June 2009 as compared with end-April 2009. The daily turnover in the Central Government securities (based on number of trading days) averaged Rs.11,523 crore during Q1 of 2009-10, which was 7 per cent lower than that in the preceding quarter. V.23 The yield on 5-year AAA-rated corporate bonds, which witnessed a hardening trend during Q2 of 2008-09, softened significantly during the Q4 of 2008-09 and remained stable through Q1 of 2009-10 (Chart 27). The risk spread on corporate bonds fell to the level of pre-Lehman episode. Credit Markets V.24 The deposit rates of SCBs softened further during April-July 2009 (up to July 20). Interest rates on deposits moderated across the maturity spectrum for public sector banks (PSBs) and to a lesser extent in the case of private sector banks (Table 43). Benchmark prime lending rates (BPLRs) of PSBs and private sector banks declined by 25 to 50 basis points between March and June 2009. The moderation in the credit market rates was evident in the weighted average BPLR of PSBs declining by 38 basis points from 12.48 per cent in March 2009 to 12.10 per cent in June 2009. V.25 The share of sub-BPLR lending for all SCBs (excluding export credit and small loans) declined from 71.5 per cent in December 2008 to 66.7 per cent in March 2009. At the disaggregated level, under term loans, the major share of sub-BPLR lending of PSBs, private sector banks and foreign banks was for loans above 3 years, 5 years and up to 3 years, respectively.
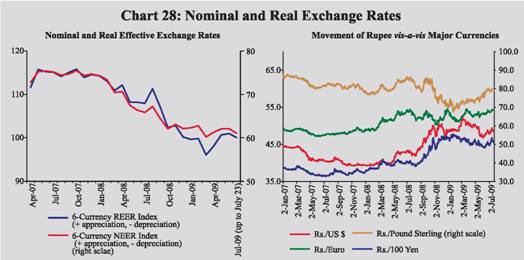
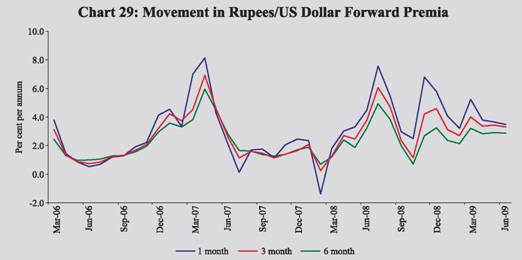
Foreign Exchange Market V.26 The rupee appreciated against the US dollar during Q1 of 2009-10 on the back of significant turnaround in FII inflows, continued inflows under FDI and NRI deposits, better than expected macroeconomic performance in Q4 of 2008-09 and weakening of the US dollar in the international markets (Chart 28). V.27 The average 6-currency trade-based REER (base: 1993-94=100) appreciated by 5.2 per cent between end-March and end-June 2009, mainly on account of appreciation of the rupee against the US dollar and increase in inflation differential between India and its trading partners (Chart 28). In terms of the broader measure, the 36-currency trade-based REER appreciated by 3.2 per cent between March and May 2009 (Table 44). V.28 During 2009-10 (up to July 27), forward premia generally exhibited declining trend, reflecting the easing supply conditions in the market led by revival of capital flows. The appreciation of the rupee against the US dollar on account of capital inflows, resulted in the narrowing down of the forward premia during the period. The spread between one-month and six-month premia also narrowed (Chart 29). The daily average turnover in the foreign exchange market started showing signs of improvement in May 2009. The ratio of inter-bank to merchant turnover increased to 3.1 during April-June 2009 from 2.6 a year ago (Chart 30). Equity Market V.29 While the primary market remained subdued in Q1 of 2009-10 as the domestic industrial activity appeared to be still sluggish, the secondary markets witnessed considerable gains on the back of stability and tentative signs of green shoots in the world economy, improved domestic growth prospects, forecast of near normal monsoon and greater political stability. The turnover of BSE and NSE in the cash segment during Q1 of 2009-10 increased significantly from Q4 of 2008-09. The market capitalisation of the BSE also increased by 53.9 per cent between end-March 2009 and end-June 2009. The turnover in the derivative segment of NSE also increased during April-June 2009. Although the volatility in the stock market during April-June 2009 was higher compared with the same period of last year, it moderated significantly over the preceding quarters (Table 45). 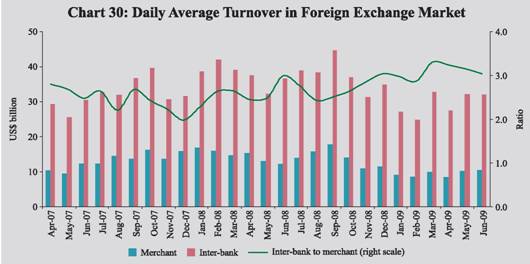 Primary Market V.30 The activity in the primary segment of the domestic capital market remained subdued during Q1 of 2009-10. Cumulatively, resources raised through public issues remained low during April-June 2009 with five issuances (Table 46). During April-June 2009, the resources raised through Euro issues by the Indian corporates also remained very small.
V.31 Mobilisation of resources through private placement declined by 5.3 per cent during 2008-09 as against an increase of 45.8 per cent during 2007-08. Resource mobilisation by financial intermediaries (both from public and private sector) registered a decline of 13.3 per cent, while the non-financial intermediaries registered an increase of 11.6 per cent during the same period.
V.32 During April-June 2009, net resource mobilisation by mutual funds increased considerably by 161 per cent with liquidity conditions remaining comfortable and stock markets witnessing considerable gains (Table 47). Scheme-wise, during April-June 2009, income/debt oriented schemes witnessed a net inflow of Rs.97,267 crore, while growth/equity oriented schemes registered a net inflow of Rs.3,305 crore.
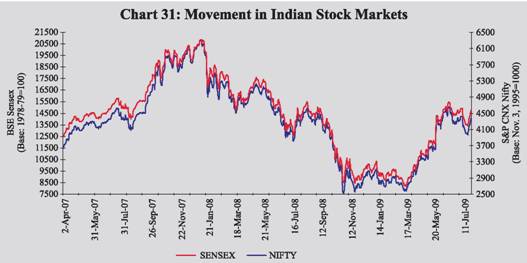
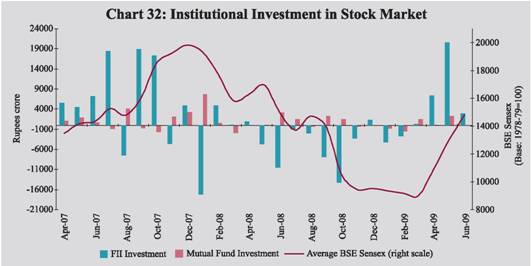
Secondary Market V.33 The market sentiment remained positive during Q1 of 2009-10 mainly on account of rebound in major international equity markets on the back of less than expected deterioration in economic activity and public policy actions, cut in policy rates by the Reserve Bank, better than expected growth of India’s GDP in Q4 of 2008-09, positive results for some Indian banks and corporates, forecast of near normal monsoon by the IMD, greater political stability after parliamentary elections and stock specific news. The domestic stock markets responded to the stability mandate in the Lok Sabha election results on May 18, 2009 by hitting the 20 per cent upper circuit barrier. As at end-June 2009, both the BSE Sensex and the S&P CNX Nifty registered gains of 49.3 per cent and 42.0 per cent, respectively, over end-March 2009 (Chart 31). V.34 Both FIIs and mutual funds resumed their interest in the stock markets in Q1 of 2009-10. According to the data released by the Securities and Exchange Board of India (SEBI), FIIs made net purchases US$ 6.4 billion in the Indian equity market during Q1 of 2009-10 as against net sales of US$ 3.5 billion a year ago (Chart 32). Mutual funds purchases in stock markets also increased during Q1 of 2009-10. V.35 The sectoral indices witnessed buying pressure across the board during Q1 of 2009-10 with rising investor interest. This resulted in significant gains in prices in sectors such as realty, capital goods, metal, banking, consumer durables, public sector undertakings, auto, IT, oil and gas, healthcare and fast moving consumer goods sector (Table 48). V.36 The stock markets, however, turned bearish following the presentation of the Union Budget 2009-10, and moved down reflecting disappointment with the Budget viz., increased gross fiscal deficit, lack of clarity on disinvestment of PSUs, raising of Minimum Alternate Tax (MAT) and also the unsatisfactory progress of the monsoon. Furthermore, international equity markets sank as uncertainty prevailed about company profits in the second quarter of 2009 and the likely forecasts for the rest of the year. The BSE Sensex which had registered an increase of 82.7 per cent by July 3, 2009 over March 9, 2009, declined by 10.1 per cent by July 13, 2009. The losses were subsequently recovered as markets rose on better corporate results for Q2 of 2009-10.
V.37 During Q1 of 2009-10, the Indian financial markets exhibited higher degree of confidence, investor risk appetite, narrowing of spreads and reduced volatility. Responding to the continued liquidity easing stance, the overnight rates moderated significantly and remained around the LAF reverse repo rate and spreads on CPs declined. The yield curve, however, moved up on concerns of large Government borrowing programme. The stock markets witnessed considerable gains on expectations of stabilisation in the world economy and better domestic fundamentals and political stability, but exhibited volatility in the post-Budget period due to factors such as high fiscal deficit, budget announcements falling short of investors’ expectations and unsatisfactory progress of the monsoon. |
|||||||||||||||||||||||||||||||||||||||||||||||||||||||||||||||||||||||||||||||||||||||||||||||||||||||||||||||||||||||||||||||||||||||||||||||||||||||||||||||||||||||||||||||||||||||||||||||||||||||||||||||||||||||||||||||||||||||||||||||||||||||||||||||||||||||||||||||||||||||||||||||||||||||||||||||||||||||||||||||||||||||||||||||||||||||||||||||||||||||||||||||||||||||||||||||||||||||||||||||||||||||||||||||||||||||||||||||||||||||||||||||||||||||||||||||||||||||||||||||||||||||||||||||||||||||||||||||||||||||||||||||||||||||||||||||||||||||||||||||||||||||||||||||||||||||||||||||||||||||||||||||||||||||||||||||||||||||||||||||||||||||||||||||||||||||||||||||||||||||||||||||||||||||||||||||||||||||||||||||||||||||||||||||||||||||||||||||||||||||||||||||||||||||||||||||||||||||||||||||||||||||||||||||||||||||||||||||||||||||||||||||||||||||||||||||||||||||||||||||||||||||||||||||||||||||||||||||||||||||||||||||||||||||||||||||||||||||||||||||||||||||||||||||||||||||||||||||||||||||

இந்த பக்கத்தை பகிரவும்:


இந்திய ரிசர்வ் வங்கி மொபைல் செயலியை நிறுவுங்கள் மற்றும் சமீபத்திய செய்திகளுக்கான விரைவான அணுகலை பெறுங்கள்!
எங்கள் செயலியை நிறுவ QR குறியீட்டை ஸ்கேன் செய்யவும்


கடைசியாக புதுப்பிக்கப்பட்ட பக்கம்:


