 IST,
IST,


Global Capital Flows and the Indian Economy: Opportunities and Challenges
Shri Deepak Mohanty, Executive Director, Reserve Bank of India
delivered-on ஜன. 30, 2012
I thank the Indian Institute of Technology, Kanpur and Shri Suyash Baderiya for this opportunity to interact with such a talented gathering of young minds. As you know, capital flows have played a major role in the process of globalization. While these flows bring several benefits, they pose certain risks. How in India we have handled this issue to enhance the sustainability of our external sector, is the topic of my deliberation today. Capital flows pose a puzzle both in theory and practice. On the one hand, they are credited with a key role in the development of the modern day economies by alleviating resource constraints and facilitating technology transfer. On the other hand, they are also blamed for several external debt and financial crises. Understanding the various facets of capital flows has been intellectually challenging as the reality runs counter to theory. For example, the neo-classical economic theory suggests that capital should flow from advanced countries that have relatively high capital-to-labor ratios (capital abundant countries) to developing countries that have relatively low capital-to-labor ratios (labor abundant countries). Paradoxically, capital often flows uphill from developing to advanced countries as was seen in the recent years. History of Private Capital Flows In the pre-First World War period spanning the 19th century and the early 20th century, London was the pre-eminent financial center, and many of today’s developed countries were developing then. This period saw a great expansion of private investment in developing countries, notably in the United States (US), Canada and Australia. It also stretched to Argentina, Brazil, Mexico and India. The capital flows to developing countries took two main forms: bond issues by various levels of public administration and foreign direct investment (FDI). In the interwar period, in the 1920s the US emerged as a major lender. Consequently, New York emerged as a key center for international lending up until the Great Depression of 1929. The interwar period was also marked by extensive defaults. Latin America was affected by the abrupt halt in foreign lending. In the immediate post-Second World War period there was virtually no borrowing by developing countries in the world capital market. Private portfolio investment and bank lending resumed only in the 1960s. By the 1980s, private capital flows had picked up substantially. This is the period when the Latin American debt crisis erupted reflecting macroeconomic imbalances arising out of high budget deficits and overvalued exchange rates. Later, the East Asian Economies were faced with a currency crisis in 1997 even though they had good macroeconomic fundamentals. The infirmity emanated primarily from huge short-term external borrowings by banks and corporates. A common thread running through the debt crises is that in almost all the episodes, waves of lendings were followed by a sudden stop or reversal of capital flows resulting in distress in the borrowing countries. What lessons did the Emerging and Developing Economies (EDEs) learn from these crises? Though gross capital flows to EDEs accelerated in the 2000s, but for the interruption in 2008 due to the global financial crisis, their external balance sheets showed greater resilience. This is reflected in changes in the components of international investment positions (IIPs) of major EDEs.1 The external liabilities of EDEs once were mainly debt. Now FDI and portfolio equity together dominate the stock of their liabilities (Table 1). The advantage of FDI and portfolio equity flows over pure debt flows is that there is risk sharing between the lender and borrower in the case of the former. Moreover, FDI flows tend to be more stable than other forms of capital flows. Another strength has been the increase in foreign exchange reserves in the overall external assets of EDEs. This has provided a counterweight to risk taking by the private sector. Of course, it is another debate as to how much of reserve is adequate and at what level benefits outweigh costs. But there is no disagreement that reserves provide inherent strength and stability to an economy, particularly EDEs.
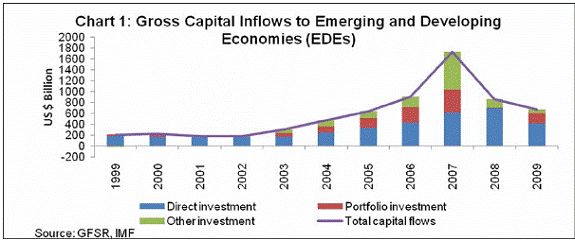
Capital Flows to EDEs Gross capital inflows to EDEs rose over eight fold from US $ 200 billion in 1999 to over US $ 1,700 billion in 2007, just before the crisis in 2008. While FDI increasing steadily remained the most stable component, the acceleration was dictated by portfolio and other investment. During the crisis the gross portfolio investment inflows to these economies dropped sharply from about US $ 420 billion in 2007 to a low of about US $ 10 billion in 2008 (Chart 1).
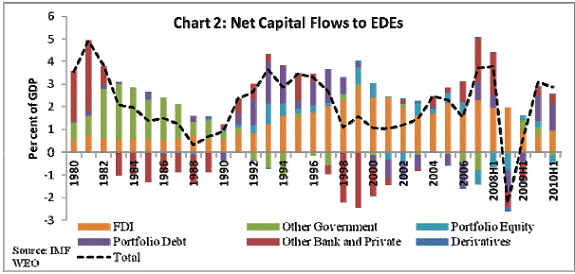
The long term trend in capital flows indicates that the peaks in capital flows are often followed by sudden fall. In the 2000s, net capital flows to EDEs peaked to 4 per cent of their GDP just before the global financial crisis in 2008 (Chart 2).
Determinants of Capital Flows The factors explaining international capital flows are categorized into “push” factors that are external to an economy, and “pull” factors that are internal to an economy. The push factors include parameters such as low interest rates in advanced economies, abundant liquidity, slow growth and the lack of domestic investment opportunities as also deregulation that has allowed greater global risk diversification in industrial countries. The pull factors include parameters such as the robust economic performance and the improved investment climate in EDEs, which are the results of a series of trade, financial and legal reforms. However, which factor would be dominant in a particular phase of the cycle is difficult to fathom. Benefits and Risks of Capital Flows In theory, free flow of capital across borders should lead to a more efficient allocation of resources between savers and investors across the world. Further, as the capital flows to capital scarce developing countries it brings along technical know-how and thus should increase growth in the recipient countries and help them to reduce the volatility in their consumption and investment in response to exogenous shocks. However, this position is not widely shared.2 While there is a broad agreement among economists on the desirability of open trade in goods, there is much disagreement with respect to the virtues of financial openness. Even strong proponents of free trade such as Jagdish Bhagwati have expressed skepticism about the gains from unfettered trade in financial assets. Prasad, Rajan and Subramanian (2007)3 find that among non-industrial countries, lesser reliance on foreign capital is associated with higher growth. Capital Controls The sudden reversal that the EDEs had to face during the crisis of 2008 despite their good fundamentals and improved external liabilities position brought to the fore various questions on capital controls again. Capital flows have interfered with the simultaneous management of fixed/managed exchange rate peg and inflation targets – a phenomenon known as Mundell’s ‘Impossible Trinity’. For EDEs with flexible exchange rates, volatility of the exchange rate and the loss of trade competitiveness prompts central banks to occasionally intervene in the foreign exchange market. This increases domestic liquidity with its inflationary consequences if left unsterilized. But sterilization has quasi-fiscal costs. Against this backdrop, the issue of capital controls, especially the imposition of financial transactions tax, some form of Tobin Tax, is being widely debated among policy makers in multilateral forums like the G-20, and the IMF as well as in academic circles. Significantly, the Bretton Woods institutions have relaxed their earlier position on capital controls. The IMF's own Independent Evaluation Office found that during the 1990s the Fund clearly encouraged capital account liberalization in its bilateral policy advice to member countries. The Fund’s multilateral surveillance also emphasized the benefits to developing countries of greater access to international capital flows. But following the 2008 crisis, in a policy note in February 2010 the IMF noted “circumstances in which capital controls can be a legitimate component of the policy response to surges in capital flows”. The World Bank also recognized that “capital controls might need to be imposed as a last resort to help mitigate a financial crisis and stabilize macroeconomic developments.” The G-20 recognised in October 2011 that “to maintain financial stability, capital controls may be adopted or reversed as destabilizing pressures abate”. Against this background, I now turn to evolution of our policy and experience with capital flows. Capital Account Management in India India’s capital account liberalization began in a substantive sense in 1991 following a severe balance of payments (BoP) crisis. The analytical foundations for reforms were provided by three reports: Report of the High Level Committee on Balance of Payments (Chairman: C. Rangarajan, 1991) and the two reports on Capital Account Convertibility (Chairman: S.S.Tarapore, 1997 and 2006). These reports, inter alia, suggested: (i) encouragement to private capital inflows; (ii) shift from debt creating to non-debt creating flows, (iii) a shift within the debt inflows from short-term to long-term debt, (iv) emphasized on monitoring of external commercial borrowings, and (v) gradual liberalisation of outflows. The capital account liberalization in India was considered as a process rather than an event. The sequencing of the process was conditional on underlying domestic macroeconomic fundamentals and sustainability of the BoP. Considerable progress has since been made as reflected in the volume and variety of capital flows without undermining the stability of our external account. India’s status with regard to capital account liberalisation could be seen in terms of its policy stance towards capital transactions by residents and non-residents on the one hand and by the underlying instruments of cross border flows on the other. Non-residents have been provided considerable extent of convertibility whereas permission to residents to undertake capital account transactions across borders is relatively restrained. Moreover, distinction is made not only between residents and non-residents but also between different categories of residents. Residents If residents are classified into corporates, financial institutions and individuals, the regime is most liberal in the case of corporates followed by financial intermediaries and individuals. Corporates and financial intermediaries are permitted to raise equity resources through American Depository Receipts (ADRs)/ Global Depository Receipts (GDRs) and are allowed to borrow through debt instruments from abroad. External Commercial Borrowings (ECBs) could be raised under both automatic and approval routes subject to quantity as well as price restrictions. Under automatic route, eligible borrowers in industry, infrastructure sector and NBFCs (excluding micro finance companies) can now borrow upto US $ 750 million in a year. For borrowing above this stipulation prior approval is required. There is an all-in-cost ceiling currently ranging between 350 basis points and 500 basis points over 6 month LIBOR for loans with minimum maturity of 3 years to more than 5 years. Banks can borrow upto 50 per cent of their unimpaired Tier I capital. Apart from inflows, corporates are allowed to invest abroad in overseas joint or wholly owned subsidiaries up to 400 per cent of their net worth. Banks can invest overseas up to 25 per cent out of their demand and time liabilities in India. Indian mutual funds can invest abroad within overall aggregate limit of US $ 7 billion. Individuals can remit an amount equivalent to US dollar 200,000 in a year under liberalized remittance scheme. Non-residents Non-resident corporates and financial intermediaries can invest in domestic companies and instruments across sectors subject to some instrument-wise and sector-wise conditions. For portfolio investment, they need to register themselves with the SEBI. Recently, Qualified Foreign Investors (QFI) including individuals and groups or associations have also been permitted to invest directly in the equity market in India after meeting the stipulated norms including Know Your Customer (KYC). Instruments In terms of instruments, inflows to India are subject to a hierarchy of preferences with direct investment preferred over portfolio flows, rupee denominated debt preferred over foreign currency debt and medium and long-term debt preferred over short-term debt. As regards, non-debt flows, the overall approach has been to substantially liberalise FDI flows so as to meet domestic investment requirements and raise growth potential of the economy. However, keeping in view socio-economic implications, FDI is prohibited in certain sectors, viz., lottery business, chit funds, nidhi companies, tobacco products, agriculture and plantation, and activities/sectors not open to private sector investment, e.g., atomic energy and railway transport other than mass rapid transport systems. Though FDI in multi-brand retail is not allowed, the Government is actively debating this issue. Apart from direct investment, non-residents can acquire equity stakes through portfolio investment as well. Portfolio investment could be made by the entities which are registered with the SEBI as Foreign Institutional Investors (FIIs). FIIs do not need prior approval as long as they are within the sectoral and individual limits. There are no restrictions on repatriation of equity investments. With regard to debt flows, policy levers comprise both quantity and price based prudential prescriptions. There is a ceiling on the extent of FII investment in sovereign debt (US $ 15 billion) and corporate debt (US $ 45 billion) and there is also a withholding tax. ECBs flows under both the automatic and approval routes are moderated by interest rate ceilings and those under the automatic route through an additional quantity ceiling. In addition, there are end use and minimum maturity restrictions of 3 years for ECB. However, trade credit is available for short-term with quantity and price restrictions. Foreign Currency denominated Non-Resident Indian (NRI) deposits are regulated through an interest rate ceiling linked to LIBOR/SWAP rate of the corresponding currency. However, rupee denominated NRI deposits have recently been deregulated with the condition that interest rate on those should not be more than the rate offered on domestic deposits of comparable maturities. There is no restriction on repatriation of NRI deposits. In sum, a gradual and calibrated liberalisation has progressively opened up India’s capital account with a preference for equity investment over debt. Now I turn to a review of trends in capital flows to India since the last BoP crisis of 1991. Trends in Capital Flows to India In the period leading up to the crisis, the capital account was dominated by debt creating flows. For example, in 1990-91, debt creating flows constituted about 97 per cent of capital inflows. In the debt creating flows, there was a large component of external assistance. However, this scenario changed substantially following the BoP crisis that triggered wide ranging reforms. The period since 1991-92 can be seen in three phases on the basis of our economic performance based on economic growth: Phase I (1992-93 to 2002-03) when India’s economic growth recovered from a low of 1.4 per cent in 1991-92 to an annual average of 5.8 per cent; Phase II (2003-04 to 2007-08) when India registered its highest average annual growth rate of 8.7 per cent; and Phase III (2008-09 to 2010-11), the most recent period following the global financial crisis which dented both India’s economic growth and volume of capital inflows (Table 2). How did capital flows behave during these phases? This is an issue I turn to next.
During the 11-year period 1992-2003, capital inflows to India resumed to an annual average of US $ 8.6 billion. There was a significant shift in favour of equity which accounted for over 54 per cent of capital inflows. Within equity, the FDI component was dominant. In the debt component, NRI deposits were dominant. During the 5-year period 2003-08, there was a sharp increase in capital inflows to an annual average of US $ 45 billion. The composition of inflows continued to be towards equity, though its share moderated slightly to 53 per cent. However, within equity there was a shift towards portfolio investment. The debt flows were dominated by trade credit and external commercial borrowings. During the recent 3-year period of 2008-11, net capital inflows moderated to an annual average of US $ 39 billion. The composition of capital inflows continued to be towards equity inflows with equal share between FDI and portfolio investment. The debt component was dominated by external commercial borrowings (Tables 3).
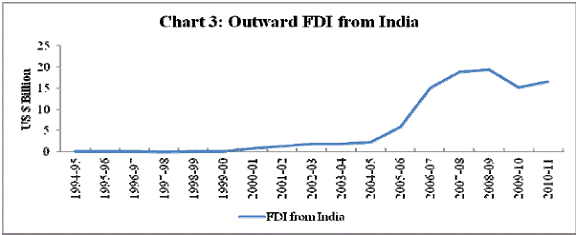
Another discernible trend that emerged since the mid-2000s is the sharp increase in India’s outward FDI suggesting increasing external orientation of the Indian corporates. India’s outward FDI peaked from US $ 2.2 billion in 2004-05 to US $ 19.4 billion in 2008-09 before moderating somewhat to US $ 16.5 billion in 2010-11 (Chart 3). This underscores maturing of India’s capital account liberalization process which has encouraged two-way flows. How did this rising trend and shift in composition of capital flows impact the BoP? This is an issue, I turn to next.
An inward looking Indian economy with a restrictive capital account regime, which was biased against equity inflows, was highly vulnerable to external shock. Hence, a widening of current account deficit (CAD) to 3.0 per cent of GDP in 1990-91 in the wake of the Gulf war and crude oil price spike was not clearly sustainable (Table 4). Prior to 1990-91 also India had periodically faced significant external financing constraints and went knocking at the doors of the IMF from time to time. Following the wide ranging reforms initiated in the 1990s, which encompassed both trade and financial liberalization, the resilience of the India’s external sector improved vastly.
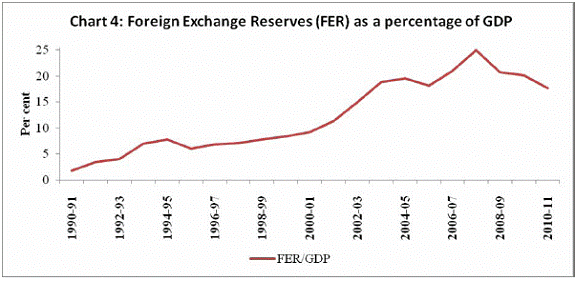
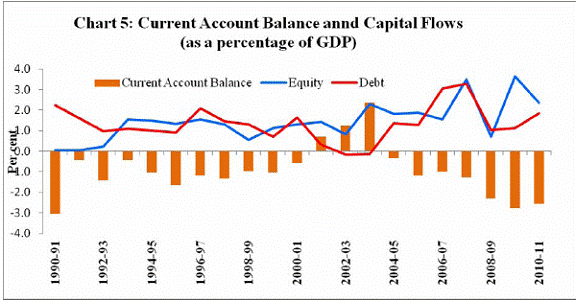
During 1992-2003, India’s current account showed a modest annual average deficit of 0.6 per cent. Given a capital account balance of 2.2 per cent of GDP, there was accumulation of foreign exchange reserve of 1.6 per cent of GDP per annum. In the following period, 2003-08, CAD improved to an average of 0.5 per cent. With a strong capital inflow of 5.1 per cent of GDP per annum, the pace of reserve accumulation rose to 4.6 per cent of GDP per annum. On the terminal year of this period, India’s foreign exchange reserves as a percentage of GDP peaked at 25 per cent at end-March 2008. (Chart 4) In the recent period of 2008-11, CAD expanded significantly averaging 2.6 per cent of GDP per annum (Table 4 & Chart 5). As capital inflows moderated simultaneously to 2.7 per cent of GDP per annum, there was only small accretion to reserves at the rate of 0.1 per cent of GDP per annum. Latest information suggests that CAD expanded to 3.6 per cent of GDP in the first half of 2011-12. As capital inflows fell short of CAD under current global financial stress, there was a drawdown of reserves.
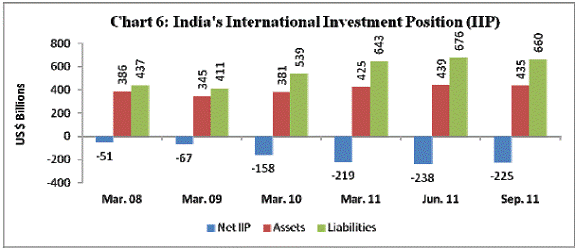
The foregoing discussion suggests that India has persistently registered current account deficit, since 1990-91 barring the three years, 2001-04. Though the average CAD was moderate for a long period, this has expanded since 2008-09. What does this imply? The persistent current account deficit accumulates into increasing claim of non-residents on India. This is captured in India’s international investment position (IIP) which delineates its external balance sheet. India’s international liabilities have remained higher than international assets and the difference between the two has increased significantly from US $ (-) 51 billion at end-March 2008 to US $ (-) 238 billion at end-June 2011 but improved slightly to $ (-) 225 billion at end-September 2011 (Chart 6). Our liabilities were mainly on account of portfolio investment, FDI and external commercial loans. The bulk of our international assets are in the form of foreign exchange reserve assets of the RBI, followed by direct investment abroad by the corporate sector.
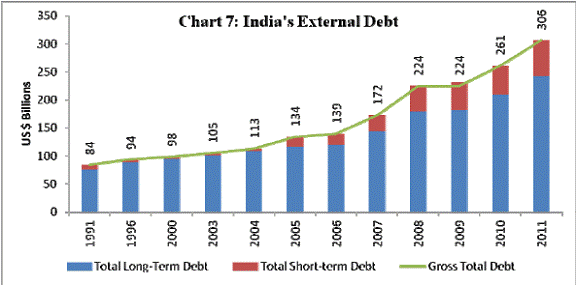
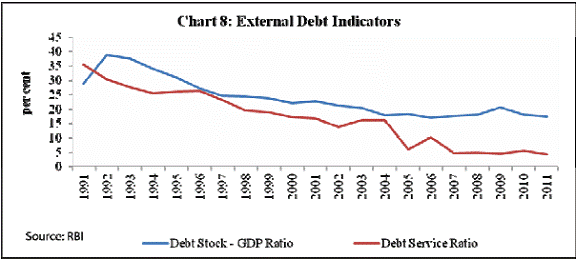
While IIP gives the full balance sheet picture, how has our external-debt position shaped, given our preference for non-debt creating flows? Notably, India’s external debt stock remained steady during the 13-year period between 1991 and 2003 in the range of US $ 84-105 billion. Since then, the debt stock has risen to US $ 306 billion by March 2011. However, the ratio of India’s external debt to GDP has declined over the years from 28.7 per cent in 1990-91 to 17.3 per cent in 2010-11. The debt service ratio declined from 35.3 per cent to 4.2 per cent during the same period.4 As regards the composition of external debt, there was a distinct decline in the share of government debt from 42.7 per cent of total external debt in March 2001 to 24.2 per cent by March 2011 with corresponding increase in private debt (Charts 7 & 8).
Although, India’s external debt service position has improved, recently in the wake of moderation in inflows amidst destabilized euro area financial turmoil some of our external vulnerability indicators have worsened. For example, reserves cover of total debt has fallen below 100 per cent (Table 5). Conclusions What key conclusions can we draw from a review of capital flows and our BoP developments over the past two decades since the crisis of 1991? First, global capital flows now increasingly show a two-way movement between EDEs and advanced economies. However, EDEs remain vulnerable to volatility and sudden stops in capital flows. This is because EDEs have limitation in borrowing in their own currencies in international capital markets, a phenomenon known as “original sin”. This is evident from the recent crisis. The epicenter of 2008 crisis was the US but capital flows to EDEs, including India, was severely affected. Now the epicenter has shifted to Europe but capital flows to EDEs continues to be impaired. Second, considerable lessons seem to have been learnt by EDEs from their past experience debt and currency crises, particularly from the Latin American debt crisis of the 1980s and the East Asian currency crisis of 1997. This has reinforced the hierarchy of capital flows with a preference by EDEs for equity flows. This is also reflected in a discernible shift in the composition of capital flows to EDEs in favour of equity, particularly FDI. Third, capital flows to EDEs depend on push factors emanating from low interest rate and lack of investment opportunity in advanced economies as well as by pull factors emanating from strong economic fundaments and growth prospects in the recipient country. Particularly, stable flows like FDI are guided more by pull factors. Fourth, availability of foreign capital is not an unmixed blessing. While it alleviates domestic resource constraints, it could also destabilize the economy in two ways: one, excess capital inflows could result in asset price inflation and loss of competitiveness through over valuation of exchange rate; two, sudden outflow on risk aversion could trigger a currency crisis. Fifth, the earlier dominant view was tilted towards unfettered capital movement. But, following the recent global financial crisis of 2008, there is explicit recognition – even by multilateral bodies such as the IMF, World Bank and the G20 – that capital controls may be desirable under certain circumstances. Sixth, India’s external sector policy had always believed in some form of management of our capital account with a preference for equity inflows, though there is now international recognition of this policy. This policy of cautious opening of the capital account has served us well as reflected in the stability of our BoP since the 1991 crisis. The composition of our capital account has shifted from almost entirely debt to predominantly equity. Seventh, notwithstanding relative stability of our BoP, some stress has developed post-2008 global financial crisis as capital inflows have moderated in the face of expanding current account deficit. This is reflected in worsening of some of the vulnerability indicators of the external sector. Our dependence on private capital inflows to finance our current account deficit has increased. Moreover, we have to factor in uncertainties in the global financial markets. These developments call for vigorous domestic policy reforms with a greater emphasis on trade competitiveness and energy security so as to enhance the pull factor for FDI to reinforce our BoP. Finally, in conclusion what advice can I give to such bright minds as yours? Like capital flows your talent knows no boundary. You are truly global citizens. While this provides an opportunity, it is also a challenge for you to unleash your creative potential to innovate for the global welfare. Thank you. * Speech by Shri Deepak Mohanty, Executive Director, Reserve Bank of India, delivered in Techkriti 2012 at the Indian Institute of Technology (IIT), Kanpur on 28th January 2012. The assistance provided by Rajiv Ranjan, Rajan Goyal, Somnath Sharma and Kumar Rishabh is acknowledged. 1The international investment position (IIP) is a country’s balance sheet in relation to the rest of the world, one side of which is its total foreign assets including official reserves and the other is its external liabilities. 2Cardoso, E.A., and R. Dornbusch, (1989) “Foreign Capital Flows” in H. Chenery and Srinivasan T.N. Handbook of Development Economics, volume 2, 1416-1439, Amsterdam: Elsevier Science Publishers. 3Prasad, Eswar S., Raghuram G. Rajan and Arvind Subramanian (2007). “Foreign Capital and Economic Growth”, Brookings Papers on Economic Activity. 4Debt service ratio, as measured by the proportion of total debt service payments to current receipts of balance of payments (BoP), is an indicator of debt sustainability. |
||||||||||||||||||||||||||||||||||||||||||||||||||||||||||||||||||||||||||||||||||||||||||||||||||||||||||||||||||||||||||||||||||||||||||||||||||||||||||||||||||||||||||||||||||||||||||||||||||||||||||||||||||||||||||||||||||||||||||||||||||||||||||||||||||||||||||||||||||||||||||||||||||||||||||||||||||||||||||||||||||||||||||||||||||||||||||||||||||||||||||||||||||||||||||||||||||||||||||||||||||||||||||||||||||||||||||||||||||||||||||||||||||||||||||||||||||||||||||||||||||||||||||||||||||||||||||||||||||||||||||||||||||||
கடைசியாக புதுப்பிக்கப்பட்ட பக்கம்:


