 IST,
IST,


Inflation Dynamics in India: Issues and Concerns
Shri Deepak Mohanty, Executive Director, Reserve Bank of India
delivered-on மார். 04, 2010
I thank the Bombay Chamber of Commerce and Industry for giving me this opportunity to speak on inflation which is of immediate concern for our economy. I will begin with the trends in inflation, then briefly touch upon the costs of inflation, followed by an analysis of current inflation dynamics. I will conclude by flagging the areas of policy concern. Trends in Inflation There are expectations that the high levels of slack in resource utilisation and stable inflation expectations will contain global inflationary pressures in 20101. The IMF projected the headline inflation in advanced economies at 1.3 per cent in 2010 and in emerging and developing economies at 6.2 per cent. In divergence with the global trend, India has witnessed a sharp increase in WPI inflation from a negative terrain during June-August 2009 to 9.9 per cent by February 2010. The increase in consumer prices are even higher in the range of 14.9 – 16.9 per cent (Table 1).
While there is this issue of divergence between wholesale price and consumer price based inflation measures, I do not propose to delve into that in this lecture2. I will, however, make two points. First, though the inflation indices have shown divergence in the past, the annual inflation based on the wholesale price index (WPI), consumer price index for industrial workers (CPI-IW), gross domestic product (GDP) deflator, and private final consumption expenditure (PFCE) deflator have, on an average, followed a similar path over long time spans (Table 2). Second, the current divergence could largely be attributed to different weightage of food in WPI and CPIs.
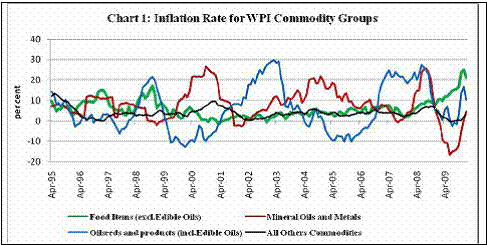
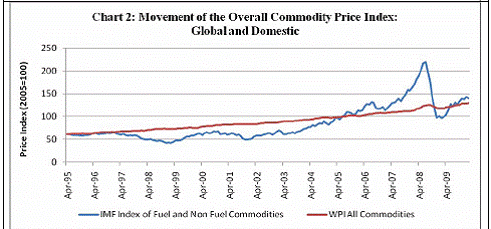
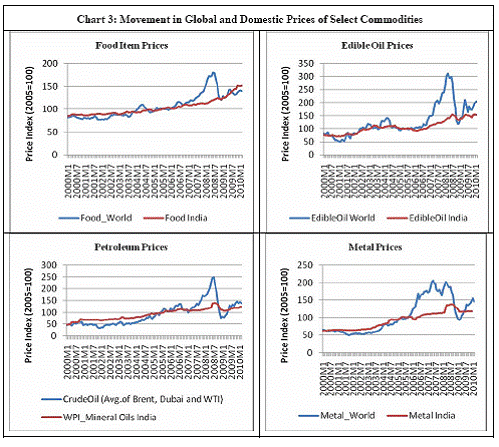
Costs of Inflation It is, however, important to recognise that by any measure the current inflation rate in India is high. Why is inflation a concern? It is a cause of concern for public policy because of the associated costs, especially when a large part of the population has no hedge against inflation. Milton Friedman famously said, “inflation is always and everywhere a monetary phenomenon.”3 It is believed that short-run inflation dynamics is largely dependent on supply-demand conditions and monetary expansion influences inflationary condition in the long-run. Monetary expansion could be caused by persistence of high fiscal deficit and the need to finance the same by monetisation. Consequently, high monetary growth could lead to continued excess demand for a prolonged period without matching increase in output and productivity. On the other hand, supply conditions have strong influence on the inflation dynamics in the short run. In a rapidly growing developing economy like ours, both structural and idiosyncratic factors could play a significant role in the determination of inflation. In the recent years, the inward looking nature of Indian economy has been changing. Activities in almost all the sectors in varying degrees are influenced by global factors, be it trade in commodities, provision of services, financing conditions, or consumer taste. Now domestic prices are more influenced by changes in global commodity prices for a wide range of goods – a sea change from the 1970s and 1980s when crude prices were major global influencing factors.Taking into account the influence of global and domestic factors, the overall WPI basket can be divided into four commodity groups which have differential behaviour (Chart 1). First, food items excluding oilseed products (weight in WPI: 24.2 per cent) : Prices of this group of commodities are largely determined by domestic factors and, in the event of supply shortage, imports influences international prices too. Second, oilseeds and products (weight in WPI: 6.8 per cent): This relatively small commodity group has often induced sudden surge in headline WPI as there is a structural shortage and nearly a third of domestic consumption of edible oils is met from imports. Third, mineral oils and metals (weight in WPI: 15.3 per cent): Prices of this group of commodities are largely determined by international prices and the volatility in headline WPI inflation in recent years can largely be attributed to fluctuations in the international prices. Fourth, other commodities (weight in WPI: 53.7 per cent): These remaining commodities, largely manufactured products, constitute more than half of the WPI basket and their prices have been more stable than the other three groups. Empirical evidence suggests that among the above four groups, there is transmission of prices from mineral oils and metals to the other commodities group within a quarter. The full transmissions of food prices to other commodities takes longer, almost a year. A comparison of domestic and global commodity price movement reveal the following. First, the direction of price movements has been similar, but the overall global commodity price movements have been more volatile, with a pronounced spike in 2007 and 2008 (Chart 2). Second, the increase in metal prices have been closely followed the global prices. Third, domestic prices of petroleum products have been less volatile than the corresponding international prices reflecting administered prices in this group. Fourth, increase in domestic food prices, excepting the global spike in 2007 and 2008 has been higher reflecting structural and domestic factors (Table 3).
Food prices in India are primarily determined by domestic demand supply factors and domestic price policy. India meets the bulk of its large food demand through domestic production, barring few commodities like edible oils and pulses where the import dependence is about 35 per cent and 15 per cent, respectively. In occasional shortage years, the country has also resorted to imports for wheat and sugar though it is generally an exporter in these commodities (Table 4). India’s occasional imports of such commodities translate into higher global food prices as the import demand is large. Hence, imports do not necessarily lead to domestic prices moving lower.
One important determinant of prices of agricultural production in India has been the minimum support price (MSP) announced by the Government for procurement of various commodities. The high increase in MSP since 2007-08 has given an upward bias to agricultural prices (Table 5).
Reduced availability of foodgrains also tends to keep food prices high. As per the Economic Survey 2009-10, per capita net availability per day of cereals and pulses has been lower than that observed in the previous four decades. The per capita daily availability of foodgrains was 447 grams in the 1960s and 1970s, which successively increased to 459 grams in the 1980s and 478 grams in the 1990s but came down to 446 grams during 2000-08 and stood still lower at 436 grams in 2008. Severe drought in major parts of the country during the current year has perceptibly worsened food availability further. In particular, the situation is far more worrisome for pulses: its per capita net availability per day has gone down from around 60-70 grams during the 1950s to around 30 grams currently. * Speech by Deepak Mohanty, Executive Director, Reserve Bank of India, delivered at the Bombay Chamber of Commerce and Industry, on 4th March, 2010. The assistance by Dr. O.P. Mall is acknowledged. 1 January 2010 update of the World Economic Outlook, International Monetary Fund (IMF) 2 For a detailed analysis of this, please see Deepak Mohanty (2010): “Measures of Inflation in India: Issues and Perspectives”, speech delivered at the Conference of Indian Association for Research in National Income and Wealth at the Centre for Development Studies (CDS), Thiruvanthapuram, on January 9. 3 Milton Friedman (1963): Inflation: Causes and Consequences , Asia Publishing House, New York |
|||||||||||||||||||||||||||||||||||||||||||||||||||||||||||||||||||||||||||||||||||||||||||||||||||||||||||||||||||||||||||||||||||||||||||||||||||||||||||||||||||||||||||||||||||||||||||||||||||||||||||||||||||||||||||||||||||||||||||||||||||||||||||||||||||||||||||||||||||||||||||||
கடைசியாக புதுப்பிக்கப்பட்ட பக்கம்:


