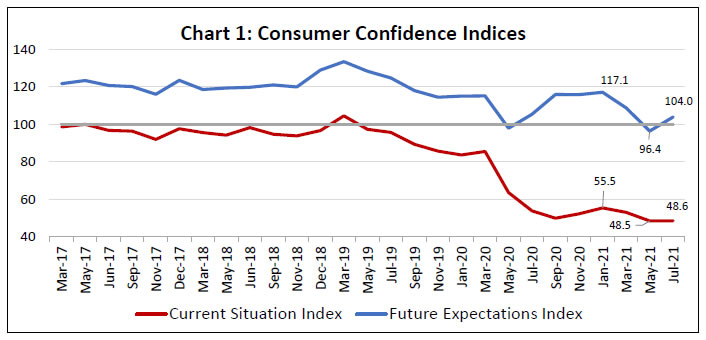
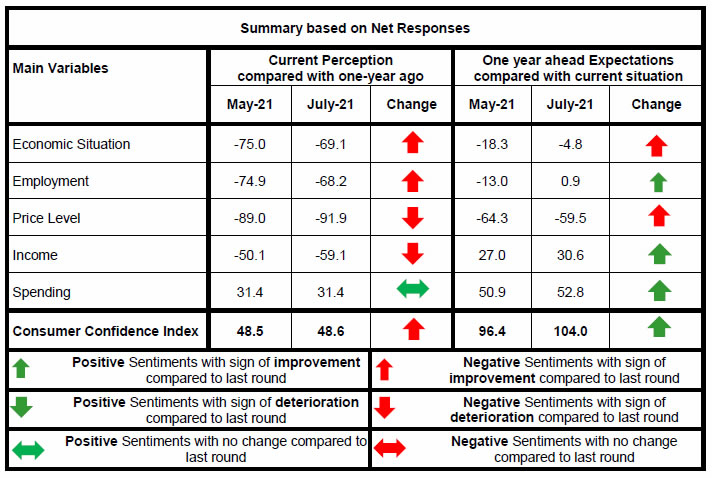
Today, the Reserve Bank released the results of the July 2021 round of its Consumer Confidence Survey (CCS)1. With the gradual withdrawal of COVID-19 related restrictions in most states, the survey was conducted through physical interviews, wherever possible, and telephonic interviews elsewhere, during June 28 to July 9, 2021 in 13 major cities, viz., Ahmedabad; Bengaluru; Bhopal; Chennai; Delhi; Guwahati; Hyderabad; Jaipur; Kolkata; Lucknow; Mumbai; Patna; and Thiruvananthapuram. Perceptions and expectations on general economic situation, employment scenario, overall price situation and own income and spending have been obtained from 5,384 households across these cities2. Highlights: I. Consumer confidence for the current period remained weak and the current situation index (CSI)3 stood around the all-time low level recorded in the previous survey round as most households reported lower incomes and higher level of price as compared to a year ago (Chart 1 and Tables 3 and 5). II. Driven by substantial improvements in the outlook for general economic situation and employment scenario after the waning of the second wave of the COVID-19 pandemic, the future expectations index (FEI) returned to optimistic territory; respondents placed higher confidence on household income going forward (Table 1 and 2). Note: Please see the excel file for time series data. The sentiments on overall spending remained unchanged as higher spending on essential items were offset by a drop in non-essential expenditure; consumers expect further contraction in discretionary expenditure in the year ahead (Tables 6, 7 and 8).
| Table 1: Perceptions and Expectations on the General Economic Situation | | (Percentage responses) | | Survey Round | Current Perception | One year ahead Expectation | | Improved | Remained Same | Worsened | Net Response | Will Improve | Will Remain Same | Will Worsen | Net Response | | Jul-20 | 11.9 | 10.3 | 77.8 | -65.9 | 44.3 | 13.5 | 42.2 | 2.1 | | Sep-20 | 9.0 | 11.4 | 79.6 | -70.6 | 50.1 | 15.1 | 34.8 | 15.3 | | Nov-20 | 11.0 | 11.5 | 77.5 | -66.5 | 50.9 | 13.9 | 35.2 | 15.7 | | Jan-21 | 14.3 | 13.6 | 72.2 | -57.9 | 52.6 | 16.1 | 31.3 | 21.3 | | Mar-21 | 12.1 | 11.9 | 76.0 | -63.9 | 44.0 | 17.3 | 38.7 | 5.3 | | May-21 | 6.5 | 12.1 | 81.4 | -75.0 | 33.2 | 15.3 | 51.5 | -18.3 | | Jul-21 | 9.4 | 12.1 | 78.5 | -69.1 | 39.7 | 15.8 | 44.5 | -4.8 |
| Table 2: Perceptions and Expectations on Employment | | (Percentage responses) | | Survey Round | Current Perception | One year ahead Expectation | | Improved | Remained Same | Worsened | Net Response | Will Improve | Will Remain Same | Will Worsen | Net Response | | Jul-20 | 13.0 | 8.9 | 78.1 | -65.1 | 48.6 | 13.3 | 38.2 | 10.4 | | Sep-20 | 10.1 | 8.1 | 81.7 | -71.6 | 54.1 | 14.3 | 31.6 | 22.5 | | Nov-20 | 11.0 | 9.5 | 79.5 | -68.5 | 52.0 | 14.9 | 33.1 | 18.9 | | Jan-21 | 13.1 | 11.5 | 75.4 | -62.3 | 55.3 | 16.1 | 28.6 | 26.7 | | Mar-21 | 12.9 | 11.8 | 75.3 | -62.4 | 46.7 | 17.3 | 36.0 | 10.7 | | May-21 | 7.2 | 10.8 | 82.1 | -74.9 | 35.4 | 16.1 | 48.5 | -13.0 | | Jul-21 | 10.3 | 11.3 | 78.4 | -68.2 | 42.2 | 16.5 | 41.3 | 0.9 |
| Table 3: Perceptions and Expectations on Price Level | | (Percentage responses) | | Survey Round | Current Perception | One year ahead Expectation | | Increased | Remained Same | Decreased | Net Response | Will Increase | Will Remain Same | Will Decrease | Net Response | | Jul-20 | 79.7 | 16.7 | 3.6 | -76.2 | 71.6 | 18.3 | 10.1 | -61.5 | | Sep-20 | 82.9 | 14.6 | 2.5 | -80.4 | 69.5 | 20.5 | 10.0 | -59.5 | | Nov-20 | 89.7 | 9.0 | 1.4 | -88.3 | 70.5 | 17.4 | 12.1 | -58.4 | | Jan-21 | 88.6 | 9.6 | 1.7 | -86.9 | 73.2 | 17.1 | 9.7 | -63.5 | | Mar-21 | 93.8 | 5.0 | 1.2 | -92.6 | 75.0 | 14.4 | 10.6 | -64.4 | | May-21 | 90.6 | 7.8 | 1.6 | -89.0 | 73.9 | 16.4 | 9.7 | -64.3 | | Jul-21 | 93.1 | 5.6 | 1.3 | -91.9 | 71.3 | 16.9 | 11.8 | -59.5 |
| Table 4: Perceptions and Expectations on Rate of Change in Price Level (Inflation)* | | (Percentage responses) | | Survey Round | Current Perception | One year ahead Expectation | | Increased | Remained Same | Decreased | Net Response | Will Increase | Will Remain Same | Will Decrease | Net Response | | Jul-20 | 79.8 | 15.6 | 4.5 | -75.3 | 76.4 | 18.6 | 5.0 | -71.4 | | Sep-20 | 83.0 | 13.1 | 3.9 | -79.1 | 75.9 | 19.6 | 4.6 | -71.3 | | Nov-20 | 88.3 | 8.9 | 2.8 | -85.5 | 78.3 | 16.7 | 4.9 | -73.4 | | Jan-21 | 83.5 | 13.4 | 3.1 | -80.4 | 77.7 | 17.2 | 5.0 | -72.7 | | Mar-21 | 88.8 | 8.5 | 2.7 | -86.1 | 81.1 | 14.3 | 4.5 | -76.6 | | May-21 | 87.2 | 10.3 | 2.5 | -84.7 | 79.3 | 16.7 | 4.0 | -75.3 | | Jul-21 | 87.9 | 10.4 | 1.7 | -86.3 | 79.7 | 16.3 | 4.0 | -75.8 | | *Applicable only for those respondents who felt price has increased/price will increase. |
| Table 5: Perceptions and Expectations on Income | | (Percentage responses) | | Survey Round | Current Perception | One year ahead Expectation | | Increased | Remained Same | Decreased | Net Response | Will Increase | Will Remain Same | Will Decrease | Net Response | | Jul-20 | 8.3 | 28.9 | 62.8 | -54.5 | 43.5 | 39.3 | 17.2 | 26.3 | | Sep-20 | 8.9 | 28.4 | 62.7 | -53.8 | 53.2 | 36.7 | 10.0 | 43.2 | | Nov-20 | 8.4 | 28.5 | 63.1 | -54.7 | 51.0 | 38.3 | 10.7 | 40.3 | | Jan-21 | 9.9 | 29.2 | 60.9 | -51.0 | 51.3 | 38.8 | 9.9 | 41.4 | | Mar-21 | 7.9 | 30.5 | 61.6 | -53.7 | 46.4 | 40.7 | 13.0 | 33.4 | | May-21 | 8.4 | 33.1 | 58.5 | -50.1 | 42.5 | 42.1 | 15.5 | 27.0 | | Jul-21 | 6.8 | 27.4 | 65.9 | -59.1 | 44.5 | 41.6 | 13.9 | 30.6 |
| Table 6: Perceptions and Expectations on Spending | | (Percentage responses) | | Survey Round | Current Perception | One year ahead Expectation | | Increased | Remained Same | Decreased | Net Response | Will Increase | Will Remain Same | Will Decrease | Net Response | | Jul-20 | 48.1 | 34.7 | 17.2 | 30.8 | 60.2 | 29.2 | 10.6 | 49.6 | | Sep-20 | 47.2 | 31.8 | 21.1 | 26.1 | 65.3 | 27.5 | 7.2 | 58.1 | | Nov-20 | 55.6 | 28.5 | 15.9 | 39.7 | 69.1 | 24.9 | 6.1 | 63.0 | | Jan-21 | 53.3 | 28.9 | 17.8 | 35.5 | 66.4 | 26.7 | 6.8 | 59.6 | | Mar-21 | 56.6 | 24.9 | 18.4 | 38.2 | 67.0 | 25.3 | 7.7 | 59.3 | | May-21 | 50.6 | 30.3 | 19.2 | 31.4 | 60.5 | 29.9 | 9.6 | 50.9 | | Jul-21 | 51.9 | 27.7 | 20.5 | 31.4 | 62.1 | 28.7 | 9.3 | 52.8 |
| Table 7: Perceptions and Expectations on Spending- Essential Items | | (Percentage responses) | | Survey Round | Current Perception | One year ahead Expectation | | Increased | Remained Same | Decreased | Net Response | Will Increase | Will Remain Same | Will Decrease | Net Response | | Jul-20 | 64.0 | 23.9 | 12.1 | 51.9 | 69.4 | 22.9 | 7.7 | 61.7 | | Sep-20 | 61.4 | 23.9 | 14.7 | 46.7 | 71.9 | 22.8 | 5.3 | 66.6 | | Nov-20 | 68.7 | 20.0 | 11.3 | 57.4 | 75.6 | 19.2 | 5.2 | 70.4 | | Jan-21 | 68.6 | 20.0 | 11.4 | 57.2 | 73.6 | 21.6 | 4.8 | 68.8 | | Mar-21 | 71.1 | 16.0 | 12.9 | 58.2 | 74.6 | 20.0 | 5.4 | 69.2 | | May-21 | 63.2 | 22.3 | 14.5 | 48.7 | 68.1 | 24.6 | 7.3 | 60.8 | | Jul-21 | 66.2 | 19.0 | 14.8 | 51.4 | 71.0 | 22.1 | 7.0 | 64.0 |
| Table 8: Perceptions and Expectations on Spending- Non-Essential Items | | (Percentage responses) | | Survey Round | Current Perception | One year ahead Expectation | | Increased | Remained Same | Decreased | Net Response | Will Increase | Will Remain Same | Will Decrease | Net Response | | Jul-20 | 9.2 | 29.4 | 61.4 | -52.2 | 22.2 | 37.9 | 39.9 | -17.7 | | Sep-20 | 10.7 | 29.5 | 59.8 | -49.1 | 31.3 | 37.4 | 31.4 | -0.1 | | Nov-20 | 11.2 | 27.9 | 60.9 | -49.7 | 28.7 | 37.3 | 34.0 | -5.3 | | Jan-21 | 13.3 | 27.1 | 59.7 | -46.4 | 27.5 | 36.7 | 35.8 | -8.3 | | Mar-21 | 11.9 | 29.5 | 58.5 | -46.6 | 24.7 | 38.3 | 37.1 | -12.4 | | May-21 | 8.7 | 31.5 | 59.7 | -51.0 | 22.2 | 40.7 | 37.1 | -14.9 | | Jul-21 | 8.4 | 27.2 | 64.4 | -56.0 | 21.5 | 37.9 | 40.6 | -19.2 |
|  IST,
IST,


