RbiSearchHeader

Press escape key to go back

Past Searches

Theme
Theme
Text Size
Text Size
S1

RbiAnnouncementWeb

RBI Announcements
RBI Announcements

சொத்து வெளியீட்டாளர்

83739987

Consumer Confidence Survey

Today, the Reserve Bank released the results of its Consumer Confidence Survey (CCS)1 for the January 2022 round. The survey was conducted during January 02 to January 11, 2022 in 13 major cities, viz., Ahmedabad; Bengaluru; Bhopal; Chennai; Delhi; Guwahati; Hyderabad; Jaipur; Kolkata; Lucknow; Mumbai; Patna; and Thiruvananthapuram. The survey obtained current perceptions (vis-à-vis a year ago) and one year ahead expectations on general economic situation, employment scenario, overall price situation and own income and spending from 5,387 households across these cities2.

Highlights:
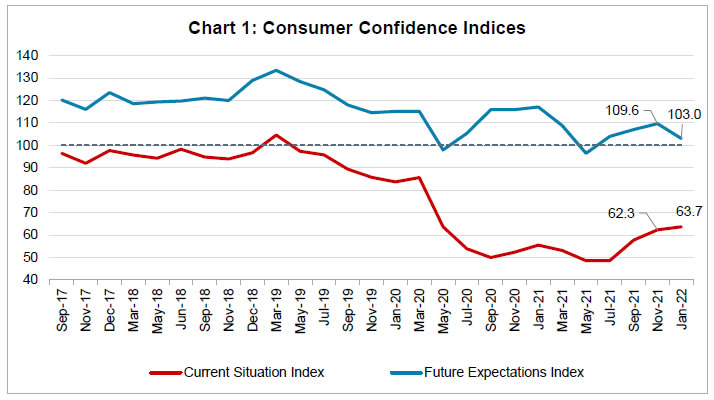
  1. Consumer confidence for the current period recorded gradual improvement for third successive round of the survey though it remained in pessimistic zone; the current situation index (CSI)3 increased marginally on the back of better sentiments on general economic situation, household income and spending (Chart 1 and Tables 1, 5 and 6).

  2. One year ahead outlook, as reflected by the future expectations index (FEI), remained in optimism zone; the index, however, moderated as the latest survey period coincided with the surge in COVID-19 infection cases in January 2022 (Chart 1 and Table 1).

  3. Households reported further increase in overall expenditure driven by higher essential spending; their sentiments on non-essential outlay, however, remained subdued (Tables 6, 7 and 8).

Chart 1

Note: Please see the excel file for time series data.
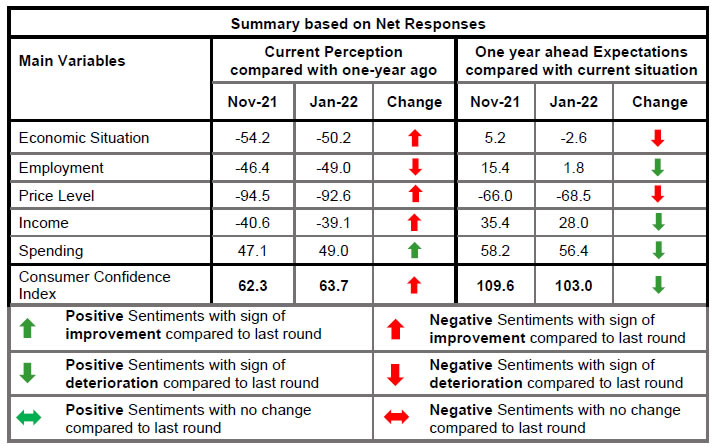
Chart 2

Table 1: Perceptions and Expectations on the General Economic Situation
(Percentage responses)
Survey Round Current Perception One year ahead Expectation
Improved Remained Same Worsened Net Response Will Improve Will Remain Same Will Worsen Net Response
Jan-21 14.3 13.6 72.2 -57.9 52.6 16.1 31.3 21.3
Mar-21 12.1 11.9 76.0 -63.9 44.0 17.3 38.7 5.3
May-21 6.5 12.1 81.4 -75.0 33.2 15.3 51.5 -18.3
Jul-21 9.4 12.1 78.5 -69.1 39.7 15.8 44.5 -4.8
Sep-21 14.9 12.9 72.3 -57.4 41.6 18.3 40.1 1.5
Nov-21 16.6 12.7 70.8 -54.2 43.9 17.4 38.7 5.2
Jan-22 17.4 15.1 67.5 -50.2 40.5 16.5 43.1 -2.6

Table 2: Perceptions and Expectations on Employment
(Percentage responses)
Survey Round Current Perception One year ahead Expectation
Improved Remained Same Worsened Net Response Will Improve Will Remain Same Will Worsen Net Response
Jan-21 13.1 11.5 75.4 -62.3 55.3 16.1 28.6 26.7
Mar-21 12.9 11.8 75.3 -62.4 46.7 17.3 36.0 10.7
May-21 7.2 10.8 82.1 -74.9 35.4 16.1 48.5 -13.0
Jul-21 10.3 11.3 78.4 -68.2 42.2 16.5 41.3 0.9
Sep-21 14.9 12.7 72.4 -57.6 45.0 17.8 37.1 7.9
Nov-21 18.8 16.0 65.2 -46.4 48.6 18.1 33.3 15.4
Jan-22 17.4 16.3 66.4 -49.0 41.4 19.1 39.6 1.8

Table 3: Perceptions and Expectations on Price Level
(Percentage responses)
Survey Round Current Perception One year ahead Expectation
Increased Remained Same Decreased Net Response Will Increase Will Remain Same Will Decrease Net Response
Jan-21 88.6 9.6 1.7 -86.9 73.2 17.1 9.7 -63.5
Mar-21 93.8 5.0 1.2 -92.6 75.0 14.4 10.6 -64.4
May-21 90.6 7.8 1.6 -89.0 73.9 16.4 9.7 -64.3
Jul-21 93.1 5.6 1.3 -91.9 71.3 16.9 11.8 -59.5
Sep-21 92.3 6.1 1.7 -90.6 74.7 15.0 10.3 -64.4
Nov-21 95.4 3.8 0.9 -94.5 76.5 12.9 10.6 -66.0
Jan-22 93.8 5.0 1.2 -92.6 78.0 12.4 9.5 -68.5

Table 4: Perceptions and Expectations on Rate of Change in Price Level (Inflation)*
(Percentage responses)
Survey Round Current Perception One year ahead Expectation
Increased Remained Same Decreased Net Response Will Increase Will Remain Same Will Decrease Net Response
Jan-21 83.5 13.4 3.1 -80.4 77.7 17.2 5.0 -72.7
Mar-21 88.8 8.5 2.7 -86.1 81.1 14.3 4.5 -76.6
May-21 87.2 10.3 2.5 -84.7 79.3 16.7 4.0 -75.3
Jul-21 87.9 10.4 1.7 -86.3 79.7 16.3 4.0 -75.8
Sep-21 88.4 9.0 2.6 -85.8 81.9 13.8 4.4 -77.5
Nov-21 91.3 6.7 2.0 -89.3 81.7 14.1 4.2 -77.5
Jan-22 89.1 8.1 2.8 -86.2 81.3 14.0 4.7 -76.6
*Applicable only for those respondents who felt price has increased/price will increase.

Table 5: Perceptions and Expectations on Income
(Percentage responses)
Survey Round Current Perception One year ahead Expectation
Increased Remained Same Decreased Net Response Will Increase Will Remain Same Will Decrease Net Response
Jan-21 9.9 29.2 60.9 -51.0 51.3 38.8 9.9 41.4
Mar-21 7.9 30.5 61.6 -53.7 46.4 40.7 13.0 33.4
May-21 8.4 33.1 58.5 -50.1 42.5 42.1 15.5 27.0
Jul-21 6.8 27.4 65.9 -59.1 44.5 41.6 13.9 30.6
Sep-21 10.4 31.4 58.2 -47.8 44.2 42.9 12.9 31.3
Nov-21 11.7 36.1 52.2 -40.6 46.7 42.0 11.3 35.4
Jan-22 11.5 37.9 50.6 -39.1 42.3 43.4 14.3 28.0

Table 6: Perceptions and Expectations on Spending
(Percentage responses)
Survey Round Current Perception One year ahead Expectation
Increased Remained Same Decreased Net Response Will Increase Will Remain Same Will Decrease Net Response
Jan-21 53.3 28.9 17.8 35.5 66.4 26.7 6.8 59.6
Mar-21 56.6 24.9 18.4 38.2 67.0 25.3 7.7 59.3
May-21 50.6 30.3 19.2 31.4 60.5 29.9 9.6 50.9
Jul-21 51.9 27.7 20.5 31.4 62.1 28.7 9.3 52.8
Sep-21 58.1 25.7 16.2 41.9 65.7 27.5 6.9 58.8
Nov-21 62.5 22.2 15.4 47.1 66.0 26.1 7.9 58.2
Jan-22 62.1 24.8 13.1 49.0 64.8 26.9 8.4 56.4

Table 7: Perceptions and Expectations on Spending- Essential Items
(Percentage responses)
Survey Round Current Perception One year ahead Expectation
Increased Remained Same Decreased Net Response Will Increase Will Remain Same Will Decrease Net Response
Jan-21 68.6 20.0 11.4 57.2 73.6 21.6 4.8 68.8
Mar-21 71.1 16.0 12.9 58.2 74.6 20.0 5.4 69.2
May-21 63.2 22.3 14.5 48.7 68.1 24.6 7.3 60.8
Jul-21 66.2 19.0 14.8 51.4 71.0 22.1 7.0 64.0
Sep-21 72.2 16.7 11.0 61.2 73.4 21.3 5.4 68.1
Nov-21 75.8 14.4 9.8 66.1 74.3 20.2 5.5 68.7
Jan-22 76.3 15.3 8.5 67.8 74.3 19.7 6.0 68.3

Table 8: Perceptions and Expectations on Spending- Non-Essential Items
(Percentage responses)
Survey Round Current Perception One year ahead Expectation
Increased Remained Same Decreased Net Response Will Increase Will Remain Same Will Decrease Net Response
Jan-21 13.3 27.1 59.7 -46.4 27.5 36.7 35.8 -8.3
Mar-21 11.9 29.5 58.5 -46.6 24.7 38.3 37.1 -12.4
May-21 8.7 31.5 59.7 -51.0 22.2 40.7 37.1 -14.9
Jul-21 8.4 27.2 64.4 -56.0 21.5 37.9 40.6 -19.2
Sep-21 9.2 29.7 61.0 -51.8 23.4 38.7 37.9 -14.5
Nov-21 12.1 27.7 60.3 -48.2 23.4 37.1 39.5 -16.1
Jan-22 13.6 31.6 54.8 -41.3 22.5 39.5 38.0 -15.5

1 The survey results reflect the respondents’ views, which are not necessarily shared by the Reserve Bank. Results of the previous survey round were released on the Bank’s website on December 08, 2021.

2 Unit-level data for previous rounds of the survey are available on the Database on Indian Economy (DBIE) portal of the Bank (weblink: https://dbie.rbi.org.in/DBIE/dbie.rbi?site=unitLevelData)

3 CSI and FEI are compiled on the basis of net responses on the economic situation, income, spending, employment and the price level for the current period (as compared with one year ago) and a year ahead, respectively. CSI and FEI = 100 + Average of Net Responses of the above parameters.

RbiTtsCommonUtility

प्ले हो रहा है
கேட்கவும்

Related Assets

RBI-Install-RBI-Content-Global

RbiSocialMediaUtility

இந்திய ரிசர்வ் வங்கி மொபைல் செயலியை நிறுவுங்கள் மற்றும் சமீபத்திய செய்திகளுக்கான விரைவான அணுகலை பெறுங்கள்!

Scan Your QR code to Install our app

RbiWasItHelpfulUtility

இந்த பக்கம் உதவியாக இருந்ததா?