RbiSearchHeader

Press escape key to go back

Past Searches

Theme
Theme
Text Size
Text Size
S2

RbiAnnouncementWeb

RBI Announcements
RBI Announcements

சொத்து வெளியீட்டாளர்

109260254

Households’ Inflation Expectations Survey

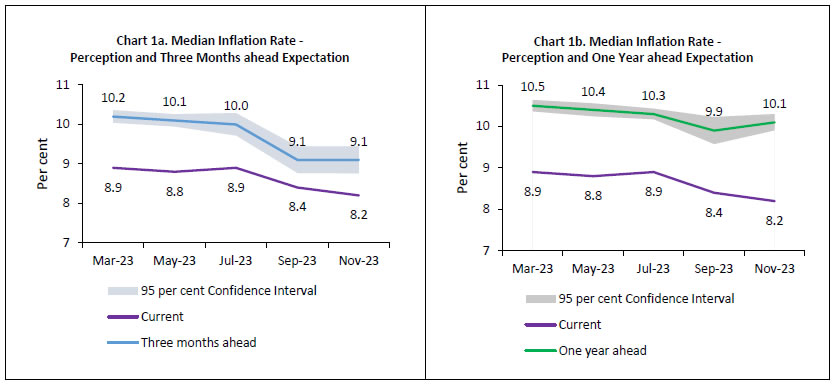
Today, the Reserve Bank released the results of November 2023 round of its bi-monthly inflation expectations survey of households (IESH)[1] 2. The survey was conducted during November 2-11, 2023 in 19 major cities, with responses from 6,036 urban households. Female respondents accounted for 50.1 per cent of this sample.

Highlights:    

  1. Households’ perception on current inflation declined by 20 basis points (bps) from the previous survey round to 8.2 per cent in November 2023 [Charts 1(a) and 1(b); Table 3].
  2. Median inflation expectation remained stable for the three months ahead period at 9.1 per cent, but it increased for one year horizon by 20 bps to 10.1 per cent in November 2023 [Charts 1(a) and 1(b); Table 3].
  3. Larger share of households expects higher inflation for both three months and one year ahead periods [Tables 1(a) and 1(b)].
  4. Households expect some rise in price and inflationary pressures across major product groups for the year ahead [Table 1(b)].
  5. Expectations regarding overall prices and inflation over the next three months were more aligned with those of food products and services; for the year ahead, such alignment is more pronounced with the prospects for food products and housing segments [Table 4].
Chart 1a. Median Inflation Rate -
Perception and Three Months ahead Expectation & Chart 1b. Median Inflation Rate -
Perception and One Year ahead Expectation

   Note:Please see the excel file for time series data.3   


  1. The survey is conducted at bi-monthly intervals by the Reserve Bank; it provides directional information on near-term inflationary pressures as expected by respondents and may reflect their own consumption patterns. Hence, survey results reflect respondents’ views, which are not necessarily shared by the Reserve Bank.
  2. All estimates of inflation expectations are given in the form of median, unless stated otherwise.    
  3. Results of the previous survey round were released on the Bank’s website on October 06, 2023.Unit-level data for previous rounds of the survey are available on the Bank’s ‘Database on Indian Economy’ (DBIE) portal (weblink: https://dbie.rbi.org.in/#/dbie/home) under the head ‘Unit-level Data’.

Table 1(a): Product-wise Expectations of Prices for Three Months ahead

(Percentage of Respondents)

Survey period ended

Nov-22

May-23

Jul-23

Sep-23

Nov-23

General

Estimate

SE

Estimate

SE

Estimate

SE

Estimate

SE

Estimate

SE

Prices will increase

83.8

0.76

81.2

0.82

80.8

0.86

74.2

0.97

74.1

0.93

Price increase more than current rate

58.5

1.13

59.7

1.08

55.3

1.20

49.5

1.10

50.8

1.13

Price increase similar to current rate

20.8

0.89

17.9

0.77

21.8

0.93

20.0

0.80

19.1

0.85

Price increase less than current rate

4.4

0.43

3.5

0.41

3.6

0.39

4.7

0.47

4.2

0.42

No changes in prices

13.7

0.69

15.7

0.77

16.1

0.79

20.7

0.88

21.2

0.88

Decline in prices

2.5

0.32

3.1

0.35

3.1

0.41

5.0

0.52

4.7

0.45

Food Product


Prices will increase

85.0

0.72

82.7

0.73

84.0

0.77

75.4

0.87

75.5

0.90

Price increase more than current rate

62.0

1.04

61.8

1.00

63.5

1.04

55.1

1.05

53.7

1.04

Price increase similar to current rate

17.2

0.76

16.2

0.71

15.5

0.72

15.1

0.71

16.1

0.74

Price increase less than current rate

5.9

0.48

4.7

0.42

5.0

0.44

5.3

0.46

5.8

0.47

No changes in prices

9.9

0.58

11.0

0.61

9.0

0.60

13.2

0.68

15.5

0.76

Decline in prices

5.1

0.44

6.3

0.48

7.0

0.54

11.3

0.66

9.0

0.57

Non- Food Product


Prices will increase

81.1

0.77

78.4

0.84

75.5

0.92

69.2

0.93

73.8

0.87

Price increase more than current rate

57.2

1.05

57.1

1.08

52.2

1.16

47.1

1.04

52.4

1.04

Price increase similar to current rate

17.9

0.78

16.6

0.70

18.4

0.80

16.7

0.72

16.1

0.72

Price increase less than current rate

6.0

0.48

4.6

0.43

4.9

0.43

5.4

0.51

5.3

0.46

No changes in prices

14.4

0.70

16.2

0.74

18.3

0.80

20.5

0.77

19.5

0.77

Decline in prices

4.5

0.43

5.4

0.45

6.2

0.54

10.3

0.66

6.7

0.48

Household Durables


Prices will increase

68.3

0.93

68.2

0.90

65.8

0.97

62.2

0.99

63.8

0.98

Price increase more than current rate

47.2

1.07

49.5

1.06

45.3

1.12

43.2

1.05

45.5

1.02

Price increase similar to current rate

16.0

0.75

14.8

0.67

15.8

0.75

14.1

0.65

13.4

0.68

Price increase less than current rate

5.1

0.43

3.9

0.38

4.6

0.41

4.9

0.43

4.9

0.43

No changes in prices

24.5

0.87

24.6

0.86

25.0

0.88

26.4

0.88

25.9

0.89

Decline in prices

7.3

0.49

7.2

0.51

9.2

0.60

11.3

0.64

10.3

0.59

Cost of Housing


Prices will increase

76.5

0.88

78.1

0.82

76.8

0.94

75.1

0.95

76.8

0.88

Price increase more than current rate

55.4

1.09

59.4

1.06

56.0

1.14

54.3

1.09

57.2

1.09

Price increase similar to current rate

16.8

0.75

15.1

0.74

17.0

0.75

16.3

0.66

15.5

0.72

Price increase less than current rate

4.3

0.41

3.7

0.35

3.7

0.35

4.5

0.43

4.1

0.37

No changes in prices

19.3

0.83

18.7

0.79

20.2

0.88

20.9

0.90

20.0

0.83

Decline in prices

4.2

0.40

3.2

0.36

3.0

0.37

4.1

0.46

3.2

0.36

Cost of Services


Prices will increase

70.6

0.89

70.6

0.89

67.7

0.97

63.0

1.04

63.3

0.96

Price increase more than current rate

49.1

1.04

51.3

1.00

47.3

1.13

44.7

1.05

43.7

1.09

Price increase similar to current rate

16.9

0.73

15.8

0.69

15.9

0.72

14.5

0.68

15.5

0.70

Price increase less than current rate

4.5

0.41

3.5

0.37

4.5

0.40

3.9

0.40

4.2

0.40

No changes in prices

26.6

0.88

26.2

0.87

28.2

0.90

31.2

0.99

31.5

0.93

Decline in prices

2.9

0.33

3.2

0.34

4.1

0.43

5.7

0.54

5.1

0.48

Note:

1. The table provides estimates and standard errors for qualitative responses.

2. Constituent items may not add up to the corresponding total, due to rounding off.

Table 1(b): Product-wise Expectations of Prices for One Year ahead

(Percentage of Respondents)

Survey period ended

Nov-22

May-23

Jul-23

Sep-23

Nov-23

General

Estimate

SE

Estimate

SE

Estimate

SE

Estimate

SE

Estimate

SE

Prices will increase

90.8

0.57

89.6

0.61

88.6

0.68

86.2

0.74

89.0

0.65

Price increase more than current rate

69.5

1.08

70.2

1.05

65.0

1.07

62.2

1.05

67.2

1.07

Price increase similar to current rate

18.2

0.87

16.7

0.77

20.5

0.86

19.9

0.81

18.4

0.87

Price increase less than current rate

3.1

0.34

2.7

0.32

3.1

0.33

4.1

0.43

3.4

0.38

No changes in prices

6.4

0.45

7.3

0.50

8.6

0.57

9.6

0.59

8.4

0.56

Decline in prices

2.8

0.33

3.1

0.35

2.8

0.35

4.2

0.48

2.7

0.35

Food Product


Prices will increase

87.1

0.64

86.9

0.66

84.7

0.75

82.8

0.80

86.1

0.71

Price increase more than current rate

62.9

1.07

64.6

0.99

60.6

1.11

57.9

1.09

63.2

1.06

Price increase similar to current rate

19.6

0.83

18.3

0.77

20.1

0.85

19.7

0.82

18.4

0.83

Price increase less than current rate

4.7

0.42

4.0

0.40

4.0

0.38

5.3

0.48

4.5

0.41

No changes in prices

7.8

0.50

8.0

0.51

9.3

0.59

9.6

0.58

8.8

0.56

Decline in prices

5.0

0.41

5.2

0.44

6.0

0.48

7.6

0.60

5.1

0.44

Non- Food Product


Prices will increase

85.0

0.71

84.1

0.72

81.6

0.85

78.9

0.83

82.6

0.78

Price increase more than current rate

60.7

1.09

62.0

1.05

57.1

1.16

54.7

1.05

60.7

1.09

Price increase similar to current rate

19.9

0.84

17.9

0.77

20.6

0.83

19.7

0.78

17.4

0.80

Price increase less than current rate

4.5

0.41

4.2

0.41

3.9

0.38

4.5

0.44

4.5

0.42

No changes in prices

10.1

0.58

11.1

0.61

13.5

0.72

13.9

0.66

12.9

0.65

Decline in prices

4.8

0.42

4.8

0.43

4.8

0.48

7.2

0.57

4.5

0.43

Household Durables


Prices will increase

77.6

0.84

76.9

0.83

75.8

0.88

73.9

0.91

75.5

0.89

Price increase more than current rate

55.0

1.09

57.0

1.07

53.2

1.10

52.4

1.04

55.3

1.07

Price increase similar to current rate

18.2

0.80

16.1

0.72

18.4

0.80

17.3

0.71

16.3

0.77

Price increase less than current rate

4.3

0.39

3.7

0.37

4.2

0.38

4.1

0.42

3.9

0.39

No changes in prices

16.4

0.72

16.7

0.71

17.7

0.76

18.5

0.76

17.7

0.76

Decline in prices

6.0

0.47

6.4

0.48

6.5

0.48

7.7

0.56

6.8

0.50

Cost of Housing


Prices will increase

86.5

0.69

87.9

0.63

86.8

0.69

86.1

0.70

87.9

0.68

Price increase more than current rate

64.4

1.04

67.4

1.00

64.6

1.05

65.0

1.04

68.5

1.02

Price increase similar to current rate

18.5

0.80

17.1

0.76

18.5

0.79

16.9

0.73

16.3

0.78

Price increase less than current rate

3.7

0.38

3.4

0.34

3.8

0.37

4.2

0.42

3.1

0.36

No changes in prices

10.2

0.59

9.1

0.54

10.4

0.60

10.1

0.56

9.4

0.61

Decline in prices

3.3

0.37

3.0

0.34

2.7

0.34

3.8

0.43

2.7

0.34

Cost of Services


Prices will increase

84.2

0.74

83.2

0.72

80.9

0.80

78.4

0.86

80.8

0.81

Price increase more than current rate

60.1

1.10

61.1

1.05

57.3

1.12

56.2

1.05

59.2

1.08

Price increase similar to current rate

19.8

0.83

18.2

0.81

19.6

0.83

18.0

0.70

17.6

0.80

Price increase less than current rate

4.3

0.39

3.9

0.36

4.0

0.39

4.2

0.43

4.0

0.40

No changes in prices

12.9

0.67

13.7

0.64

15.5

0.72

17.1

0.74

16.3

0.74

Decline in prices

2.9

0.33

3.1

0.34

3.5

0.37

4.4

0.48

2.9

0.36

Note:

1. The table provides estimates and standard errors for qualitative responses.

2. Constituent items may not add up to the corresponding total, due to rounding off.

Table 2: Inflation Expectations of Various Groups: Nov-23


Current Perception

Three Months ahead Expectation

One Year ahead Expectation

Mean

Median

Mean

Median

Mean

Median

Estimate

SE

Estimate

SE

Estimate

SE

Estimate

SE

Estimate

SE

Estimate

SE

Overall

8.9

0.09

8.2

0.12

9.7

0.09

9.1

0.18

9.6

0.10

10.1

0.10

Gender-wise


Male

9.0

0.13

8.2

0.15

9.8

0.13

9.0

0.20

9.5

0.15

9.8

0.24

Female

8.7

0.13

8.1

0.16

9.7

0.13

9.1

0.23

9.7

0.15

10.1

0.13

Category-wise


Financial Sector Employees

8.3

0.42

7.3

0.34

9.0

0.44

7.9

0.39

9.0

0.50

8.6

0.53

Other Employees

8.7

0.18

8.2

0.19

9.8

0.19

9.0

0.27

9.7

0.22

10.0

0.22

Self Employed

9.0

0.19

8.2

0.28

9.8

0.20

9.3

0.37

9.6

0.24

9.8

0.31

Homemaker

8.8

0.15

8.3

0.17

9.7

0.15

9.3

0.29

9.6

0.18

10.1

0.17

Retired Persons

10.2

0.36

9.9

0.65

10.9

0.34

10.5

0.44

9.9

0.44

10.1

0.43

Daily Workers

9.0

0.25

8.4

0.45

9.9

0.29

9.1

0.46

9.5

0.34

9.7

0.54

Other category

8.2

0.20

7.5

0.21

9.0

0.21

8.2

0.23

8.9

0.26

9.1

0.42

Age Group-wise


Up to 25 years

8.2

0.17

7.7

0.19

9.1

0.19

8.4

0.20

9.4

0.21

9.4

0.37

25 to 30 years

8.5

0.18

7.9

0.20

9.3

0.18

8.5

0.24

9.5

0.22

9.7

0.31

30 to 35 years

8.8

0.19

8.3

0.23

9.6

0.20

9.3

0.34

9.7

0.24

10.1

0.20

35 to 40 years

9.1

0.20

8.3

0.32

9.9

0.20

9.5

0.29

9.8

0.23

10.1

0.17

40 to 45 years

9.1

0.22

8.4

0.32

10.1

0.22

9.9

0.33

9.6

0.28

10.2

0.17

45 to 50 years

9.7

0.25

9.1

0.52

10.5

0.25

9.8

0.44

10.0

0.30

10.3

0.20

50 to 55 years

9.2

0.26

8.8

0.44

10.1

0.27

10.0

0.31

9.7

0.32

10.1

0.28

55 to 60 years

9.1

0.32

8.6

0.68

9.9

0.33

9.5

0.70

9.4

0.43

9.8

0.68

60 years and above

9.8

0.30

9.4

0.67

10.7

0.27

10.3

0.18

10.0

0.37

10.3

0.26

City-wise


Ahmedabad

7.2

0.20

6.5

0.23

7.9

0.25

7.2

0.26

7.2

0.30

7.4

0.25

Bengaluru

7.5

0.27

6.0

0.26

8.7

0.29

7.7

0.43

9.4

0.32

9.1

0.58

Bhopal

7.7

0.54

6.0

0.39

8.5

0.52

7.1

0.87

8.2

0.64

7.5

0.88

Bhubaneswar

9.9

0.92

9.9

1.00

11.5

0.85

11.6

1.49

11.0

0.85

11.4

1.90

Chennai

8.0

0.33

7.3

0.32

9.4

0.33

8.7

0.26

10.0

0.36

10.3

0.15

Delhi

10.1

0.25

10.2

0.18

10.8

0.24

10.5

0.18

10.4

0.28

10.6

0.28

Guwahati

8.6

0.68

8.3

0.93

9.0

0.67

8.8

0.87

9.6

0.67

9.7

0.77

Hyderabad

8.6

0.42

7.7

0.57

9.4

0.42

8.3

0.50

9.7

0.37

10.1

0.35

Jaipur

8.5

0.36

8.0

0.45

8.6

0.36

8.1

0.37

7.8

0.67

8.0

0.69

Jammu

9.9

0.59

9.8

0.89

8.5

0.99

7.6

1.03

8.1

0.61

7.2

0.71

Kolkata

10.2

0.30

10.1

0.32

11.2

0.28

10.7

0.39

11.3

0.31

11.3

0.73

Lucknow

9.3

0.49

8.6

0.76

9.8

0.47

9.2

0.70

9.3

0.43

9.3

0.66

Mumbai

8.9

0.22

8.3

0.18

9.8

0.23

9.5

0.38

9.3

0.27

10.1

0.29

Nagpur

8.9

0.47

8.2

0.70

10.3

0.45

9.9

0.45

10.4

0.56

10.6

0.31

Patna

7.7

0.31

7.5

0.39

8.0

0.35

7.9

0.34

7.9

0.46

8.0

0.30

Thiruvananthapuram

7.6

0.55

6.1

0.62

9.1

0.57

8.4

0.92

10.2

0.59

10.0

0.88

Chandigarh

9.7

0.85

9.5

0.86

9.8

0.96

9.7

1.31

8.7

0.98

9.3

1.55

Ranchi

8.9

0.33

8.3

0.33

9.2

0.32

8.8

0.43

9.6

0.46

10.1

0.44

Raipur

10.5

0.48

10.3

0.33

10.9

0.55

10.5

0.51

10.4

0.68

11.7

0.84

Note: The table provides estimates and standard errors for quantitative responses.

Table 3: Household Inflation Expectations – Current Perception, Three Months and One Year Ahead Expectations


Current Perception

Three Months ahead Expectation

One Year ahead Expectation

Mean

Median

Mean

Median

Mean

Median

Estimate

SE

Estimate

SE

Estimate

SE

Estimate

SE

Estimate

SE

Estimate

SE

Nov-22

10.0

0.10

9.8

0.23

10.9

0.10

10.4

0.07

10.8

0.11

10.8

0.08

May-23

9.3

0.09

8.8

0.13

10.3

0.10

10.1

0.08

10.2

0.11

10.4

0.08

Jul-23

9.3

0.09

8.9

0.14

10.2

0.09

10.0

0.15

10.0

0.11

10.3

0.07

Sep-23

9.0

0.09

8.4

0.11

9.7

0.09

9.1

0.17

9.3

0.11

9.9

0.17

Nov-23

8.9

0.09

8.2

0.12

9.7

0.09

9.1

0.18

9.6

0.10

10.1

0.10

Note: The table provides estimates and standard errors for quantitative responses.

Table 4: Households Expecting General Price Movements in Coherence with Movements in Price Expectations of Various Product Groups: Three Months Ahead and One Year Ahead

(Percentage of Respondents)

Survey period ended

Food

Non-Food

Households durables

Housing

Cost of services

Three Months Ahead

Nov-22

66.6

67.1

60.2

64.7

66.0

May-23

67.4

68.6

63.4

67.1

69.1

Jul-23

63.1

65.5

60.9

64.5

65.7

Sep-23

62.0

64.3

60.7

63.2

66.3

Nov-23

66.5

61.8

57.0

60.7

66.4

One Year Ahead

Nov-22

74.4

74.8

68.6

73.7

75.0

May-23

75.6

75.3

70.7

76.1

76.4

Jul-23

73.4

73.0

66.9

73.4

73.6

Sep-23

69.8

71.2

66.8

72.2

71.5

Nov-23

74.8

73.9

68.1

75.3

73.9

Note: Figures are based on sample observations

Table 5(a): Cross-tabulation of Number of Respondents by Current Inflation Perception and Three Months Ahead Inflation Expectations: Nov-23

Three Months Ahead Inflation Rate (per cent)

Current Inflation Rate (per cent)


<1

1-<2

2-<3

3-<4

4-<5

5-<6

6-<7

7-<8

8-<9

9-<10

10-<11

11-<12

12-<13

13-<14

14-<15

15-<16

>=16

No idea

Total

<1

7

0

0

0

0

2

0

0

0

0

0

0

0

0

0

0

0

1

10

1-<2

4

23

13

8

2

0

0

0

0

0

0

0

0

0

0

0

1

0

51

2-<3

0

14

78

58

44

10

1

2

0

0

1

0

0

0

0

0

0

2

210

3-<4

2

2

12

91

70

63

14

0

0

0

2

0

0

0

0

0

0

1

257

4-<5

0

1

9

7

143

87

33

6

8

3

4

0

0

0

0

0

0

0

301

5-<6

0

2

12

21

23

428

176

212

75

10

95

0

2

0

0

8

1

0

1065

6-<7

0

1

4

5

8

13

205

130

75

21

14

2

2

0

0

0

0

1

481

7-<8

0

0

3

2

2

11

14

247

167

60

56

1

4

0

0

1

0

0

568

8-<9

0

0

1

3

4

8

4

6

211

96

154

12

9

4

2

1

0

1

516

9-<10

0

0

0

1

0

1

1

3

4

104

69

17

12

2

2

2

0

1

219

10-<11

0

0

4

2

1

36

14

7

23

10

437

74

187

51

13

209

80

2

1150

11-<12

0

0

0

0

0

0

1

0

1

2

4

16

12

7

3

3

4

1

54

12-<13

0

0

0

1

1

1

2

0

2

1

3

0

45

10

17

24

5

1

113

13-<14

0

0

0

0

0

0

0

0

0

0

0

0

1

3

1

7

2

0

14

14-<15

0

0

0

0

0

0

0

0

0

0

1

0

0

0

9

1

4

0

15

15-<16

0

0

0

0

0

1

0

0

0

0

10

0

1

0

2

90

126

6

236

>=16

0

1

0

2

1

10

0

1

2

0

22

0

1

0

0

22

694

20

776

Total

13

44

136

201

299

671

465

614

568

307

872

122

276

77

49

368

917

37

6036

Note: Figures are based on sample observations

Table 5(b): Cross-tabulation of Number of Respondents by Current Inflation Perception and One Year Ahead Inflation Expectations: Nov-23

One Year Ahead Inflation Rate (per cent)

Current Inflation Rate (per cent)


<1

1-<2

2-<3

3-<4

4-<5

5-<6

6-<7

7-<8

8-<9

9-<10

10-<11

11-<12

12-<13

13-<14

14-<15

15-<16

>=16

No idea

Total

<1

5

1

1

0

0

1

2

0

0

0

0

0

0

0

0

0

0

0

10

1-<2

4

14

16

7

5

3

0

0

0

0

1

0

0

0

0

0

1

0

51

2-<3

27

5

43

33

47

34

9

2

3

0

4

0

1

0

0

1

0

1

210

3-<4

35

0

1

42

34

74

31

19

10

1

10

0

0

0

0

0

0

0

257

4-<5

51

0

0

6

65

55

58

20

26

2

14

1

0

0

0

1

1

1

301

5-<6

134

0

3

11

14

194

118

178

108

29

230

11

5

0

1

21

7

1

1065

6-<7

50

0

3

1

3

6

103

89

108

47

53

1

12

0

0

2

2

1

481

7-<8

75

0

1

0

0

2

7

112

115

80

135

4

15

4

3

15

0

0

568

8-<9

56

0

1

0

0

5

1

4

96

63

169

34

52

9

3

16

5

2

516

9-<10

18

0

0

0

1

0

1

0

1

40

65

31

44

4

6

5

2

1

219

10-<11

84

0

2

0

0

16

5

5

12

6

251

58

176

55

29

264

180

7

1150

11-<12

10

0

0

0

0

0

0

0

2

0

1

10

7

4

6

8

5

1

54

12-<13

12

0

0

0

0

0

1

1

2

1

0

1

22

12

12

32

16

1

113

13-<14

0

0

0

0

0

0

0

0

1

0

0

0

0

1

2

2

8

0

14

14-<15

6

0

0

0

0

0

0

0

0

0

1

0

0

0

1

1

6

0

15

15-<16

23

0

0

0

0

2

0

0

0

0

5

0

1

1

0

48

152

4

236

>=16

79

0

0

0

2

5

1

1

0

0

14

0

1

0

0

7

650

16

776

Total

669

20

71

100

171

397

337

431

484

269

953

151

336

90

63

423

1035

36

6036

Note: Figures are based on sample observations


RbiTtsCommonUtility

प्ले हो रहा है
கேட்கவும்

Related Assets

RBI-Install-RBI-Content-Global

RbiSocialMediaUtility

இந்திய ரிசர்வ் வங்கி மொபைல் செயலியை நிறுவுங்கள் மற்றும் சமீபத்திய செய்திகளுக்கான விரைவான அணுகலை பெறுங்கள்!

Scan Your QR code to Install our app

RbiWasItHelpfulUtility

இந்த பக்கம் உதவியாக இருந்ததா?