 IST,
IST,


Determinants of WADR for Commercial Paper: An Empirical Analysis for India
Saurabh Ghosh and Narayan Chandra Pradhan* This paper uses monthly real and financial sector variables over the last five years to analyse determinants of the weighted average discount rate (WADR) after taking into account the seasonal fluctuations in the CP issuances. The empirical results indicate that there have been increases in the 'average monthly issuances of CP', the WADR and 'volatility of WADR' over the years. The WADR was found to follow a weak seasonal pattern with higher rates during January to June. In the multivariate regression, the significant factors explaining movements in WADR were the call rate, cut-off yield of 364-day T-bills, incremental bank credit and the issue amount. JEL Classification : E44, E47, G31, G38. Introduction Commercial paper (CP) is an unsecured short-term promissory note issued by a corporation in the money market. The advantage with the CP is that it allows financially sound companies to meet their short-term financing needs at lower rates than that could be obtainable by borrowing directly from the banks. The main risk faced by a holder of CP is that the issuer will not be in a position to issue further paper upon maturity, but this risk kept low by the fact that most CPs are backed by the corporation's access to bank credit facilities (Pilbeam, 2005). In India, the CP was introduced as a money market instrument in 1990. Since then, there have been several changes for rationalising and standardising the CP issuance process in line with other money market instruments. As a result of such policy decisions, the amount * Authors are Assistant Adviser and Research Officer, respectively, in the Financial Markets Department, Reserve Bank of India, Central Office, Mumbai - 400001. Authors would like to thank Shri V.K. Sharma, Shri Chandan Sinha, Shri Somnath Chatterjee, Shri Himanshu Shekhar Mohanty and an anonymous referee for their valuable suggestions and comments. The views expressed here are those of the authors and not of the institution to which they belong. Other usual disclaimers apply. of CP outstanding has been more than double over the past three years, rising to around Rs.32,000 crore at the end of 2007-08 from Rs.14,000 crore at the end of 2004-05. This rapid growth has generated widespread interest in CP market in India. However, there have not been many studies on CP in general and analysis of weighted average discount rate (WADR) in particular. This paper attempts to fill this gap in the literature by analysing the major determinants of WADR of CP for an emerging market like India. In absence of much heterogeneity across the CP issuing companies in terms of their rating, this study uses monthly real and financial sector variables to analyse the WADR pattern after taking into account the seasonal fluctuations in the same. The rest of this paper is organised as follows: section II discusses the relevant international experience on the CP market. Section III summarises the developments in CP market for India. The data source and the variables that are considered for the analysis are described in section IV. While the empirical findings are analysed in section V, section VI concludes the paper. Section II In the beginning of the 1980s, issuance of CP was confined mainly to the United States, Australia and Canada. Since then, CP markets expanded to the European countries, Japan and rapid growth was observed in several emerging market economies. The CP markets across the world have been quite concentrated in terms of issue size (15 per cent of the issues accounting for around 50 per cent of the total outstanding amount). Generally, CP is rated by the rating agencies and these agencies typically regard alternative liquidity support as an important factor in determining the rating. In the CP market, particularly in the short maturity segment, secondary market activities are typically modest. In Japan, however, the secondary market in CP is buoyant owing to its extensive use. As regards to other characteristics, CP markets differ widely in terms of average size, placement and proportion with respect to other money market instruments across the countries. The literature has documented some evidences of cyclical and seasonal patterns in the CP market. Calomiris, et al (1994) examined the firm specific characteristics of the companies issuing CP and their empirical findings indicated that there was a positive relation between CP issuance and increase in firms' sales or earning. However, it also indicated that, the CP outstanding tends to increase during the economic slowdown. Downing and Oliner (2004) considered the seasonal fluctuation in CP using composite yield indexes from the actual market yields (between 1998 and 2004 for nearly all CP issued by the US corporation) and documented that term premia typically rise in the CP market at year-end, especially for lower-rated paper. Some of the plausible explanations for this year-end effect could be (a) 'window dressing' by institutional investors, who hold a substantial amount of CP, (b) a desire by issuers to insure against volatile interest rates and (c) the attendant increase in rollover risk around the year-end. Nippani and Pennathur (2004) examined the changes in the daily rates of CP over the past two decades and documented a ‘day of the week’ effect in its return. Their study documented a consistent and significant negative return on Wednesdays as compared to other weekdays over the sample period.Studies have also attempted to model the CP rate using different explanatory variables. Lackman et al (2004) attempted to forecast the CP rates by simulating the demand generated by each institution (e.g., households, life insurance companies, non-financial corporations and finance corporations) and their effect on CP rates. Covitz and Downing (2007), on the other hand, using dataset for US CP for the period 1998 to 2003 conducted regression of CP yield spreads after controleing for credit risk and liquidity. Their empirical finding indicated that while liquidity is an important determinant, the credit risk is the dominant determinant of CP credit spread. In the Indian context, there are not many studies on CP market. Among the available literature, a study by Shirai (2004) based on the 5,000 firm-level database found that high-quality firms, defined as those that are profitable, have access to the CP market and face relatively stable profitability compared to their non-profitable counterpart. Another study by Bandyopadhyay et al (2005) indicated that financial decisions by firms in the capital market (like issue of commercial paper and debentures etc.) could act as additional signals of firm specific qualities in the product market. Their study indicated that the total sales go up by 2.4 per cent for the top 50 business group firms and by 2.5 per cent for the non-top 50 firms with one standard deviation increase in CP as a fraction of assets. Section III Pursuant to the recommendations of the Committee to Review the Working of the Monetary System (Chairman: Prof. Sukhamoy Chakravarty, 1985) and the Report of the Working Group on the Money Market (Chairman: Shri N. Vaghul, 1987), a number of measures were taken by the Reserve Bank of India (RBI) to widen and deepen the money market through institution building and instrument development in the late 1980s. In the process, CP as a money market instrument was introduced on January 1, 1990. Since then, CP market has grown in size and provides another window to rated companies1 for raising funds for short term purposes. Major changes in CP issuances in India were effected in October 2000, when the organic link with working capital (fund based) limit was severed and CP was allowed to be issued as a stand alone product. At present, CP issuers should have minimum P2 credit rating of CRISIL2 or such equivalent rating by other agencies3. CP can be issued in dematerialised form through any of the depositories approved by and registered with SEBI4. Non-bank entities including corporates may provide guarantee for CP issuance subject to some prudential guidelines.
The issuances of CP have increased in recent period following the increasing investment interests seen from mutual funds and cost effectiveness in issuances of CP. Over and above, following various relaxations, (viz., eligibility criteria, denomination of CP, quantum of CP that could be issued against maximum permissible bank finance (MPBF) and maturity of CP) during the subsequent years, CP issuances gathered momentum. The minimum tenor has been brought down to 7 days in October 2004 in stages and the minimum size of the individual issue as well as individual investment has also been reduced to Rs.5 lakh with a view to aligning CP with other money market instruments. The limit of CP issuance was first carved out of the MPBF limit and subsequently attached only to its cash credit portion. (Table 1).
As mentioned earlier, CPs in India are privately placed instruments by highly rated corporate borrowers to diversify their sources of short term borrowings (minimum 7 days to maximum of up to 365 days) from the money market. Though it is usually an unsecured instrument, the issue has a backing of a specific asset of the issuer or may be guaranteed by a bank.
As per the latest guidelines of the RBI, a corporate would be eligible to issue CP provided, (i) the tangible net worth of the company, as per the latest audited balance sheet, is not less than Rs.4 crore; (ii) company has been sanctioned working capital limit by banks or all-India financial institutions; and (iii) the borrowal account of the company is classified as a standard asset by the financing banks or institutions.
Regarding ratings, although issuers with P2 credit rating of CRISIL or equivalent can raise resources through CP, in essence, the issuance is dominated by the prime-rated companies (i.e., companies having credit rating of P1+ or its equivalent). This could be largely on account of search for higher return by investors in an environment of substantial improvement in liquidity in the economy.Against this background, this study intends to analyse the trends and determinants in the WADR of CPs. There have been studies based on micro variables like rating of the company and its effect on WADR, after controlling for issue size, industry and seasonal patterns. However, one characteristic of the CP market in India has been a skewed pattern towards higher rating. Though, the minimum credit rating for CP is stipulated to be P2 of CRISIL or such equivalent rating by other agencies, around 80 per cent of the CP issued by companies over the last five years was from the 'prime-rated' companies. This limits the scope for such micro exercises evaluating the impact of heterogeneous rating on CP's WADR in India. Therefore, this study mainly concentrates on the macro determinants of the WADR and evaluates how they influnced the WADR movement over the last five years after controlling for the seasonal patterns. Section IV This paper concentrates on the monthly CP data for last five years (April 2002 to September 2007) and attempts to identify the determinants of WADR. The major data source for this study is the Handbook of Statistics on the Indian Economy and Macroeconomic and Monetary Developments published by the RBI. The other real and financial sector variables considered for this study are as follows:
The choice of these variables were guided by the demand and cost considerations underlying the CP market. On the demand side, IIP, BSE Sensex, bank credit and exchange rate were considered for overall economic activity. From the cost angle, the call rate (overnight and notice) was included as an indicator of overall liquidity in the system and the cut-off yield in respect of 364-day Treasury Bill was taken as a measure of benchmark risk-free interest rate of one-year duration (which is the maximum duration in case of CP). Trends in Amount Issued and WADR The trends in the amount of CP issued and the WADR during the period under consideration are set out in Chart 1 and Table 3. As evident from the above chart and table, the average monthly amount issued declined sharply by around 20 per cent in 2003-04 from the level in the previous year but then increased by relatively large margins in subsequent years. There have been marked fluctuations in the monthly amount of CP issued across the years, particularly during 2006-07 and 2007-08 so far, as reflected by the coefficient of variation. In tandem with the amount issued, the WADR declined from 6.93 per cent in 2002-03 to 5.29 per cent in 2003-04 and then increased steadily to as much as 8.94 per cent during 2007-08 (April-September). The firming up of WADR has been in line with the increases in policy rates during 2006-07 and early 2007-08. The variability in the WADR, though lower than that of the amount issued, has shown an increasing tendency since 2004-05. The relationship between the WADR and the identified 'explanatory' variables are set out in the Charts below. 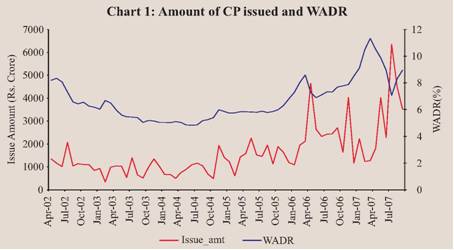
The following may be observed from the above charts: • A close co-movement between: (a) WADR and the call rate for the entire period (April 2002 to September 2007); (b) WADR and 364-day T-bill yield as also WADR and the BSE Sensex after December 2005 was evident. • No co-movement was evident between WADR and exchange rate; WADR and IIP (however, the peaks of WADR and IIP seem to coincide); and WADR and incremental bank credit. 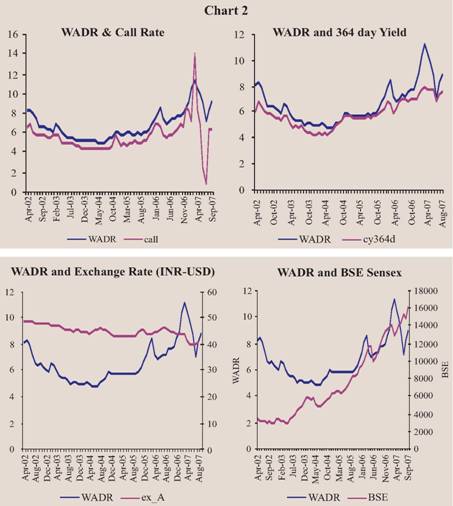 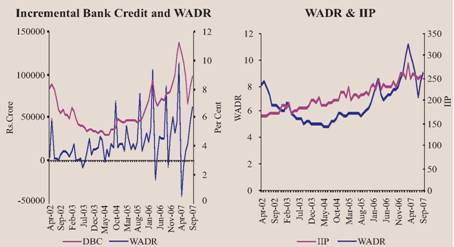 Section V Stationarity Tests Before proceeding to the test of overall relation between WADR and the explanatory variables, it is appropriate that all the series be tested for stationarity or the 'same statistical property' - means the series have to be differenced or de-trended by the same number of times to render them stationary. Accordingly, in order to test for the stationarity of the series, the Augmented Dickey Fuller (ADF) test was conducted. The ADF test showed that all the variables except the call rate were non-stationary. Correlation Analysis The co-movements of the macro variables with the WADR observed in the charts were confirmed statistically by a correlation analysis (Table 4). In view of the non-stationarity of the variables under consideration, the correlations were done using the variables in level as well as in differenced form.
Seasonality Analysis The literature has documented seasonal variations in the CP rates [Calomiris et al (1994); Downing and Oliner (2004)]. In an attempt to find the seasonal pattern in CP rates in India, WADR was regressed on monthly dummies. The coefficients of the dummy variables indicated a seasonal pattern as all the coefficients during February-June had positive values and those for July - December had negative values. This implied a seasonal increase in WADR during first half of the calendar year with the peak around February/March, followed by a reduction during the second part of the year with a trough during September/October. The seasonal pattern was, however, weak as none of these coefficients was statistically significant, indicating that the observed seasonal pattern varied across the years.
The chart 3 below plots the WADR series and seasonally adjusted (using X11 methodology) WADR over the last five years. Reflecting weak seasonality, the 'raw' and the 'seasonally adjusted' curves are fairly coincident, except during February and March in recent years. Multivariate Regression Analysis Finally, a multivariable regression of WADR on the explanatory variables was conducted. Since WADR and the macro variables (other than call) were found to be non-stationary, they were taken in differenced form. Although incremental bank credit was also found 
to be non-stationary, since the series was already in differenced form, a second round of differencing was avoided to minimise loss of information. The dummy variables for February and March were included in view of the seasonal fluctuations. Among several models estimated, the best models in terms of the fit (R2 and adjusted R2) and Durbin-Watson Statistics were chosen. The model that gave the best fit is as under:Among the explanatory variables, the call rate, differenced cutoff yield of 364-day Treasury Bills, differenced (incremental) bank credit and February dummy had positive and significant impact on differenced WADR. In other words, the month-over-month change in WADR is positively impacted upon by the call rate, the change in the cut-off yield of 364-day Treasury Bills and the (monthly) incremental bank credit. Apart from the influence of these factors, seasonality would impart an added 'push' to the change in WADR in the month of February. These results are on expected lines since an increase in the call rate and the 364-day Treasury bill rate reflect tighter liquidity conditions and thereby lead to an increase in WADR. An increase in bank credit (i.e. higher credit off-take) signifies a booming environment, in which corporates with prime ratings may be expected to avail the CP route in order to reduce their cost of capital to some extent. The coefficient of the log of the amount of CP issued had the expected negative (and significant) sign5. The trends in call, incremental bank credit and 364 days treasury yield have been showing a similar (increasing) movement as that in the WADR, which confirms robustness of the finding. The issue amount has also increased in recent years, which should have had dampening impact on the WADR in accordance with the findings. It appears, however, that the overall positive impact of the call, 364 days Treasury Bill yield and the incremental bank credit apart from the 'February' effect, have overwhelmed the negative effect of the issue amount on the WADR6.  5 The log of issue amount was found to be non-stationary at 10 per cent level of significance. The differenced amount issued series was found to be stationary. The log of the amount issued was, however, preferred to be included in the regression analysis to obviate loss of information.6 We have also included coefficient of variation of CP amount, INR-USD exchange rate (average for the month and the standard deviation). However, these variables were found to have insignificant coefficients and were therefore dropped in latter stage. Section VI Using last five years data (April 2002 to September 2007), this paper analyses the major determinants of WADR in the CP market in India. The empirical results indicate that there has been an increase in the average monthly issuance, WADR and volatility of WADR over the years. However, around 80 per cent of the CP issued by companies over the last five years was from the 'Prime-rated' companies. The 364 day treasry bill yield, the call rate and the IIP had positive and significant correlation with the WADR. The WADR was found to follow a weak seasonal pattern: during January to June, WADR generally remained higher followed by a decline during the rest of the year. In the multivariate regression, the significant factors explaining the movements in WADR were the call rate, cut-off yield of 364-day T-bills, incremental bank credit, the February dummy and the issue amount. The increase in call rate and cut-off yield represent tight liquidity conditions and, therefore, have a positive impact on the WADR. The issue amount, on the other hand, has a negative impact on WADR indicating large issues when the cost of fund raising through CP route is low. References: Bandyopadhyay, Arindam and S. K. Das (2005): “The Linkage between the Firm’s Financing Decisions and Real Market Performance: A Panel Study of Indian Corporate Sector”, Journal of Economics and Business, 57(4), 288-316. |
||||||||||||||||||||||||||||||||||||||||||||||||||||||||||||||||||||||||||||||||||||||||||||||||||||||||||||||||||||||||||||||||||||||||||||||||||||||||||||||||||||||||||||||||||||||||||||||||||||||||||||||||||||||||||||||||||||||||||||||||||||||||||||||||||||||||||||||||||||||||||||||||||||||||||||||||||||||||||||||||||||||||||||||||||||||||||||||||||||||||||||||||||||||||||||||||||||||||||||||||||||||||||||||||||||||||||||||||||||||||||||||||||||||||||||||||||||||||||||||||||||||||||||||||||||

ఈ పేజీని షేర్ చేయండి:


భారతీయ రిజర్వ్ బ్యాంక్ మొబైల్ అప్లికేషన్ను ఇన్స్టాల్ చేయండి మరియు తాజా వార్తలకు త్వరిత యాక్సెస్ పొందండి!
మా యాప్ను ఇన్స్టాల్ చేయడానికి QR కోడ్ను స్కాన్ చేయండి


పేజీ చివరిగా అప్డేట్ చేయబడిన తేదీ:


