RbiSearchHeader

Press escape key to go back

Past Searches

Theme
Theme
Text Size
Text Size
S2

Press Releases Marquee

RBI Announcements
RBI Announcements

RbiAnnouncementWeb

RBI Announcements
RBI Announcements

Asset Publisher

79638917

India’s External Debt as at the end of June 2008

As per the extant practice, India's external debt statistics for the quarters ending March and June are compiled and released by the Reserve Bank, while the external debt data for quarters ending September and December are compiled and released by the Ministry of Finance, Government of India. A detailed account of external debt as compiled in the standard format as at end-June 2008 in rupee and US dollar terms and revised data for earlier quarters are set out in Statement 1 and 2, respectively.

1. Stock of External Debt

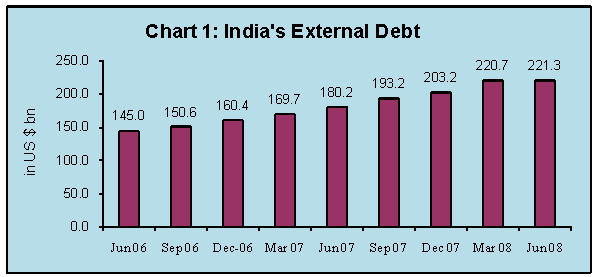
The external debt was placed at US $ 221.3 billion at the end of June 2008 as against US $ 220.7 billion at end-March 2008 recording an increase of US $ 0.6 billion or 0.3 per cent over the end-March 2008 level (Table 1 and Chart 1).

Table 1: External Debt Outstanding

(US $ billion)

At end of

Total
External Debt

Variation

Over corresponding  Quarter of Previous year

Over Previous
Quarter

Amount

Per cent

Amount

Per cent

(1)

(2)

(3)

(4)

(5)

(6)

March, 2006

138.1

  5.2

3.9

5.8

4.4

June,  2006

145.0

12.1

9.1

6.9

5.0

September,2006

150.6

13.8

10.1

5.6

3.9

December, 2006

160.4

28.0

21.2

9.7

6.5

March, 2007

169.7

31.5

22.8

9.3

5.8

June, 2007

180.2

35.2

24.2

10.5

6.2

September, 2007

193.2

42.6

28.3

13.0

7.2

December, 2007

203.2

42.8

26.7

10.0

5.2

March, 2008

220.7

51.1

30.1

17.5

8.6

June, 2008

221.3

41.1

22.8

0.6

0.3

Source: India’s External Debt: A Status Report, Government of India, August 2008; Reserve Bank of India.


2. Valuation Changes

The valuation effect reflecting the appreciation of the US dollar against other major international currencies and Indian rupee resulted in a decline in external debt by US $ 4.5 billion. This implies that excluding the valuation effects, the stock of external debt as at end-June 2008 increased by US $ 5.1 billion over the end-March 2008 level.

3. Components of External Debt

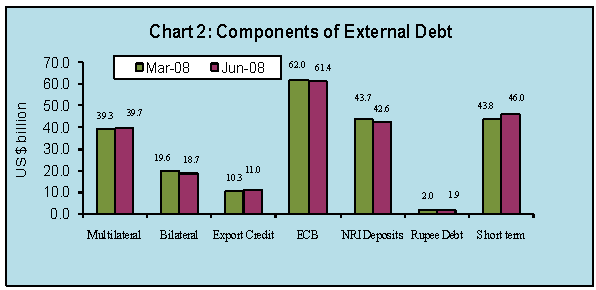
The rise in external debt stock was essentially due to increase in short term debt which rose by US $ 2.2 billion during the quarter. The data on short term debt include both suppliers’ credit up to and above 180 days and FII investment in Government debt papers. The rise in short-term debt was mainly on account of rise in trade credit (in particular, trade credits above 180 days) attributed to the higher financing of imports during the quarter.

Outstanding NRI deposits at US $ 42.6 billion as at end-June 2008 recorded a decline of US $ 1.1 billion over the level at end-March 2008. Despite inflows under NRI deposits during the quarter, the above decline in outstanding was mainly on account of valuation effect.

The movements in the other components of external debt as at end June 2008 revealed that while there was an increase in multilateral debt and export credit, commercial borrowings, bilateral debt and rupee debt showed decline (Table 2 and Chart 2).

Table 2: Variation in External Debt by Components


Item

External debt outstanding
at the end-of (US $ million)

Absolute variation
(US $ million)

Percentage variation
(per cent)

Mar 07

Mar 08

Jun 08

Mar 07 to
Mar 08

Mar 08
to
Jun 08

Mar 07 to
Mar 08

Mar 08
to
Jun 08

(1)

(2)

(3)

(4)

(5)

(6)

(7)

(8)

1. Multilateral

35,337
(20.8)

39,312
(17.8)

39,662
(17.9)

3,975

350

11.2

0.9


2. Bilateral

16,061
(9.5)

19,613
(8.9)

18,683
(8.4)

3,552

-930

22.1

-4.7


3. IMF

0
(0.0)

0
(0.0)

0
(0.0)

0

0

0.0

0.0


4. Export 
 Credit

7,051
(4.2)

10,267
(4.7)

11,004
(5.0)

3,216

737

45.6

7.2


5.Commercial
 Borrowings

41,657
(24.6)

62,019
(28.1)

61,458
(27.8)

20,362

-561

48.9

-0.9


6. NRI
 Deposits

41, 240
(24.3)

43,672
(19.8)

42,612
(19.3)

2,432

-1,060

5.9

-2.4


7. Rupee Debt

1,947
(1.1)

2,016
(0.9)

1,866
(0.8)

69

-150

3.5

-7.4


8. Short term
 Debt

26,376
(15.5)

43,820
(19.8)

46,018
(20.8)

17,444

2,198

66.1

5.0

Total Debt
(1 to 8)
169,669
(100.0)
220,719
(100.0)
221,303
(100.0)
51,050
584
30.1
0.3
Memo Items
A. Long-Term
 Debt
143,293
(84.5)
176,899
(80.2)
175,285
(79.2)
33,606
-1,614
23.5
-0.9

B. Short-Term
 Debt

26,376
(15.5)

43,820
(19.8)

46,018
(20.8)

17,444

2,198

66.1

5.0

Note: Figures in parentheses indicate share to total debt.

4.  External Debt by Residual Maturity

While external debt is generally compiled in terms of original maturity, analysing the external debt in terms of residual maturity is important from the point of view of forex liquidity management and to ascertain the total forex outgo on account of debt service payments in the immediate future. The ‘long term debt by residual maturity’ comprises the repayments due after one year under medium and long term debt by original maturity. On the other hand, the ‘short-term debt by residual maturity’ comprises the repayments due under medium and long-term debt by original maturity during one year reference period along with the short-term debt with original maturity. Based on residual maturity, out of total external debt of US $ 221.3 billion as at end-June 2008, long-term debt accounted for US $ 132.3 billion or 59.8 per cent. Short-term debt by residual maturity at end-June 2008 stood at US $ 89.0 billion accounting for 40.2 per cent of the total external debt. The ratio of short-term debt by residual maturity to foreign exchange reserves was 28.5 per cent at end-June 2008 (Table 3).

Table 3: Residual Maturity of External Debt outstanding as at end-June 2008

(US $ million)


Short term

Long term

Total

Components

Up to one year

1 to 2 years

2 to 3 years

More than 3 years

(2 to 5)

(1)

(2)

(3)

(4)

(5)

(6)

1.Sovereign Debt

2,780

3,211

4,613

44,600

55,204

2.Commercial Borrowing

7,403

7,383

10,501

52,858

78,145

(including export credit)


3.NRI deposits (i+ii+iii)

33,485

5,895

1,996

1,236

42,612

(i)  FCNR(B)

10,356

2,600

844

201

14,001

(ii) NR(E)RA

20,353

3,160

1,080

992

25,585

(iii) NRO

2,776

135

72

43

3,026

4.Short term debt

45,342

-

-

-

45,342

 (Original maturity)


Total (1 to 4)

89,010

16,489

17,110

98,694

221,303

Memo Items


 Short term debt
 (Residual maturity as
 per cent of total debt

40.2


 Short term debt
 (Residual maturity as
 per cent of Reserves)

28.5


Notes:  1. Residual Maturity of NRI Deposits is estimated on the basis of the Survey conducted by the Reserve Bank on NRI deposits outstanding as on March 31, 2008.

2. The maturity pattern of NRO Deposits that was not available in the March 31, 2007 survey is now available in the March 31, 2008 survey. The maturity-wise break up of NRO deposits are thus, given.

3. FII investment in treasury bills and government dated securities are included under sovereign debt, while FII investment in corporate debt papers and other short-term debt instruments are included under Commercial Borrowings.

5. Currency Composition

While the US dollar is generally used as the numeraire currency for computing external debt in order to facilitate international comparison, the currency composition of the external debt is essential to understand the currencies in which the debt is actually denominated and hence the extent of the economy’s vulnerability to solvency and liquidity risks. It also gives an idea of the extent of exposure of the economy to cross currency exchange rate movements. The currency composition of India’s external debt is generally disseminated in terms of major foreign currencies such as US dollars, Japanese yen, Euro, Pound Sterling, Special Drawing Rights (SDR) and the domestic currency i.e., Indian rupee.

In this regard, it is stated that while calculating currency composition, the short term trade credit was generally taken to be in dollars as most of it was denominated in US dollars. However, recognising the growing volume of such credits in the recent years on the back of burgeoning imports and the increasing significance of currencies other than US dollar in the short term credit, the original currency breakup of the short term trade credit above 180 days was computed for end-March 2008 and end-June 2008. It was observed that about 70 per cent of the short term trade credit is denominated in US dollars, 14 per cent in yen, 13 per cent in Euro and the balance in other currencies.

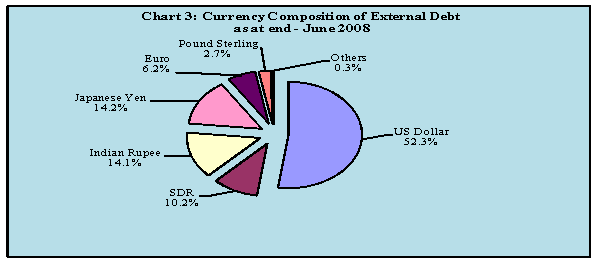
Looking at the overall external debt position, the US Dollar continues to remain the predominant currency accounting for 52.3 per cent of the total external debt stock as at the end of June 2008, followed by the Japanese yen (14.2  per cent), Indian rupee (14.1 per cent) and SDR (10.2 per cent) (Table 4 and Chart 3). The share of Euro has seen a rise from 4.0 per cent as at end-March 2007 to 6.2 per cent as at end-June 2008.

Table 4: Currency Composition of External Debt

(Percentage share in total external debt)
 
As at end March
As at end June

Currency

    2005

2006

2007

2008

2008

(1)

(2)

(3)

(4)

(5)

(6)

US Dollar

48.0

49.2

52.0

51.1

52.3

SDR

14.2

13.7

12.0

10.2

10.2

Indian Rupee

19.6

18.9

17.7

14.6

14.1

Japanese Yen

10.5

10.9

11.6

14.8

14.2

Euro

4.6

4.4

4.0

6.1

6.2

Pound Sterling

2.6

2.6

2.4

2.9

2.7

Others

0.5

0.3

0.3

0.3

0.3

Total

100.0

100.0

100.0

100.0

100.0

Notes: 1. Currency composition as at end-March 2008 and end-June 2008 incorporates the original currency composition of short term debt unlike in the previous years where the entire short term debt has been taken to be denominated in US dollars.

2. Currency composition of short term debt outstanding is estimated on the basis of the original currency composition of short term debt inflows during 2007-08.

6. Indicators of Debt Sustainability

The external debt sustainability indicators of India are set out in Table 5.

  • The share of concessional debt in total external debt declined to 19.3 per cent at end-June 2008 from 19.9 per cent at end-March 2008 reflecting the continuing increase in non-concessional private debt in India's external debt stock.
  • Reflecting the rise in short term debt during the quarter, the ratio of short-term to total debt and short term debt to reserves has risen to 20.8 per cent and 14.7 per cent at end June 2008 from 19.9 per cent and 14.1 per cent at end March 2008, respectively.
  • India’s foreign exchange reserves exceeded the external debt by US $ 90.8 billion providing a cover of 141.0 per cent to the external debt stock at the end of June 2008.
  • Based on the revised external debt outstanding as at end-March 2008, external debt to GDP is placed at 18.7 per cent at end-March 2008 as compared with 17.8 per cent at end-March 2007.
  • The debt service ratio is placed at 3.9 per cent during April-June 2008 as against 5.4 per cent during 2007-08 and a double-digit figure till 2003-04.

Table 5: India’s Key External Debt Indicators        

Year

External Debt
($ bn)

Ratio of External Debt to GDP
(%)

Debt Service Ratio
(%)

Ratio of Foreign Exchange Reserves to Total Debt
(%)

Ratio of Concessi-onal Debt to Total Debt
(%)

Ratio of Short-Term Debt to Foreign Exchange Reserves
(%)

Ratio of Short- Term Debt to Total Debt
(%)

(1)

(2)

(3)

(4)

(5)

(6)

(7)

(8)

1990-91

83.8

28.7

35.3

7.0

45.9

146.5

10.2

1991-92

85.3

38.7

30.2

10.8

44.8

76.7

8.3

1992-93

90.0

37.5

27.5

10.9

44.5

64.5

7.0

1993-94

92.7

33.8

25.4

20.8

44.4

18.8

3.9

1994-95

99.0

30.8

25.9

25.4

45.3

16.9

4.3

1995-96

93.7

27.0

26.2

23.1

44.7

23.2

5.4

1996-97

93.5

24.6

23.0

28.3

42.2

25.5

7.2

1997-98

93.5

24.3

19.5

31.4

39.5

17.2

5.4

1998-99

96.9

23.6

18.7

33.5

38.5

13.2

4.4

1999-00

98.3

22.0

17.1

38.7

38.9

10.3

4.0

2000-01

101.3

22.5

16.6

41.7

35.4

8.6

3.6

2001-02

98.8

21.1

13.7

54.7

35.9

5.1

2.8

2002-03

104.9

20.3

16.0*

72.5

36.8

6.1

4.5

2003-04

111.6

17.8

16.1**

101.2

36.1

3.9

4.0

2004-05

133.0

18.5

5.9^

106.4

30.9

12.5

13.3

2005-06

138.1

17.2

10.1#

109.8

28.6

12.9

14.1

2006-07

169.7

17.8

4.8

117.4

23.3

13.2

15.5

2007-08

220.7

18.7

5.4

140.3

19.9

14.1

19.9

Apr-Jun 2008

221.3

-

3.9

141.0

19.3

14.7

20.8

*  Works out to 12.4 %, with the exclusion of prepayment of external debt of US $ 3,430 million
** Works out to 8.2 % with the exclusion of pre payment of external debt of US $ 3,797 million and redemption of RIBs of US $ 5,549 million.
^ works out to 5.7 % with the exclusion of pre payment of external debt of US $ 381 million.
# works out to 6.4 % with the exclusion of IMD repayments of US $ 7.1 billion and pre payment of external debt of US $ 23.5 million.

In absolute terms, the debt service payments amounted to US $ 3.2 billion during April-June 2008 (Table 6). During the quarter, around 62.4 per cent of debt service payments, inclusive of principal and interest, were on account of ECBs followed by 25.7 per cent in respect of external assistance.

Table 6: India’s External Debt Service Payments

 (US $ million)
Item

1990-91

2000-01

2003-04

2004-05

2005-06

2006-07

    2007-08

2008-09*

(1)

(2)

(3)

(4)

(5)

(6)

(7)

(8)

(9)

1. External Assistance

2,315

3,444

6,983

2,855

2,652

2,904

3,241

816

Repayment

1,187

2,338

6,193

2,129

1,945

1,922

2,099

550

Interest

1,128

1,106

790

726

707

982

1,142

266

2. External Commercial


Borrowings

3,414

7,073

10,164

4,530

14,839

6,819

11,317

1,978

Repayment

2,004

5,378

8,045

3,571

11,824

4,236

6,119

1,030

Interest

1,410

1,695

2,119

959

3,015

2,583

5,198

948

3. I.M.F.

778

26

0

0

0

0

0

0

Repayment

644

26

0

0

0

0

0

0

Interest

134

0

0

0

0

0

0

0

4. NRI Deposits
Interest

1,282

1,661

1,642

1,353

1,497

1,969

1,813

348

5. Rupee Debt Services
Repayment

1,193

617

376

417

572

162

121

30

6. Total Debt Service
 (1 to 5)

8,982

12,821

19,165

9,155

19,560

11,854

16,492

3,172

Repayment

5,028

8,359

14,614

6,117

14,341

6,320

8,339

1,610

Interest

3,954

4,462

4,551

3,038

5,219

5,534

8,153

1,562

7. Current Receipts #

25,479

77,467

119,239

154,123

194,170

242,519

302,964

81,282

8. Debt Service
Ratio  (6/7) ( %)

35.3

16.6

16.1

5.9

10.1

4.8

5.4

3.9

# Current Receipts Minus Official Transfers; *: April-June 2008.
Source: India’s External Debt: A Status Report, GoI, August 2008; Reserve Bank of India

7. Cross Country Comparison

Comparing the cross country data on external debt provided by the World Bank in the Global Development Finance, 2008 for the year 2006 for the top twenty debtor countries of the developing world reveal the following ( Table 7):
  • India’s position was fifthin 2006 in terms of external debt stock.

  • In terms of the ratio of external debt to Gross National Product (GNP), India’s position was second lowest, with China having the lowest ratio of external debt to GNP.

  • India’s debt service ratio was third lowest with China and Malaysia having first and second lowest debt service ratio, respectively.

  • The element of concessionality in India’s external debt portfolio was the second highest after Indonesia

  • In terms of reserves to total debt, India’s position was fifth after China, Malaysia, Thailand and Russia.

Table 7: International Comparison of Top 20 Debtor Countries, 2006

Year

External  Debt
($ bn)

External Debt to GNP
(%)

Debt Service ratio
(%)

Forex Reserves to Total Debt
(%)

Concess-ional
Debt to Total Debt
(%)

Short -Term to Total
Debt
(%)

(1)

(2)

(3)

(4)

(5)

(6)

(7)

1.  China

323

12.2

2.5

334.8

10.9

53.7

2.  Russian Federation

251

26.2

13.8

121.0

0.6

16.1

3.  Turkey

208

51.7

33.2

30.4

2.0

20.4

4.  Brazil

194

18.7

37.3

44.2

1.3

10.5

5.  India

170

17.8

4.8

117.4

23.3

15.5

6.  Mexico

161

19.5

18.9

47.5

0.9

4.6

7.  Indonesia

131

37.5

16.6

32.5

27.1

25.2

8.  Poland

126

38.7

24.7

38.5

0.9

17.0

9.  Argentina

122

58.6

31.6

26.2

1.1

28.7

10. Hungary

108

102.7

33.1

20.1

1.1

13.9

11. Kazakhstan

74

103.4

33.7

25.8

1.3

17.0

12. Philippines

60

47.1

19.6

38.1

20.7

8.3

13. Thailand

55

27.3

9.4

121.3

12.3

32.2

14. Romania

55

46.6

18.4

54.8

2.0

32.2

15. Malaysia

53

36.0

4.0

157.8

8.4

22.5

16. Ukraine

50

47.6

18.1

44.8

3.6

30.8

17. Chile

48

37.9

20.0

40.4

0.6

19.6

18. Venezuela RB

45

24.7

13.3

82.3

0.4

26.5

19. Colombia

40

26.9

31.3

38.9

2.6

12.1

20. Croatia

38

90.2

33.1

30.7

1.6

14.9

Source: Data for India are as published by national authorities for 2006-07 and those for other countries are at end-December 2006 as available in World Bank’s Global Development Finance, 2008.

Alpana Killawala
Chief General Manager

Press Release : 2008-2009/414

RbiTtsCommonUtility

प्ले हो रहा है
వినండి

Related Assets

RBI-Install-RBI-Content-Global

RbiSocialMediaUtility

భారతీయ రిజర్వ్ బ్యాంక్ మొబైల్ అప్లికేషన్‌ను ఇన్‌స్టాల్ చేయండి మరియు తాజా వార్తలకు త్వరిత యాక్సెస్ పొందండి!

Scan Your QR code to Install our app

RbiWasItHelpfulUtility

ఈ పేజీ ఉపయోగకరంగా ఉందా?