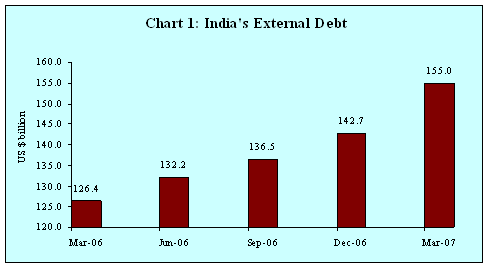
- India’s external debt at end-March 2007 increased by US $ 28.6
billion over the end-March 2006 level to reach a level of US $ 155.0 billion (Chart
1).
- The positive valuation impact reflecting the depreciation of
the US dollar vis-à-vis other major international currencies has added
to the outstanding debt stock.
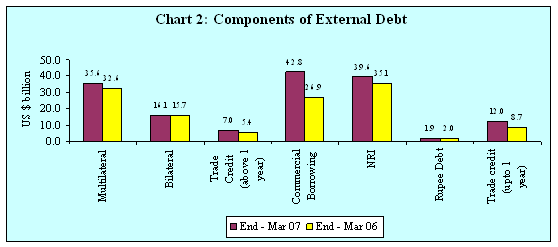
- Among the various components of external
debt, external commercial borrowings (ECBs) at US $ 42.8 billion have recorded
a significant increase of 59.2 per cent followed by trade credit and NRI deposits
(Table 1, Chart 2). Multilateral and bilateral
debt witnessed moderate increase.
- Short term trade credit has witnessed
a sharp increase of US $ 3.3 billion (37.7 per cent) underpinned by growth in
imports during the year.

Table
1: External Debt by Components | Item | Amount
at the end-of | Variation
during 2006-07 | March
07 | March 06 | Absolute
variation | Percentage
variation | | (US
$ million) | (US $ million) | (US
$ million) | (Per cent) |
(1) | (2) | (3) | (4) | (5) |
1. Multilateral | 35,641
(23.0) | 32,559
(25.8) | 3,082 | 9.5 |
2. Bilateral | 16,104
(10.4) | 15,727
(12.4) | 377 | 2.4 |
3. IMF | 0
(0.0) | 0
(0.0) | 0 | 0.0 |
4. Trade Credit | | | | |
a. Above 1 year | 6,964
(4.5) | 5,398
(4.3) | 1,566 | 29.0 |
b. Upto 1 year* | 11,971
(7.7) | 8,696
(6.9) | 3,275 | 37.7 |
5. Commercial Borrowings | 42,780
(27.6) | 26,869
(21.2) | 15,911 | 59.2 |
6. NRI Deposits (long-term) | 39,624
(25.6) | 35,134
(27.8) | 4,490 | 12.8 |
7. Rupee Debt | 1,949
(1.2) | 2,031
(1.6) | -82 | -4.0 |
8.Total Debt | 1,55,033
(100.0) | 1,26,414
(100.0) | 28,619 | 22.6 |
Memo Items | A.
Long-Term Debt | 1,43,062
(92.3) | 1,17,718
(93.1) | 25,344 | 21.5 |
B. Short-Term Debt | 11,971
(7.7) | 8,696
(6.9) | 3,275 | 37.7 |
Figures in parentheses indicate share to total debt;
* This
does not include supplier's credits of up to 180 days 
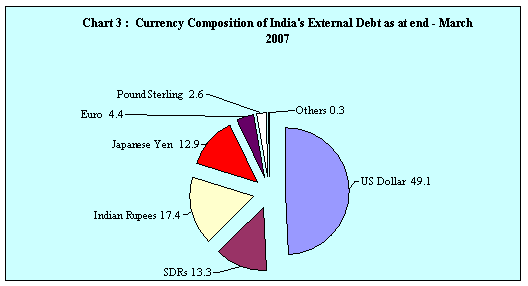
- As at end-March 2007, a little over 49 per cent of total external debt stock
was denominated in US dollars (Chart 3).

Indicators
of Debt Sustainability - External debt to GDP ratio has increased
to 16.4 per cent at end-March 2007 from 15.8 per cent at end-March 2006. This
ratio was 30.8 per cent at end-March 1995.
- The debt service ratio has
decreased to 4.8 per cent during 2006-07 from 9.9 per cent during 2005-06 and
25.9 per cent in 1994-95.
- Reflecting the rise in short term debt as at
end-March 2007, the ratio of short-term debt to total debt rose to 7.7 per cent
from 6.9 per cent as at end-March 2006. This ratio was 4.3 per cent at end-March
1995.
- Short term debt to reserves ratio increased to 6.0 per cent as
at end-March 2007 as compared with 5.7 per cent at end-March 2006.
- The
share of concessional debt in total external debt declined to 25.7 per cent at
end-March 2007 from 31.2 per cent at end-March 2006 (Table 2).
It may be recalled that this ratio was around 45.3 per cent at end-March 1995.
This development indicates a gradual increase in non-concessional private debt
in India's external debt stock.
Table
2: Indicators of Debt Sustainability | (in
per cent) | Indicators | End-March
2007 | End-March 2006 | End-March
1995 | (1) | (2) | (3) | (4) |
Total debt /GDP | 16.4 | 15.8 | 30.8 |
Short-term/Total debt | 7.7 | 6.9 | 4.3 |
Short-term debt/Reserves | 6.0 | 5.7 | 16.9 |
Concessional debt/Total debt | 25.7 | 31.2 | 45.3 |
Reserves/ Total debt | 128.5 | 119.9 | 25.4 |
Debt Service Ratio* | 4.8 | 9.9 | 25.9 |
Note: Debt service ratio is defined as a ratio of total debt servicing
to total current receipts.
* relates to fiscal year 2006-07, 2005-06 and
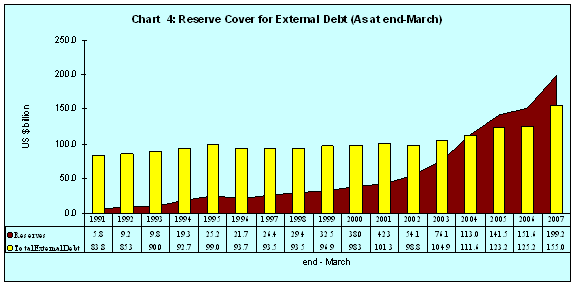
1994-95. - India’s foreign exchange reserves exceeded the external
debt by US $ 44.1 billion providing a cover of 128.5 per cent to the external
debt stock at the end of March 2007 (Chart 4).

Full details of the evolution of the debt stock over the period March 2006
to March 2007 are set out in Statement
1 and Statement
2.
G. Raghuraj
Deputy General Manager
Press Release : 2006-2007/1816 |
 IST,
IST,


