 IST,
IST,
Global Banking Developments
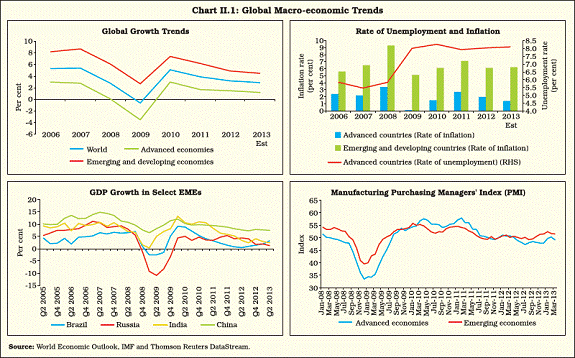
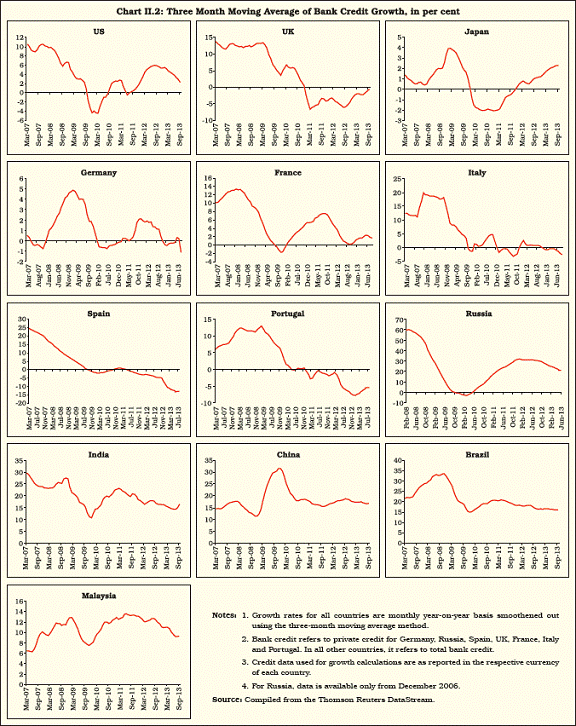
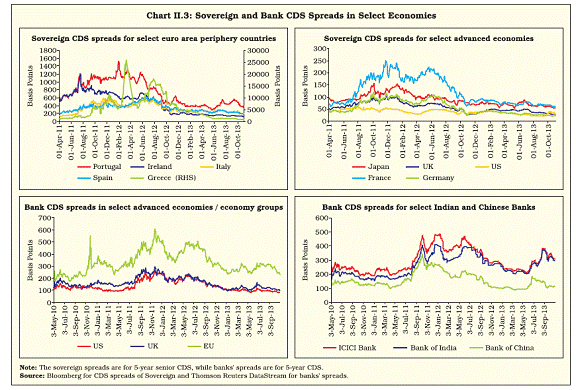
Financial conditions in the global banking system improved following monetary easing measures by central banks in advanced economies. Banks in the US are in an advanced stage of repairing their balance sheets. Concerns, however, remain for European banks’ asset quality. While the fundamentals of banking sectors in emerging economies were relatively robust, deceleration in growth may pose challenges. Significant progress has been made on the regulatory front regarding Basel III, systemically important financial institutions (SIFIs) and derivative reforms. Moving forward, the risks to the global banking system remain. The most important being the upturn in the global interest rate cycle when the Fed exits from its quantitative easing programmes resulting in an increase in credit risk. Early completion of balance sheet repair by banks and implementation of regulatory reforms will strengthen the stability of the banking system in the medium term. 1. Introduction 2.1 The global economy grew at a subdued pace in 2012 indicating that the recovery from the impact of the global financial crisis has not fully set in. Global growth moderated to 3.2 per cent in 2012 compared with 3.9 per cent achieved in 2011 (Chart II.1). Forecasts for 2013 suggest the continuation of sluggish global growth. The IMF’s World Economic Outlook (WEO) has projected that global growth will further decline to 2.9 per cent in 2013. This subdued global projection is driven to a large extent by slower growth in several key emerging market economies, as well as a tepid recovery in the euro area1. 2.2 Against this global macroeconomic setting, Section 2 analyses the performance of the global banking system using major indicators of banking activity and soundness for select advanced and emerging economies. Section 3 examines the performance of banking systems in select advanced and emerging economies. Section 4 analyses the performance of the top-100 banks which have a major global presence. The next section highlights the major regulatory and supervisory policy initiatives with regard to the global banking system during the year. The last section presents an overall assessment and outlook for the global banking sector for 2014. 2. Global Banking Trends 2.3 Globally, banks continued their efforts for repairing their balance sheets and improving their capital ratios, albeit at an uneven pace across countries. The funding costs of the global banking system in the second half of 2012 and so far in 2013 have witnessed improvements on the back of significant quantitative easing measures by central banks in advanced economies. Implementing regulatory reforms at the global level will require banks to further improve their asset quality. It will be imperative at least for some too-big-to-fail banks to rationalise their business mix as regulations may require them to ring-fence their core commercial banking services from investment activities. 2.4 Growth in global credit was multi-paced. Return on assets (RoA) improved for banks in the US and some emerging market and developing economies (EMDEs), but declined in European countries. An analysis of banking trends in select regions and countries shows an improvement in the financial position of the banks in the US, whereas banks in the euro zone continued to show a weak financial position. Concerns regarding the financial health of banks in the euro area periphery countries also remain. Banks in the UK improved their capital ratios but their exposure to the euro area remains a concern. 2.5 An analysis of the performance of the top- 100 global banks shows that the share of emerging economies in global banking continued to rise, with one bank from China (Industrial and Commercial Bank of China) registering the top rank in global banking ratings. On the global policy reforms front, there was some progress in rule framework for Basel III, systemically important financial institutions (SIFIs) and derivative market infrastructures. Divergence in credit growth across regions 2.6 Mirroring the divergence in the growth performance of economies, credit growth across economies also demonstrated an uneven pattern (Chart II.2). Return on assets showed a mixed trend 2.7 Return on assets (RoA), an indicator of the banking system’s profitability, showed a divergent trend across economies. In general, EMDEs maintained high RoA levels in 2012 as well (Table II.1). Financial stress reduced following quantitative easing (QE) measures 2.8 Financial conditions, which worsened in the second quarter of 2012-13 on account of the bank crisis in Spain and political instability in Greece, subsequently improved following quantitative easing measures undertaken by advanced central banks (Chart II.3). The US Federal Reserve undertook the “open-ended” quantitative easing (QE-3) programme, while the European Central Bank (ECB) started outright monetary transaction (OMT) programme. However, a prolonged period of low interest rates and exit from the central bank asset purchase programme may have negative spillover effects, increasing financial stability risks (Box II.1).
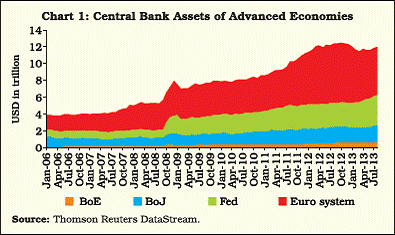
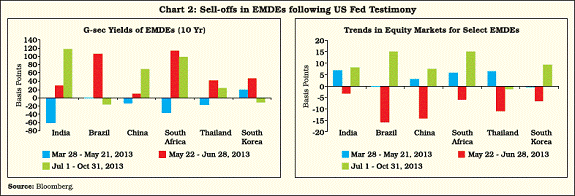
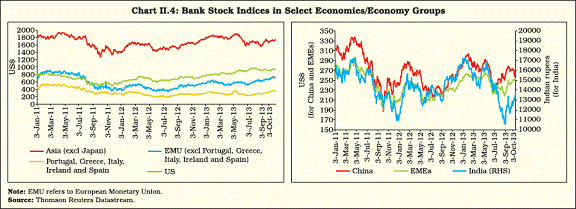
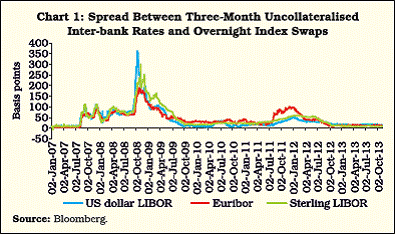
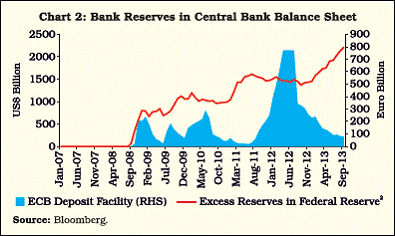
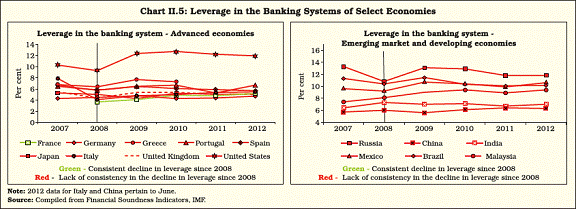
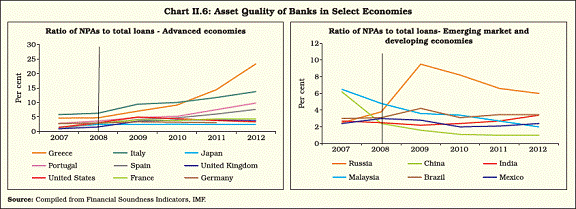
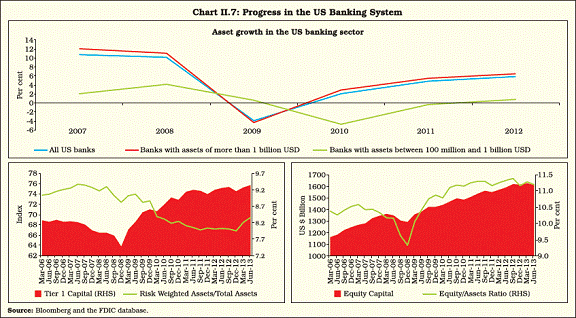
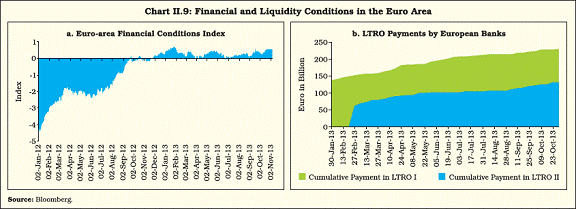
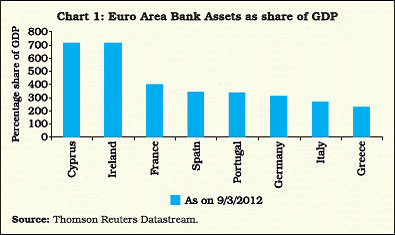
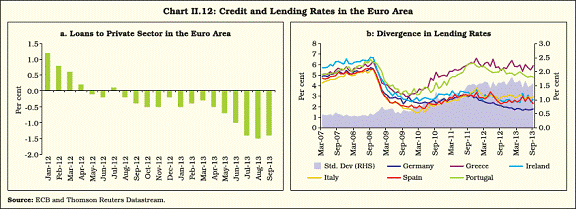
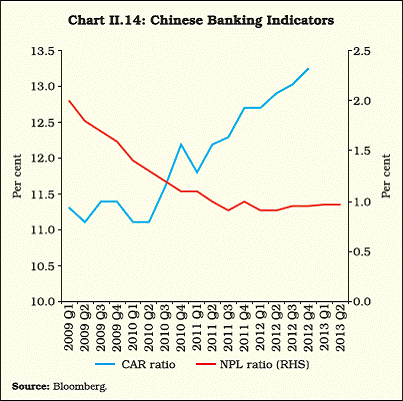
Financial Stability Risks of Unconventional Monetary Policy in Major Central Banks During the global financial crisis, central banks in advanced economies deployed a variety of unconventional measures such as, very low interest rates, quantitative easing (QE), long-term liquidity provision and private asset purchases, to restore the functioning of financial markets. These policies largely succeeded as markets started functioning and tail risks declined significantly. However, these measures have led to a substantial expansion in the balance sheets of these central banks. Coupled with an increase in the duration and diversity of assets, this has resulted in a decline in asset quality (IMF GFSR 2013). The unprecedented increase in central banks’ assets may lead to an increase in the financial risk in the system, with potential negative consequences for their financial strength and independence (Chart 1). Central banks’ balance sheet risks may take the form of valuation losses as a result of rise in interest rates and a decline in operating incomes as they hold large government bonds with low interest rates and possible impairment losses on assets with credit risk, as they exit from their unconventional policies. The US Federal Reserve, Bank of England (BoE) and Bank of Japan (BoJ) face interest rate risks as they have large holdings of government bonds, while ECB may face credit risk, as it has increased its lending exposures to banks in the euro area periphery countries. IMF has estimated that a 1 per cent increase in the interest rate would correspond to a capital loss of about 4 per cent of Federal Reserve’s total assets, 1.75 per cent of total assets for BoJ and 6.5 per cent for the BoE. Prolonged periods of unconventional monetary policies may have also increased potential risks in their respective domestic economies. Low interest rates have put pressure on financial institutions to take excessive risks in search for high yields, which may manifest in asset price bubbles. In recent periods, banks and financial institutions have been increasingly dependent on central bank financing, which may hamper the restoration of private sources of funding and also result in loosening of credit standards. Further, the exiting of unconventional monetary policies by central banks may increase the interest rate in the period ahead, which may increase interest rate risks for banks. Banks may also incur capital losses on fixed-rate securities. The increase in interest rates may weaken loan performance thereby increasing credit risk. Banks may also face funding challenges once the central banks exit the markets. Given the increasing integration of advanced economies and emerging market and developing economies (EMDEs), policy actions of central banks in advanced economies will spill over to emerging market economies as well. The signalling by the Chairman of the US Federal Reserve on May 22, 2013 that the Fed may taper off its asset purchase programme if economic conditions improve rapidly; followed by a more explicit forward guidance by the Fed Chairman on June 19, 2013 on moderating its asset purchases starting later this year and, in measured steps, unwinding the QE by mid- 2014, had a huge impact on EMDE markets. They came under intense pressure as the bond sell-off was accompanied by the reverse flight of capital back into the US amid expectations that high interest rates may lead to significant losses on existing bond holdings. Portfolio capital, especially in bond markets, witnessed outflows from EMDEs, thereby increasing bond yield and sell-offs in equity markets (Chart 2). Following US Federal Reserve decision to maintain its assets purchases in September 18, 2013, equity market in the EMDEs witnessed increase as capital flows started coming in. However, the Government yields have not come down commensurately following the Fed decision. In general, risks from an unconventional monetary policy exit stem from, among other things, timing, sequencing and speed of exit. An added challenge is managing expectations in the face of differential economic conditions between and within geographies. Reference: IMF (2013): Central Bank Policies since the Crisis Carry Risks to Financial Stability, Global Financial Stability Report (GFSR), IMF, April. With better funding conditions, bank stock indices improved 2.9 Bank stock indices, particularly in the second half of 2012-13 increased as financial easing improved funding conditions for banks (Chart II.4). Even the banks in the euro zone periphery countries were able to access markets and raise resources. Banking stocks in EMDEs also increased in the second quarter of 2012-13. However, comments by the US Fed in mid-May 2013, about the likely tapering-off of quantitative easing (QE), triggered outflows of investments from EMDEs resulting in a decline in bank stocks in these countries. Inter-bank spreads reduced significantly 2.10 Inter-bank market spreads, which increased substantially during the global financial crisis in 2008, came down following the reduction in risk perception and enhancement of liquidity injection by the central banks (Box II.2). Decline in international banking business 2.11 The contraction in the international banking business (by location of reporting banks) continued during 2012-13 (Table II.2). This reduction was especially marked for cross-border claims on the euro area. Financial soundness of banks Capital adequacy levels showed some improvement 2.12 Intensified efforts by the banks to strengthen their capital position was reflected in an increase in the level of capital adequacy in several economies including those in the euro area. However, some peripheral countries such as Greece need further improvements in capital adequacy levels (Table II.3). Liquidity Hoarding by Banks during the Global Financial Crisis During the financial crisis, especially during August 2007 and in the aftermath of the failure of Lehman Brothers and AIG in September 2008, short-term funding markets experienced severe disruptions. While the market for asset backed mortgages froze, inter-bank borrowing rates reached record high levels (Chart 1). Repo markets, which are typically highly liquid, shrank dramatically and experienced unprecedented high “haircuts”, as lenders withdrew their funds by declining to roll over their loan agreements (Gorton and Metrick, 2012). Counterparty withdrawals and credit denials, resulting in a loss of liquidity – not inadequate capital – caused a severe liquidity crisis and led to the demise of many banks. Difficulty in obtaining liquidity in inter-bank markets was subsequently experienced in many countries. Even central bank infusions of liquidity to banks through their borrowing facilities resulted in hoarding of liquidity rather than credit growth (Chart 2). Thus, it is important to analyse bank lending behaviour during a crisis to understand how banks’ actions to hoard liquidity may lead to liquidity shortage in the inter-bank market, and eventually, defaults by their counterparts. Literature offers precautionary, strategic and knightian uncertainty as banks’ motives for hoarding liquidity under stressed financial conditions. Precautionary Motive: Banks may decide to hoard liquidity for precautionary reasons if they believe that they will not be able to obtain inter-bank loans when faced with liquidity shortages. Asymmetric information in the market gives rise to banks’ apprehensions that they might be perceived as a source of counterparty risk and may lose access to markets. Data analysis in the case of the US reveals that more than one-fourth of the contraction in lending is due to the precautionary motive of liquidity hoarding banks (Berrospide 2013). Strategic Motive: Banks may also hoard liquidity in anticipation that the tightening liquidity situation may force other banks to fire-sale their assets and they may need liquidity to take advantage of this fact. If the future demand for cash is expected to be very high, asset prices will be low. In the event that a bank enters those situations with sufficient liquidity in its portfolio, it may profit from buying illiquid assets at “firesale” prices (Diamond and Rajan 2009). Banks may also hoard liquidity in anticipation of insolvency of their counterparties in inter-bank markets, that is, in view of rollover risk. Knightian Uncertainty: Since banks operate in complex financial network structures, in the face of increased uncertainty, banks may take decisions based on the worst-possible case scenarios. So they may hoard more liquidity in that process. Further, panic and uncertainty may lead to the flight to quality from illiquid banks resulting in an increase in financial stress. There has been evidence of inflows of core deposits to banks with large holdings of liquid assets in the US during the financial crisis (Berrospide 2013). Central bank’s direct infusion of liquidity to individual institutions may help mitigate distress in the inter-bank market. However, when uncertainty remains, banks may still prefer to hoard liquidity and refrain from lending to each other, which would weaken the beneficial effects of liquidity facilities. Berrospide (2013) shows that in the US, even though US$ 820 billion was provided to the banking industry during 2008 and 2009, the banks kept the funds in the central bank’s reserves, as they increased the reserves by US$ 765 billion in 2008 and US$ 318 billion in 2009. Hence, while liquidity hoarding can be a rational response to heightened uncertainty by banks, it can be another important impediment to the efficient functioning of the interbank market, in addition to the usual difficulties posed by counterparty risk, asymmetric information and the possible stigma associated with borrowing from central banks (Gale and Yorulmazer, 2011). References: Berrospide, J.M. (2013): “Bank Liquidity Hoarding and the Financial Crisis: An Empirical Evaluation”, FEDS Working Paper No. 2013-03, Board of Governors of the Federal Reserve System. Diamond, D.W. and R.G. Rajan (2009): “The Credit Crisis: Conjectures About Causes and Remedies”, American Economic Review, 99(2):606-10. Gale, M.D. and T. Yorulmazer (2011): “Liquidity Hoarding”, Federal Reserve Bank of New York Staff Report No. 488, New York. Gorton, G. and A. Metrick (2012): “Securitised Banking and the Run on Repo”, Journal of Financial Economics, 104(3):425-451. Uneven decline in leverage 2.13 An analysis of the leverage ratio as measured by the percentage of total capital (and reserves) to total assets across countries reveals an uneven picture. There was sharp deleveraging by banks in US and France (Chart II.5). Asset quality worsened for euro area periphery countries 2.14 During 2012, there was an improvement in the asset quality of banks in the US and core euro area countries. However, asset impairment increased sharply in the euro area peripheral countries (Chart II.6). Among EMDEs, most of the economies showed considerable improvement in asset quality in the years following the crisis. 3. Banking Trends in Select Regions and Countries The US banking system – balance sheet repair at an advanced stage 2.15 The US banking system has made considerable progress towards repairing balance sheets and building capital since the recent financial crisis. Banks have reduced their balance sheet risks by increasing their Tier-1 capital, assets and equity assets ratio (Chart II.7). Reflecting the improved performance of the US banking system, credit rating agency Moody’s changed its banking outlook for the US from negative to stable in May 2013. Improvement in profitability of US banks 2.16 The profitability of the US banking system has improved. It was largely been driven by a fall in loan loss reserves (Chart II.8). Funding conditions improved for the euro area banking system 2.17 Financial conditions in the euro area improved from mid-2012 onwards, following various measures taken by the authorities such as outright monetary transactions (OMT) and monetary easing by ECB. The proposal for a single banking union has also had a favourable impact notwithstanding the Cyprus crisis in early 2013 (Chart II.9a; Box II.3). Easing financial conditions in the euro area has improved funding conditions for banks. As a result, banks started repaying their three-year longer-term refinancing operations (LTRO) funds since January 23, 2013 (Chart II.9b). Repayment of LTRO funds shows that many European banks preferred to repay the first threeyear LTRO launched in December 2011 rather than the second LTRO launched in February 2012 indicating their preference for retaining funds with longer maturity. European banks continue to deleverage 2.18 In 2012, European banks continued their efforts to repair their balance sheets in the backdrop of tepid growth, stringent regulatory requirements and financial fragmentation. There was a marked reduction in leverage ratios and loan deposit ratios from the levels reached in 2008 (Chart II.10). Reliance on whole-sale funding has also come down considerably. 2.19 European banks have also reduced their total foreign claims by over 33 per cent since the peak achieved in March 2008 (Chart II.11). However, continued deterioration in both the quality of banks’ loan portfolios and profitability may pose challenges for some European banks in the period ahead. Financial fragmentation continues to persist 2.20 Despite significant improvements in the financial conditions of euro area banks, bank credit has not picked up, posing risks for sustained recovery (Chart II.12a). Further, financial fragmentation continues to exist between peripheral and core countries despite infusion of funds through LTRO. Dispersion in lending rates across countries and borrowers remains substantial, suggesting low pass-through from an accommodative monetary policy to bank lending conditions (Chart II.12b). ECB’s forthcoming asset quality review and stress test by the European Banking Authority (EBA) will be critical for the euro area banking system in ascertaining the level of balance sheet repairs which need to be undertaken by the banks in the period ahead. Box II.3: Cyprus, which is part of the euro zone, was affected by the ongoing European debt crisis in January 2013. The origins of the crisis in Cyprus lay in Greece’s sovereign debt crisis in 2012, as Cypriot banks had invested heavily in Greek sovereign bonds and had also lent to the private sector in Greece. The restructuring of the Greek sovereign debt in 2012 severely hit these banks. The crisis was also aided by the worsening fiscal situation in Cyprus which led to fears about Cyprus’ solvency. These factors resulted in a sharp increase in the capital needs of major Cypriot banks which rose to almost € 9 billion, equivalent to 50 per cent of Cypriot GDP (ECB 2013). On March 16, 2013 the Cyprus Government entered into an agreement with the Euro group to shut down the country’s second largest bank, the Cyprus Laiki Bank and transfer its deposits of under €100,000 to Bank of Cyprus. Further, it was decided that in return for a €10 billion bailout from the Troika [European Commission, the European Central Bank (ECB) and the International Monetary Fund (IMF)], the Cypriot Government would be required to impose a significant haircut on uninsured deposits, a large proportion of which were held by nonresidents. Under this agreement, the insured deposits of equal to or less than €100,000 were not affected. In order to avoid fund outflows from domestic banks, Cypriot authorities also introduced temporary restrictions on domestic and cross border transactions and payments. Implications for Cyprus’ economy and financial stability Plans for the two largest banks, Bank of Cyprus and Laiki, are especially controversial in Cyprus, as these involve heavy losses for depositors with large balances in their accounts. According to IMF, which is providing 10 per cent of the bailout money, 95 per cent of account holders will be protected as a majority of the accounts have less than €100,000 in them. However, depositors with more than €100,000 will lose some of their savings. Although the exact amount has still not been determined, according to estimates they could lose up to 60 per cent of their savings. Restrictions on the amount of money that can be withdrawn daily are still in place. Data by the Central Bank of Cyprus shows that there is continuous deposit flight from the Cyprus banks. Between end-January to September 2013, there was a cumulative decline in deposits of around 30.6 per cent (Table 1). The breakdown of decline in deposits shows that foreigners drew a considerably larger share of funds. Prospects of short-term growth are very bleak for the Cyprus economy as it is estimated that its GDP in 2013 is projected to contract by about 7.7 per cent. Deficit targets agreed to between the Troika and Cyprus in a Memorandum of Understanding (MoU) imply that the economy will contract by about 12.5 per cent cumulatively during 2013-14 and it is forecast to return to growth in 2015. Apart from the direct impact on GDP from winding down the second biggest bank Laiki and the destruction of a banking model designed to attract funds from abroad, the economy will suffer from a ripple effect across related industries, especially tourism. Further, bank assets as a percentage of total GDP are higher in Cyprus than the other euro area economies (Chart 1). Confidence shock among consumers and investors are also to be factored in. Thus, the immediate problem facing Cyprus is how to restore confidence in its banking system. The second quarterly review of Cyprus economic programme by Troika on November 7, 2013 stated that all the fiscal targets have been met as a result of significant fiscal consolidation measures underway and prudent budget execution. The November review by Troika followed by an approval by the Eurogroup and IMF’s Executive Board scheduled in December 2013 will pave the way for disbursing €100 million by the ESM, and about €86 million by IMF to Cyprus. This will provide some succour to the ailing economy. The Cypriot crisis, however, has not led to any disruptions in global financial markets and it is largely confined to the domestic economy. Reference: ECB (2013): Financial Stability Review, May 2013. UK banking system - funding conditions improved 2.21 Funding conditions for UK banks improved following the easing of global financing conditions. While the flow of retail credit through the banking system increased in the recent period, credit to corporates is yet to pick up (Chart II.13). UK banks face significant risks as their total exposure to euro area periphery countries is substantial at around UK pound 140 billion accounting for 65 per cent of their reported core Tier-1 capital at end-2012. Chinese banking system - continued growth 2.22 The Chinese banking system continued to grow in 2012, with a higher capital adequacy ratio and a low level of non-performing loans (NPLs) (Chart II.14). However, the growth of shadow banking remains a concern, though credit flow from the shadow banking system slowed down from the earlier high levels (Table II.4).
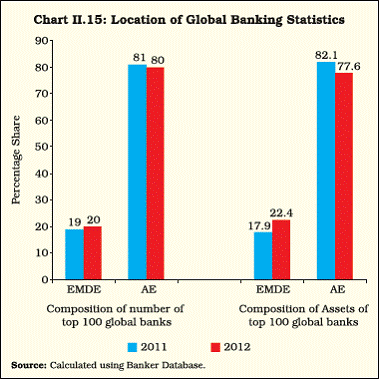
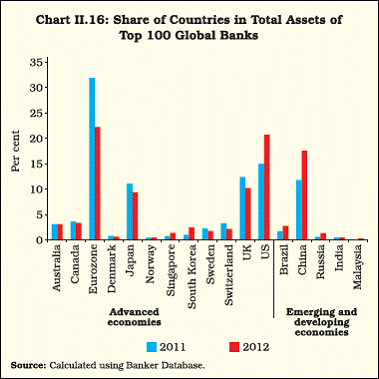
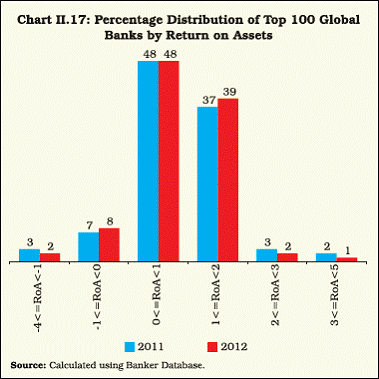
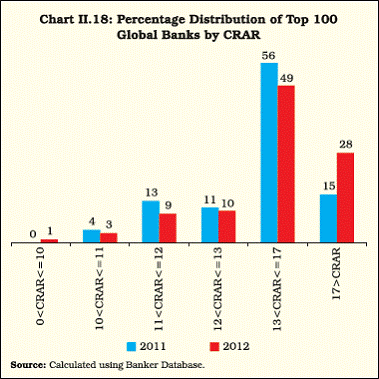
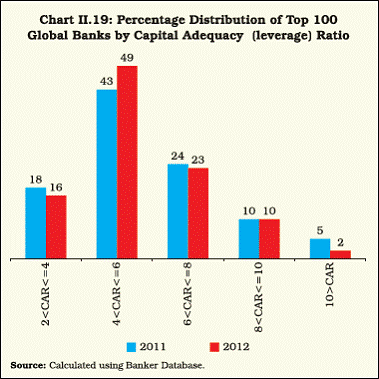
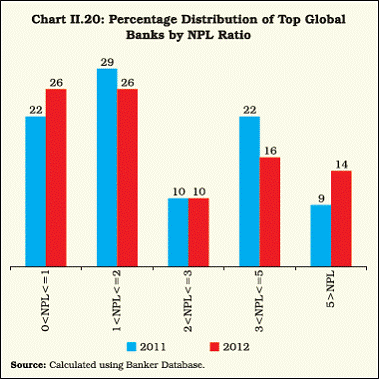
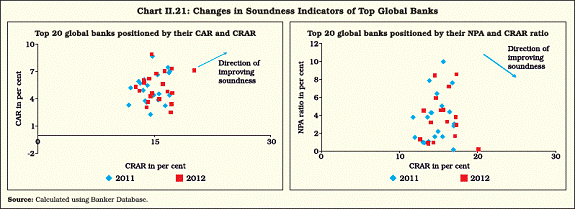
4. Analysis of the Performance of Top 100 Global Banks Share of emerging economies in global banking continued to increase 2.23 An analysis of the top 100 global banks by the Banker Database shows that the trend of a moderate shift in the global banking business from advanced economies to EMDEs continued in 2012. This is evident from both the composition of number and assets of the top-100 global banks (Chart II.15). This shift reflects continued credit growth in EMDEs, combined with subdued credit growth in advanced economies. The decline in the asset share of advanced economies between 2011 and 2012 was concentrated in Europe, Japan and UK banks (Chart II.16). Among EMDEs, Chinese banks exhibited a significant improvement in the top 100 banks ratings, as the Industrial and Commercial Bank of China (ICBC) reached the top rank based on Tier-1 capital for the first time. Profitability of global banks remains subdued 2.24 Profits of the top-100 banks remained more or less the same during 2012 (Chart II.17). Aggregate profits of these banks recorded a marginal increase to US$ 590 billion in 2012 from US$ 557 billion in 2011, driven mainly by profits of banks in the Asia-Pacific region. Global banks strengthen their capital adequacy position 2.25 The capital adequacy position of the top 100 banks reveals that the number of banks in the higher bracket of the capital adequacy ratio, that is, more than 17 per cent, showed an increase, reflecting global initiatives at strengthening the capital position of banks (Chart II.18). All the top 100 banks are maintaining a higher capital adequacy level than the Basel Committee on Banking Supervision (BCBS) norm of 8 per cent CRAR under the Basel II framework. Slow progress is evident in the deleveraging of global banks 2.26 Notwithstanding the improvement in CRAR, soundness of global banks, particularly, for the euro area periphery countries remained weak. However, at the end of 2012, the number of banks that are highly leveraged with a capital adequacy ratio – a measure of financial leverage – of less than 4 per cent came down (Chart II.19). Mixed trend in the asset quality of global banks 2.27 Amidst an uncertain global financial environment, global banks showed a mixed trend in their asset quality (Chart II.20). Scatter plots of the top-20 banks covering three indicators of CRAR, CAR and NPA ratio, clearly reveal that while banks were in the process of stepping up their CRAR between 2011 and 2012, not much improvement was discernible in the NPA ratios during 2012 (Chart II.21). 5. Global Policy Reforms Progress in regulatory reforms 2.28 Global regulatory reforms initiated in 2009 to strengthen the financial sector and to support sustainable economic growth by reducing future risks progressed in many areas. Formulation of policies regarding the Basel III framework, systemically important financial institutions (SIFIs) and financial market infrastructures have seen substantial progress in the recent period. Basel III Framework 2.29 The Basel III framework developed by the Basel Committee on Banking Supervision (BCBS) is a comprehensive set of reform measures to strengthen the regulation, supervision and risk management of the banking sector. In January 2013, BCBS issued revised guidelines on liquidity coverage ratio, which promotes the resilience of banks by ensuring that they maintain an adequate stock of high-quality liquid assets to withstand reversals in funding conditions. The implementation of Basel III reforms has been phased-in between January 2013 and December 2018. 2.30 BCBS’s October 9, 2013 progress report on Basel III implementation shows that 26 of the 27 jurisdictions that comprise the Basel Committee, had issued the final set of Basel III based capital regulations. Indonesia has draft rules in place and efforts are under way to finalise them. Systemically Important Financial Institutions (SIFIs) 2.31 Regulatory developments towards global systemically important banks (G-SIBs) have focused principally on putting in place stronger regulations for reducing the probability of default by such banking entities to levels that are below those for less systemically important financial firms and creating a resolution regime for reducing losses to the broader financial system and economy upon the failure of a SIFI. 2.32 In July 2013, BCBS came out with its updated methodology for assessing and identifying G-SIBs and the higher loss absorbency requirement for G-SIBs. The additional loss absorbency requirements will range from 1 per cent to 2.5 per cent Common Equity Tier 1 (CET1) depending on a bank’s systemic importance with an initially empty bucket of 3.5 per cent CET1 as a means to discourage banks from becoming even more systemically important. The Financial Stability Board (FSB) updated the list of G-SIBs for 2013, listing 29 banking institutions. Markets: over-the-counter infrastructures 2.33 The global financial crisis revealed major shortcomings in the way derivatives are traded, reported and cleared as well as the capital required for bilateral trading. The basic thrust of the reforms is moving more OTC bilateral derivatives contracts to central counterparties (CCPs) and, where possible, to organised exchange trading platforms, while potentially increasing the transparency of the market via reporting of transactions to trade repositories (TRs). 2.34 In 2009, the G-20 agreed to implement central clearing and electronic trading of standardised derivatives instruments by the end of 2012. According to the Progress Report released by FSB on the implementation of the OTC derivatives market reforms in September 2013, there has been progress in actual use of centralised infrastructure by market participants in trade reporting, central clearing of OTC interest rate and credit derivatives. Currently, over half of FSB members jurisdictions have legislative frameworks in place to enable all reform commitments to be implemented. National initiatives on bank structure regulation 2.35 A number of advanced countries are also considering structural reforms of bank structures in their respective countries and they are in varying stages of implementation. The Volcker Rule in the US, Vickers Report in the United Kingdom and the Liikanen Report in the European Union are some of the initiatives in this regard. Even though the initiatives are essentially aimed at strengthening financial stability by shielding the core functions of commercial banks from losses related to investment banking and securities market activities, they vary in the measures that are proposed to be taken. The Volcker Rule prohibits proprietary trading by commercial banks; the Liikanen Report recommends placing riskier trading activities in specific subsidiaries within the same holding company and the Vickers Report proposes ringfencing of core banking activities and moving trading and underwriting activities to separate entities within the same holding company. 6. Overall Assessment 2.36 An analysis of the global banking system for 2012 shows a mixed picture. While the fundamentals of US banks are better as asset quality has improved, concerns remain in the euro area banking system because of financial fragmentation. The Global Financial Stability Report (GFSR) of April 2013 noted that many euro area banking systems remain relatively weak as capital buffers are low relative to reported impaired loans, the asset quality continues to deteriorate and profitability is poor. Banks in EMDEs, in general, maintained their regulatory capital ratios. The global banking system is faced with multiple risks in the years ahead, as it is faced with pressures on profitability, growing regulatory compliance costs, and revenue-growth difficulties amid weak credit and economic growth. 2.37 The US Federal Reserve in its September 18, 2013 communication has surprisingly refrained from reducing the US$ 85 billion pace of monthly buying, as it has decided to await more evidence that progress will be maintained before adjusting the pace of its asset purchases. The prolonged periods of unconventional monetary policies may increase financial risks in the economy, as banks and financial institutions may take excessive risks in search of high yields. Given the economic activity expanding at a moderate pace and some improvement in the employment level, the US Federal Reserve may have to exit their unconventional policy in the near future. If it tapers off its asset purchases, it is increasingly likely that there will be an upturn in global interest rate cycles, which will affect the value of banks’ trading book assets directly, as banks have increasingly invested in government securities since the global financial crisis in order to reduce their credit risk. If the higher interest rate cycle exists along with lower economic growth, the banks may also face higher non-performing loans. Banks in EMDEs are better placed, as they have limited funding dependency on international markets, but they too face downward risks arising out of deceleration in economic growth, capital outflows and forex market volatility. Banking systems in various countries should continue strengthening their balance sheets. Timely completion and implementation of regulatory reforms will make banking systems less risky, more resilient and reduce future stability risks in the systems. 1World Economic Outlook, IMF, October 2013. 2From July 2013 onwards, excess reserves is calculated as “total reserve balances maintained” minus “reserve balance requirements” |
||||||||||||||||||||||||||||||||||||||||||||||||||||||||||||||||||||||||||||||||||||||||||||||||||||||||||||||||||||||||||||||||||||||||||||||||||||||||||||||||||||||||||||||||||||||||||||||||||||||||||||||||||
పేజీ చివరిగా అప్డేట్ చేయబడిన తేదీ:


