Drivers of growth from the expenditure side in the first quarter of 2010-11 suggest
continued predominance of both private consumption and investment expenditures. Recent
trends in capital goods production, capital expenditure plans of corporates, non-oil
imports, growth in credit and financing from non-banking sources point to strengthening
of drivers of investment expenditure. Expenditure side GDP data as well as trends in
corporate sales and production of consumer durables indicate pick-up in private
consumption expenditure. Despite the policy emphasis on fiscal consolidation and the
observed improvement in revenue deficit, Government’s expenditures have shown
stronger growth than last year. The turnaround in agricultural production during kharif
2010-11 is expected to stimulate private expenditure.
Domestic Demand
II.1 India’s growth drivers continue to
be domestic. This has helped not only in
limiting the impact of global recession on
domestic growth but also in ensuring a fast
and durable recovery. The key factors
driving growth and their sustainability over
the medium-term could be seen from the
expenditure side of GDP. Real GDP at
market prices grew by 10 per cent in the first
quarter of 2010-11, higher than 8.8 per cent
growth recorded in respect of real GDP at
factor cost. The higher growth in real GDP
at market prices is a reflection of higher net
indirect taxes.
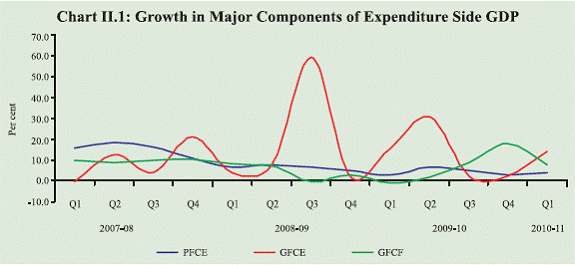 |
II.2 At a disaggregated level, the growth
of private final consumption expenditure
(PFCE) picked up moderately during the first
quarter of 2010-11. With turnaround in
agriculture production during the kharif
season 2010-11, it is expected that rural
demand and private consumption
expenditure could gather momentum, going
forward. The Government final consumption
expenditure (GFCE) after remaining
subdued for two quarters, accelerated
sharply during the first quarter of 2010-11.
The acceleration in GFCE during the first
quarter of 2010-11 is in tandem with the
growth in revenue expenditure of the Central
Government (Chart II.1 and Table II.1).
Table II.1: Expenditure Side GDP (2004-05 Prices) |
(Per cent) |
Item |
2008-09 * |
2009-10 # |
2009-10 |
2010-11 |
Q1 |
Q2 |
Q3 |
Q4 |
Q1 |
1 |
2 |
3 |
4 |
5 |
6 |
7 |
8 |
Growth Rates |
Real GDP at market prices |
5.1 |
7.7 |
5.2 |
6.4 |
7.3 |
11.2 |
10.0 |
Total Consumption Expenditure |
8.3 |
5.3 |
4.7 |
9.6 |
4.8 |
2.6 |
5.5 |
(i) Private |
6.8 |
4.3 |
2.9 |
6.4 |
5.3 |
2.6 |
3.8 |
(ii) Government |
16.7 |
10.5 |
15.3 |
30.5 |
2.5 |
2.1 |
14.2 |
Gross Fixed Capital Formation |
4.0 |
7.2 |
-0.7 |
1.6 |
8.8 |
17.7 |
7.6 |
Change in Stocks |
-61.2 |
5.9 |
-0.9 |
4.2 |
8.7 |
11.1 |
7.0 |
Net Exports |
40.2 |
-9.7 |
-27.4 |
6.1 |
-0.3 |
-113.4 |
20.5 |
Relative shares |
Total Consumption Expenditure |
70.9 |
69.4 |
71.4 |
71.5 |
73.4 |
62.3 |
68.4 |
(i) Private |
59.5 |
57.6 |
59.9 |
60.1 |
60.4 |
51.1 |
56.5 |
(ii) Government |
11.5 |
11.8 |
11.5 |
11.3 |
13.1 |
11.2 |
11.9 |
Gross Fixed Capital Formation |
32.9 |
32.8 |
31.2 |
33.2 |
31.9 |
34.6 |
30.5 |
Change in Stocks |
1.3 |
1.3 |
1.3 |
1.4 |
1.3 |
1.3 |
1.3 |
Net Exports |
-6.1 |
-5.1 |
-4.8 |
-8.7 |
-6.7 |
0.4 |
-5.2 |
Memo: |
(` crore) |
Real GDP at market prices |
4,465,360 |
4,807,222 |
1,099,653 |
1,125,257 |
1,242,858 |
1,339,454 |
1,209,888 |
* : Quick Estimates. # : Revised Estimates.
Note: As only major items are included in the table, data will not add up to 100.
Source: Central Statistics Office. |
II.3 Investment growth in the form of
gross fixed capital formation (GFCF),
which had picked up in the third quarter of
2009-10 and then accelerated sharply in the
last quarter, witnessed moderation during
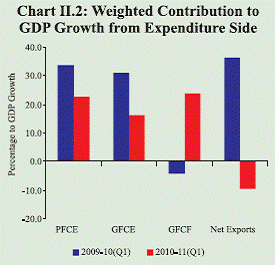
the first quarter of 2010-11. Reflecting this,
the share of gross fixed capital formation in
GDP declined, with an offsetting increase in
the share of private consumption expenditure.
Private consumption expenditure and gross
fixed capital formation, nevertheless, were the
major drivers of growth in real GDP at
market prices (Chart II.2).
II.4 The slack in gross fixed capital
formation during the first quarter of
2010-11, however, appears to be somewhat
contrary to the buoyant trends witnessed
in respect of capital goods segment in
the IIP.
Demand Management through Fiscal Policy
Central Government Finances
II.5 Reflecting the impact of economic
recovery, partial rollback of fiscal stimulus measures and receipts from 3G spectrum
and broadband wireless access (BWA)
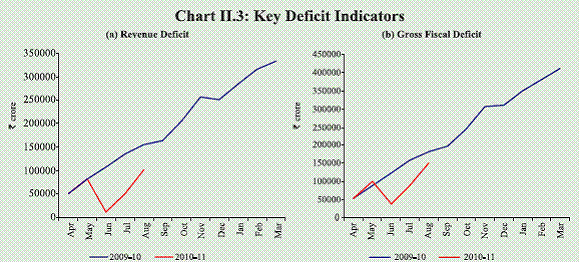
auctions, the position of Central Government
finances improved significantly with
revenue deficit (RD) and gross fiscal deficit
(GFD) during April-August 2010-11
turning out to be substantially lower, both
in absolute terms and as a proportion of
budget estimates, over the corresponding
period of the previous year (Chart II.3 and
Table II.2).
II.6 Improvement in finances of the
Central Government during 2010-11 so far
(April-August) was evident from
substantial increase in revenue receipts
(85.0 per cent), supported by tax and nontax
revenues. The gross tax revenue
increased significantly (27.3 per cent) in
contrast to the sharp decline (11.6 per cent)
recorded during 2009-10 (April-August),
mirroring the underlying economic
recovery and the partial rollback of indirect
tax cuts.
II.7 Direct tax collections showed
significant improvement during April-
August 2010-11, recording a growth of 13.8 per cent over April-August 2009-10. While
corporate tax collections grew by 18.4 per
cent, collections under personal income tax
increased by 14.0 per cent. In addition, the
mobilisation of revenues from 3G/BWA
spectrum auctions in June 2010 helped to
ease the pressure on Government finances.
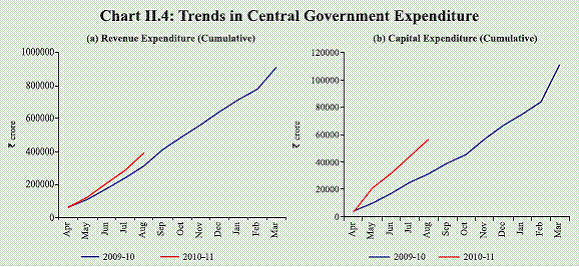
II.8 During April-August 2010-11,
growth in revenue as well as capital
expenditure was higher than in the
corresponding period of 2009-10. The
escalation in aggregate expenditure
emanated from accelerated growth (39.2 per
cent) in plan expenditure. During 2010-11
so far (April-August), Centre has already
incurred 40.4 per cent of aggregate
expenditure budgeted for 2010-11
(Chart II.4).
II.9 The fiscal stimulus measures
initiated by the Government achieved the
objective of containing the duration and
extent of economic slowdown in India.
Taking cognisance of the improved growth
prospects and the need for fiscal
consolidation for sustaining the growth
momentum, Central government has embarked on gradual fiscal exit plan as
announced in the Budget 2010-11. The
robust growth in revenue receipts in
2010-11 is premised on partial rollback of
indirect tax rate reduction and revenue
from 3G/BWA spectrum auctions. Given
the one-off nature of auction proceeds, the
priority of consolidation should continue in terms of quantity and quality. In order to
achieve a sustainable progress on fiscal
consolidation path, it would be desirable
to adopt measures designed to augment
revenue collection on a sustainable basis
and rationalisation of recurring expenditure,
with a focus, particularly on curtailing nonplan
revenue expenditure.
Table II.2 : Central Government Finances: April-August 2010-11 |
Item |
April-August
(` crore) |
Percentage to
Budget Estimates for |
Growth Rate
(Per cent) |
2009 |
2010 |
2009-10 |
2010-11 |
2009-10 |
2010-11 |
1 |
2 |
3 |
4 |
5 |
6 |
7 |
1. Revenue receipts |
1,57,198 |
2,90,799 |
25.6 |
42.6 |
-2.7 |
85.0 |
i) Tax revenue (Net) |
1,06,837 |
1,38,500 |
22.5 |
25.9 |
-14.8 |
29.6 |
ii) Non-tax revenue |
50,361 |
1,52,299 |
35.9 |
102.8 |
39.6 |
202.4 |
2. Non-debt capital receipts |
3,835 |
5,479 |
71.7 |
12.1 |
218.8 |
42.9 |
3. Non-plan expenditure |
2,45,275 |
3,11,249 |
35.3 |
42.3 |
27.1 |
26.9 |
of which: |
|
|
|
|
|
|
i) Interest payments |
72,133 |
85,621 |
32.0 |
34.4 |
9.6 |
18.7 |
ii) Defence |
41,129 |
45,395 |
29.0 |
30.8 |
65.8 |
10.4 |
iii) Major subsidies |
54,193 |
54,738 |
51.1 |
50.2 |
4.7 |
1.0 |
4. Plan expenditure |
98,048 |
1,36,454 |
30.2 |
36.6 |
13.2 |
39.2 |
5. Revenue expenditure |
3,12,283 |
3,91,151 |
34.8 |
40.8 |
20.4 |
25.3 |
6. Capital expenditure |
31,040 |
56,552 |
25.1 |
37.7 |
53.6 |
82.2 |
7. Total expenditure |
3,43,323 |
4,47,703 |
33.6 |
40.4 |
22.8 |
30.4 |
8. Revenue deficit |
1,55,085 |
1,00,352 |
54.9 |
36.3 |
58.4 |
-35.3 |
9. Gross fiscal deficit |
1,82,290 |
1,51,425 |
45.5 |
39.7 |
56.0 |
-16.9 |
10. Gross primary deficit |
1,10,157 |
65,804 |
62.8 |
49.6 |
115.8 |
-40.3 |
Source: Controller General of Accounts, Ministry of Finance. |
 |
State Finances
II.10 State Governments undertook
various measures in terms of additional
spending and tax cuts in 2009-10 with
view to boost domestic economic activities.
As a result, revenue deficit re-emerged in
2009-10, after a gap of three years.
Recognising the need for fiscal discipline,
States have embarked upon the process of
fiscal consolidation in 2010-11. Revenue
expenditure, as a ratio to GDP, is budgeted
to be lower at 13.4 per cent in 2010-11 (BE)
as against 13.6 per cent in 2009-10 (RE).
States expect to witness higher revenue
buoyancy in 2010-11 (BE) on account of
higher own tax revenue and share in Central
taxes. Accordingly, revenue deficit and
gross fiscal deficit of State governments are
budgeted to be lower in 2010-11.
Combined Fiscal Position
II.11 An overview of the combined
finances of the Central and State Governments budgeted for 2010-11
indicates that the key deficit indicators as
per cent of GDP would moderate
compared to the elevated levels in
2009-10 (Table II.3). The envisaged fiscal
consolidation is to be driven by significant
increase in revenue receipts, while
curtailing the growth of expenditure. Total
expenditure in terms of both growth and as
a percentage of GDP would moderate
somewhat from the previous year. Growth
in tax collections is expected to improve
on account of reversal of tax cuts and the
acceleration in economic growth.
Table II.3: Key Fiscal Indicators |
(Per cent to GDP) |
Year |
Primary Deficit |
Revenue Deficit |
Gross Fiscal Deficit |
Outstanding Liabilities* |
1 |
2 |
3 |
4 |
5 |
|
Centre |
2008-09 |
2.6 |
4.5 |
6.0 |
56.7 |
2009-10 RE |
3.2 |
5.3 |
6.7 |
56.4 |
2010-11 BE |
1.9 |
4.0 |
5.5 |
56.9 |
|
States # |
2008-09 |
0.6 |
-0.2 |
2.4 |
26.2 |
2009-10 RE |
1.6 |
0.8 |
3.4 |
26.2 |
2010-11 BE |
1.0 |
0.4 |
2.9 |
26.1 |
|
Combined |
2008-09 |
3.4 |
4.3 |
8.5 |
72.0 |
2009-10 RE |
4.8 |
6.0 |
10.0 |
72.5 |
2010-11 BE |
3.0 |
4.4 |
8.3 |
73.6 |
RE : Revised Estimates. BE : Budget Estimates.
* : Includes external liabilities at historical exchange rates.
# : Data pertain to 27 State Governments.
Note: Negative sign indicates surplus. |
Corporate Performance
II.12 The turnaround in overall
economic activity was reflected in the
corporate sector performance. Sales of
private corporate business sector witnessed
significant improvement, recording a
growth of 24.2 per cent (y-o-y) during the
first quarter of 2010-11 (Table II.4).
The high growth in sales partly reflects the
low base effect, as the economic activity in
the first quarter of the previous year had
remained subdued with an almost flat sales
and moderate profit growth. Sequentially,
sales growth during the first quarter of 2010-11 witnessed moderation over the fourth
quarter of 2009-10, though seasonally
adjusted sales increased by 1.9 per cent over
the fourth quarter of 2009-10.
Table II.4: Corporate Sector Financial Performance |
(Growth rates/ratios in per cent) |
Item |
2008-09 |
2009-10 |
2010-11 |
Q1 |
Q2 |
Q3 |
Q4 |
Q1 |
Q2 |
Q3 |
Q4 |
Q1 |
1 |
2 |
3 |
4 |
5 |
6 |
7 |
8 |
9 |
10 |
No. of companies |
2500 |
2386 |
2486 |
2561 |
2530 |
2531 |
2562 |
2565 |
2546 |
Sales |
29.3 |
31.8 |
9.5 |
1.9 |
-0.9 |
0.1 |
22.5 |
29.1 |
24.2 |
Other income* |
-8.4 |
-0.6 |
-4.8 |
39.4 |
50.2 |
6.0 |
7.4 |
10.3 |
-21.2 |
Expenditure |
33.5 |
37.5 |
12.6 |
-0.5 |
-4.4 |
-2.5 |
20.6 |
30.7 |
29.0 |
Depreciation provision |
15.3 |
16.5 |
16.8 |
19.6 |
21.5 |
20.7 |
21.6 |
20.1 |
19.9 |
Gross profits |
11.9 |
8.7 |
-26.7 |
-8.8 |
5.8 |
10.9 |
60.0 |
36.7 |
8.2 |
Interest payments |
58.1 |
85.3 |
62.9 |
36.5 |
3.7 |
-1.0 |
-12.3 |
-2.9 |
26.9 |
Profits after tax |
6.9 |
-2.6 |
-53.4 |
-19.9 |
5.5 |
12.0 |
99.3 |
44.0 |
2.4 |
Select Ratios |
Change in stock-in-trade to sales # |
2.9 |
2.2 |
-1.7 |
-1.8 |
0.6 |
2.3 |
0.8 |
1.1 |
2.9 |
Gross profits to sales |
14.5 |
13.5 |
11.0 |
13.7 |
15.7 |
14.9 |
14.3 |
14.6 |
13.9 |
Profits after tax to sales |
9.7 |
8.6 |
5.3 |
8.1 |
10.2 |
9.4 |
8.8 |
9.0 |
8.6 |
Interest to sales |
2.4 |
2.9 |
3.8 |
3.2 |
2.8 |
3.1 |
2.7 |
2.4 |
2.9 |
Interest to gross profits |
16.8 |
21.5 |
34.6 |
23.3 |
18.0 |
20.5 |
19.1 |
16.6 |
21.1 |
Interest coverage (times) |
6.0 |
4.6 |
2.9 |
4.3 |
5.6 |
4.9 |
5.2 |
6.0 |
4.7 |
* : Other income excludes extraordinary income/expenditure, if reported explicitly.
# : For companies reporting change in stock-in-trade explicitly.
Note: 1. Growth rates are percentage changes in the level for the period under reference over the corresponding period of the previous year for common set of companies.
2. The quarterly data may not add up to annual data due to differences in the number and composition of companies covered, in each period. |
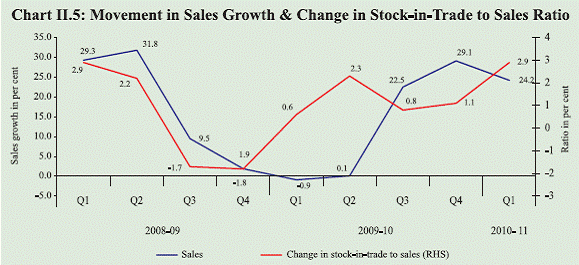
II.13 Change in stock-in-trade, which
remains generally around the peak in the
first quarter of each financial year, formed
2.9 per cent of sales during the first quarter
of 2010-11 (Chart II.5). A rise in change in
stock-in-trade to sales ratio suggests that
corporates are building up their inventories
in anticipation of higher demand.
Accumulation of stocks increased to 3.3 per
cent of sales excluding sugar industry
during the quarter. Given the strong growth
in sales, increase in change in stock to sales
ratio suggests significant addition to stocks
during the quarter, which could have been
a factor to support the robust overall GDP
and industrial growth in that quarter.
II.14 Strong investment intentions were
evident as reflected in higher envisaged
capital expenditure of companies, which
approached banks/FIs for financial
assistance during April-June 2010. In the
first quarter of 2010-11, 87 projects were
sanctioned assistance by banks/FIs of
` 99,998 crore as against 35 projects
of ` 30,116 crore sanctioned during
corresponding period of the previous year.
External Demand
II.15 Unlike in the fourth quarter of
2009-10, when net exports had contributed
positively to real GDP growth on the
expenditure side, the contribution of net
exports during the first quarter of 2010-11
became negative, as growth in imports
remained ahead of growth in exports. (see
Chart II.2). While the growth in exports
was impacted by the weak and uncertain
global economic environment, that of
imports reflected the increasing momentum
of domestic economic activity.
II.16 To sum up, private consumption
expenditure has picked up, but needs to
gain further momentum to support a selfsustaining
robust growth in GDP.
Notwithstanding the process of fiscal consolidation that is underway,
Government spending continues to support
growth, reflecting higher growth in both
revenue and capital expenditures.
Available data relating to production of
capital goods, notwithstanding volatility,
and capital expenditure plans of the
corporates point to a strong momentum in
investment expenditure during the current
fiscal year. Reflecting the high growth in
India relative to hesitant recovery in the
advanced economies, the contribution of
net exports to aggregate demand could be
expected to remain negative during the
year. Overall, although aggregate demand
trends point to continuation of the
momentum, investment demand needs to
emerge as the key driver for sustainable
robust growth.
|
 IST,
IST,


