 IST,
IST,


III. The External Economy
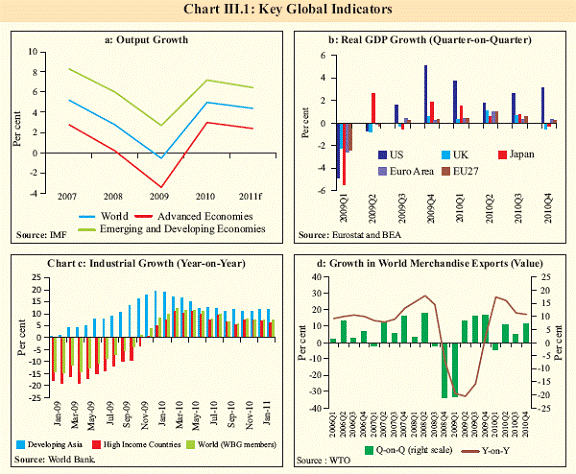
Current account deficit (CAD) moderated in Q3 of 2010-11, reflecting significant acceleration in exports. While concerns on CAD in 2010-11 have receded, the spike in oil prices poses the risk of CAD widening in 2011-12. Capital flows are expected to improve financing the CAD comfortably. However, the dominance of portfolio equity flows and the decline in FDI raise concern over the stability of capital flows. While the earthquake in Japan is unlikely to significantly affect India, risk of further worsening of the geo-political situation in MENA and a possible turnaround in global interest rate cycle would have to be factored into macropolicies. Concerns on CAD have receded, but have not dissipated III.1 Current account deficit (CAD) that amounted to 3.7 per cent of GDP in H1 of 2010- 11 moderated to 2.1 per cent of GDP in Q3 primarily reflecting pick up in exports. With this trend gaining further pace in Q4, the CAD for the full year may settle at around 2.5 per cent of GDP. However, the downward drift could reverse if the current spurt in global crude oil prices persists. With a larger CAD, any abrupt tightening of external financing could put pressure on the exchange rate, raise cost of capital and feed through into inflation. Developments in global economic and financial market conditions could impact the capital account, especially if the central banks in advanced economies (AEs) start withdrawing monetary accommodation. Such a withdrawal, however, is likely to raise global interest rates, reduce leveraged positions in global commodity markets and so help deflate global commodity prices. Global recovery advances but sovereign balance sheets pose risk III.2 The global economic recovery is broadly on track. However, uncertainty remains with significant sovereign and banking sector default risks prevailing in parts of Europe. Furthermore, the recovery continues to move at multi-speed characterised by large output gaps in AEs and closing or closed gaps in emerging market and developing economies (EMDEs). More significantly, unemployment rates have begun to fall in US and Germany. The risk of double dip recession has receded. Nevertheless, stillstagnant real estate markets, stubbornly high unemployment and possibility of contagion from weak sovereign balance sheets of peripheral European countries continue to present major concerns in the AEs. IMF, in April 2011, has projected the world real GDP growth to slow down modestly to 4.4 per cent in 2011 from 5 per cent in 2010 (Chart III.1a). The key downside risk to global growth relates to the potential for oil prices to surprise further on the upside because of supply disruptions. Among the AEs, there was a diverging trend in growth during the fourth quarter vis-à-vis the previous quarter (Chart III.1b). Outlook for capital flows to EMEs suggests
risks from sudden reversals World trade recovery continues, while industrial production regains speed after stagnation III.4 World trade and industrial production slowed during the latter half of 2010, reflecting a global inventory cycle. Recent data show a mixed picture. Industrial production had begun to regain speed at the start of the calendar year (Chart III.1c). However, both the manufacturing and the services Purchasing Managers’ Index had dipped in March 2011 in the aftermath of earthquake in Japan, though the index values suggest continued expansion. Global trade is recovering with the value of world merchandise trade, led by Asia, accelerating perceptibly in the fourth quarter of 2010 compared to the same period of 2009 (Chart III.1d). In volume terms, world trade expanded by 12 per cent in 2010. World imports of EMDEs are back to pre-crisis trends, but those of advanced economies continue to lag. Japan’s disaster is likely to have some impact on East Asian economies, which have strong trade and financial links with Japan, before a reconstruction-led recovery starts.
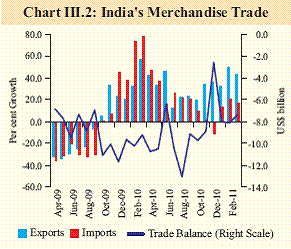
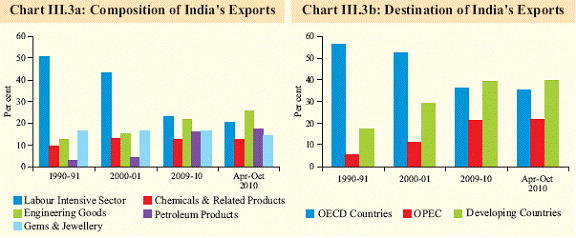
Diversification in India’s exports augurs well for trade balance III.5 The robust growth in India’s exports reflects diversification of products from labour intensive manufactures to higher value-added products in engineering and petroleum sectors and to destinations across emerging markets and developing economies which led to moderation in trade deficit during 2010-11(Charts III.2 and 3).
Impact of MENA unrest significant, that of
Japan will be marginal
CAD moderation aided by net invisibles
receipts too
III.8 Services exports recorded a strong growth during October-December 2010 over the corresponding quarter of the previous year led by travel, transportation, business, financial and software services. While net business services receipts gradually improved over the quarters, software exports rebounded strongly in Q3 of 2010-11. The robust growth in software exports could be attributed to the transformation in Indian information technology (IT) service offerings from application development and maintenance to provision of full servicescomprising testing, infrastructure, consulting and system integration as well as the benefits of geographical diversification. Investment income receipts declined significantly over the corresponding period of the previous year, mainly due to the persistence of lower interest rates abroad. Private transfer receipts continued to be robust during the year so far. On the other hand, invisibles payments in Q3 were also higher due to larger payments under almost all components of invisibles, particularly investment income and business services. Net invisibles balance improved significantly in Q3 of 2010-11 over the corresponding quarter of the preceding year (Table III.3).
Composition and volatility in capital flows
remain a concern
III.10 Certain lead indicators of capital flows suggest that FDI inflows continued to be moderate during Q4 of 2010-11. FII flows also remained moderate being negative initially, but turned positive thereafter. ECB approvals increased on the back of strong domestic demand and interest rate differentials (Table III.5). Notwithstanding some easing of pressures with respect to financing of CAD, the moderation in equity inflows coupled with rising debt flows during 2010-11 so far poses risks to sustainability. Any unforeseen global developments may affect CAD and its financing and, therefore, warrant close monitoring of the evolving situation.
Higher absorption of capital inflows leaves
modest reserve accretion
Indicators of Real Effective Exchange Rate (REER) exhibit appreciation III.12 The real effective exchange rate (REER) indices for 6-currency, 30-currency and 36- currency baskets exhibited appreciation of the Indian rupee during 2010-11. The 6-currency index showed maximum appreciation compared to other indices reflecting higher inflation differential with these countries (Table III.6). The REER appreciation may not have implications for external sector competitiveness as there are a host of other factors such as global recovery leading to a pick-up in demand as well as diversification of the export basket and across destinations and various Government initiatives that have a bearing on the export performance. External debt rises
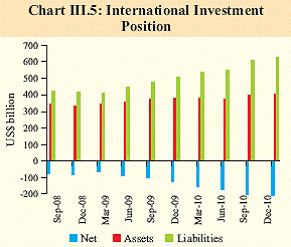
III.14 The debt sustainability indicators witnessed a modest deterioration at end- December 2010 on account of the continued dominance of debt creating flows (Table III.8). Net international liabilities increase
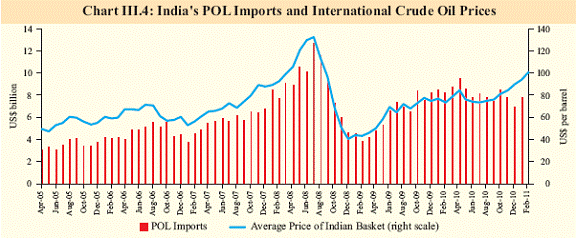
Oil prices and capital flow volatility to shape external balance III.16 Hardening of international crude oil prices on the back of geo-political concerns pose risks to current account balance during 2011-12. Higher growth in software exports and robust transfer receipts may provide some cushion. Financing of the current account, however, may not be a problem as capital flows are likely to improve considering India’s longrun growth prospects and policies supporting FDI, as also larger FII investments in debt markets. Nonetheless, the composition and volatility of capital flows could have implications for external sector vulnerability, warranting close monitoring.
|
|||||||||||||||||||||||||||||||||||||||||||||||||||||||||||||||||||||||||||||||||||||||||||||||||||||||||||||||||||||||||||||||||||||||||||||||||||||||||||||||||||||||||||||||||||||||||||||||||||||||||||||||||||||||||||||||||||||||||||||||||||||||||||||||||||||||||||||||||||||||||||||||||||||||||||||||||||||||||||||||||||||||||||||||||||||||||||||||||||||||||||||||||||||||||||||||||||||||||||||||||||||||||||||||||||||||||||||||||||||||||||||||||||||||||||||||||||||||||||||||||||||||||||||||||||||||||||||||||||||||||||||||||||||||||||||||||||||||||||||||||||||||||||||||||||||||||||||||||||||||||||||||||||||||||||

ఈ పేజీని షేర్ చేయండి:


భారతీయ రిజర్వ్ బ్యాంక్ మొబైల్ అప్లికేషన్ను ఇన్స్టాల్ చేయండి మరియు తాజా వార్తలకు త్వరిత యాక్సెస్ పొందండి!
మా యాప్ను ఇన్స్టాల్ చేయడానికి QR కోడ్ను స్కాన్ చేయండి


పేజీ చివరిగా అప్డేట్ చేయబడిన తేదీ:


