 IST,
IST,
III. The External Sector
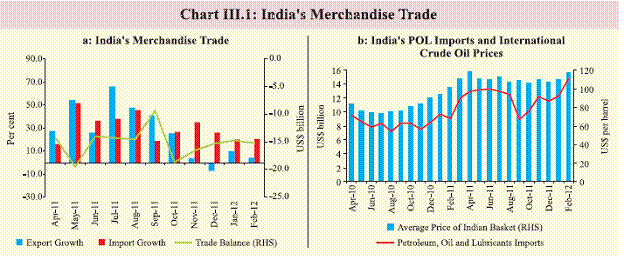
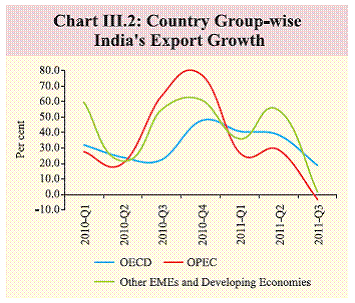
The balance of payments (BoP) came under significant stress in Q3 of 2011-12. Net capital inflows fell short of the current account deficit (CAD), resulting in a substantial drawdown of reserves. A wider CAD, rising external debt, weakening net international investment position (NIIP) and deteriorating vulnerability indicators underscore the need for greater prudence in external sector and demand management policies. While capital inflows have improved in Q4, global uncertainties, moderation in the economic growth of emerging and developing economies (EDEs), which now have a significant share in India’s exports and persistently high oil prices generate downside risks to the external outlook. BoP comes under stress, warrants caution III.1 The balance of payments (BoP) came under stress during Q3 of 2011-12 due to deterioration of the trade balance and moderation in capital inflows. The trade balance deteriorated despite the depreciation of the rupee in the quarter, due to the inelastic nature of some of India’s imports, as well as a slowdown in exports that reflected global uncertainty. The full year CAD for 2011-12 is likely to be substantial. Going forward, the CAD may still remain under pressure if import of oil and gold does not significantly moderate. Robust gold demand and continuing high crude oil prices, along with decelerating growth in EDEs may adversely affect India’s trade balance. A cautious approach with regard to trade and capital accounts is, therefore, required. III.2 Subdued global trends also adversely affected capital inflows to India in Q3, in line with the trend witnessed in some other EDEs. Even though capital inflows improved in Q4 of 2011-12, the continuation of the trend hinges on the pace of global and domestic economic recovery as well as policy reform initiatives. Risks to capital inflows exist from both global growth slowing down significantly as well as US growth rebounding substantially. Trade deficit widening despite weaker rupee and slower growth III.3 India’s trade deficit widened considerably during April-February 2011-12 compared with the corresponding period of the previous year, owing to subdued export growth coupled with high imports (Table III.1 and Chart III.1). Notwithstanding the rupee depreciation, the trade deficit increased primarily due to a slowdown in global demand, inadequate passthrough of higher global oil prices and the relatively price inelastic nature of some of India’s imports, viz., gold and silver. Even the growth in non-oil non-gold imports remained sizeable despite signs of a slowdown in the domestic economy. Given the adverse global environment and elevated global crude oil prices, India’s trade deficit may remain high in near future. A slight moderation may, however, be expected in imports of gold following the increase in import duty announced in the Union Budget for 2012-13. Export growth may weaken despite continued trade diversification III.4 India took major strides in diversifying its export markets in recent years. A shift in the share from traditional markets in advanced economies to new markets in EDEs is clearly discernible. However, exports to all major group of economies slowed due to euro area crisis in Q3 of 2011-12 (Chart III.2). Growth deceleration in exports to the OPEC and EDEs was, however, more pronounced than that for the OECD economies. Notwithstanding the slowdown, EDEs continued to account for a major share of 42.7 per cent in India’s exports. It may be noted that within the group of EDEs, the respective shares of the African and Latin American economies increased in Q3 of 2011-12. If growth in India’s major trading partner economies continues to remain sluggish, as projected by the IMF, India’s export growth may decelerate further.
Persistently wide CAD has implications for external resilience III.5 The current account deficit (CAD) widened further in Q3 of 2011-12 reflecting the impact of continuing global uncertainties as well as domestic factors. The CAD at 4.3 per cent of GDP in Q3 of 2011-12 was significantly higher than 2.3 per cent recorded in Q3 of 2010- 11 (Table III.2). The widening of CAD to these levels does pose a challenge for external sector management. Moderation in capital and finance account (excluding change in reserves) necessitated the financing of CAD by drawing down foreign exchange reserves in Q3 of 2011- 12, which shows the weakening external resilience of the Indian economy (Table III.3). Capital flows responded to policy measures III.6 Capital inflows remained subdued in Q3 amidst fragile global financial conditions, the euro area crisis and a worsening global economic outlook. Recognising the impact of global developments, various measures were undertaken in Q2 and Q3 to facilitate inflows: deregulation of interest rates on rupee denominated NRI deposits and enhancing the all-in-cost ceiling for ECBs with average maturity of 3-5 years. Furthermore, the lock-in period of long-term infrastructure bonds for FIIs (up to US$ 5 billion within the overall ceiling of US$ 25 billion) was reduced to one year, and ceilings for FIIs in government securities and corporate bonds were raised by US$ 5 billion each. Capital flows under these segments responded positively to the policy measures. FII inflows picked up significantly, in both equity and debt, in January and February, while FDI inflows remained broadly stable. Besides, while ECB inflows improved in Q4, NRI deposits remained stable (Table III.4). Trends in capital flows in coming quarters, however, will largely depend on global and domestic economic and financial conditions, including the pace of domestic policy reforms. It must be noted that even though debt inflows provide a means for financing the CAD, they have implications for India’s external debt position and, consequently, for financial stability.
Rupee recovers in Q4 of 2011-12 after being volatile in Q3 III.7 In nominal terms, the rupee generally depreciated against the US dollar from the last week of August 2011 to mid-December 2011 after being largely range bound during the first four months of 2011-12. Subsequently, the exchange rate stabilised in response to the measures undertaken by the Reserve Bank and the government aimed at improving dollar supply in the foreign exchange market as also to curb speculation. The magnitude of the intervention by the Reserve Bank, which amounted to over US$ 20 billion up to February 2012, also helped to reduce volatility in the foreign exchange market. The cumulative impact of these measures considerably reversed the movement of the rupee against the US dollar from the historical low of `54.2 per US dollar on December 15, 2011 to `49.7 per US dollar by end-January 2012. The rupee have weakened somewhat recently as a result of volatility of capital flows.
III.8 The real effective exchange rate (i.e., REER based on 6, 30 and 36 currency baskets) witnessed appreciation in Q4 reflecting the recovery of the rupee in nominal terms that emanated from the impact of policy measures to improve dollar supply in the foreign exchange market (Table III.5). Increase in external debt as ECB and short -term debt rise III.9 India’s external debt increased to US$ 335 billion at end-December 2011 from US$ 324 billion at end-September 2011 largely reflecting a sharp increase in ECB and short term debt (Table III.6). Keeping in view the developments in international financial markets and global economic conditions, the Reserve Bank enhanced the all-in-cost ceiling on ECBs and deregulated interest rates on NRE and NRO accounts. The full year external debt is likely to be higher reflecting greater reliance on debt flows to finance CAD. Nonetheless, it is expected that external debt will remain at a manageable level.
External vulnerability indicators show deterioration III.10 The key external sector vulnerability indicators worsened in Q3 of 2011-12 (Table III.7). The reserve cover of imports, the ratio of short-term debt to total external debt, the ratio of foreign exchange reserves to total debt, and the debt service ratio deteriorated during the quarter. India’s net international investment position (NIIP) also weakened as net liabilities increased to US$ 216 billion at end-December 2011 from US$ 204 billion at end-September 2011. As a result, the NIIP-GDP ratio deteriorated moderately in Q3 (Table III.8).
III.11 With significant downside risks to India’s external sector, caution is warranted in external sector policies and aggregate demand management so that CAD does not widen further and the external account parameters remain at prudent levels. In this regard, steps need to be taken to facilitate a complete passthrough of international commodity prices, especially by raising domestic prices of petroleum products, curb the demand for precious metals and accelerate reforms to attract FDI. |
|||||||||||||||||||||||||||||||||||||||||||||||||||||||||||||||||||||||||||||||||||||||||||||||||||||||||||||||||||||||||||||||||||||||||||||||||||||||||||||||||||||||||||||||||||||||||||||||||||||||||||||||||||||||||||||||||||||||||||||||||||||||||||||||||||||||||||||||||||||||||||||||||||||||||||||||||||||||||||||||||||||||||||||||||||||||||||||||||||||||||||||||||||||||||||||||||||||||||||||||||||||||||||||||||||||||||||||||||||||||||||||||||||||||||||||||||||||||||||||||||||||||||||||||||||||||||||||||||||||||||||||||||||||||||||||||||||||||||||||||||||||||||||||||||||||||||||||||||||||||||||||||||||||||||||||||||||||||||||||||||||||||||||||||||||||||||||||||||||||||||||||||||||||||||||||||||||||||||||||||||||||||||||||||||||||||||||||||||||||||||||||||||||||||||||||||||||||||||||||||||||||||||||||||||||||||||||||||||||||||||||||||||||||||||||||||||||||||||||||||||||||||||||||||||||||
పేజీ చివరిగా అప్డేట్ చేయబడిన తేదీ:


