equity capital so as
to adequately capitalise them, SIDBI set up a fund of Rs. 50 crore which was christened
as SIDBI Growth Fund for MFIs. The fund takes care of equity investment in large
corporate MFIs, as also equity capital in start-up/smaller institutions, along
with quasi-equity support for MFIs on the verge of transformation.
5.48
SIDBI also supports incubation of potential local community based organisations
through two-tier/umbrella NGOs/MFIs. The approach not only helps SIDBI to increase
its outreach through double intermediation but also enables it to channelise finance
to smaller NGOs that otherwise may not meet the criteria for availing direct assistance
from SIDBI. SIDBI has also been able to nurture and develop a few new intermediaries
set up by experienced professionals. Another approach in this direction involves
incubation of new start-up MFIs promoted by first-generation development/micro
finance professionals. The incubation support is either given through well-reputed
management institutes or through institutions specialising in capacity building
and technical support services.
5.49 As at March 31, 2008, the SIDBI
had 58 partners in the underserved States, out of its total partner base of 104.
The increased thrust on development of underserved States has also resulted in
the share of these States going up from 19 per cent (Rs.38 crore) in the total
outstanding micro finance portfolio of SIDBI in the financial year 2005 to over
31 per cent (Rs.299 crore) in the financial year 2007-08.
5.50 Substantial
growth of the micro finance sector would be possible only if the capacities of
all stakeholders are built up adequately. SIDBI has taken some initiatives in
this direction. One such initiative has been in the area of human resources where
SIDBI has tried to address the issue both from the demand and supply side factors.
On the demand side, MFIs are encouraged to hire young management/accounting graduates
from reputed institutes through campus placement and SIDBI provides partial salary
support for these young professionals (YPs) for a period of two years. Additionally,
MFIs are also provided grant funds for hiring trained and experienced professionals
as second line managers. This helps in bringing and retaining the talent in the
micro finance sector. On the supply side, some of the management training institutes
have been provided support in the form of training and exposure visit of their
faculty members to reputed national and international training programmes and
other MFIs across the world. Besides, SIDBI was instrumental in bringing international
experts to lend support to these institutes for developing a course on micro finance
that has been incorporated as an elective in their rural management courses.
5.51 Other major initiatives towards capacity building of the sector comprised
developing the capacities of consultants and technical service providers (TSPs),
developing a common chart of accounts for the sector, creating gender and environment
awareness, promoting innovations and action research on emerging concepts.
Regulation of Micro Finance Institutions
5.52 The rapid
growth of the micro finance sector and varied number of micro finance providers
influencing the lives of millions of clients have necessitated the need for regulating
the sector. In India, micro finance is provided by a variety of entities. These
include banks (including commercial banks RRBs and co-operative banks), primary
agricultural credit societies, SHGs linked to banks and MFIs that include NBFCs,
Section 25 companies, trusts and societies as also co-operatives (under MACS).
Currently, banks and NBFCs fall under the regulatory purview of the Reserve Bank.
Other entities are covered in varying degrees of regulation under the respective
State legislations. There is no single regulator for this sector. In this context,
for the orderly growth and development of the sector, the Government of India
has proposed a legislation and formulated a Micro Financial Sector (Development
and Regulation Bill), 2007 which is under consideration of the Parliament. The
Bill envisages NABARD to be the regulator and provides that all micro finance
organisations desirous of offering thrift services may get registered with NABARD.The
legislation, however, is yet to be enacted (Refer Chapter II, para 2.219).
5.53 In the meantime, formulation of a code of ethics has been formulated
by Sa-Dhan in 2007, to be followed by their member institutions (Box
V.4).
Micro Insurance
5.54 Social security in the
form of micro insurance can be a boon for the poor, when the income raising ability
of the bread winner is impaired. In India, the micro insurance schemes are mostly
implemented by the MFIs as a compulsory element along with the micro credit provided.
Micro insurance schemes can be considered as a stepping stone to social protection.
One of the best examples of micro insurance scheme is the one which is linked
to the Grameen Bank scheme in Bangladesh. Grameen established
a separate organisation called Grameen Kalyan (village welfare) which
uses the women groups for the collection of annual premiums for micro insurance.
5.55 With the recent arrival of a number of private insurance companies in
India, there has been significant innovation in new product development, as well
as delivery in the insurance sector. Several MFIs are entering the domain of micro
insurance. However, the sector is still in its early days and evolving rapidly.
More than half of the 83 MFIs that responded to a Sa-Dhan study in 2005 were offering
insurance, with life insurance being more widespread than non-life insurance.
Insurance Regulatory Development Agency (IRDA)’s micro insurance regulations
of November 2005 formally recognised NGOs, SHGs and MFIs as “micro insurance
agents” for acting as intermediaries between insurance companies and beneficiaries.
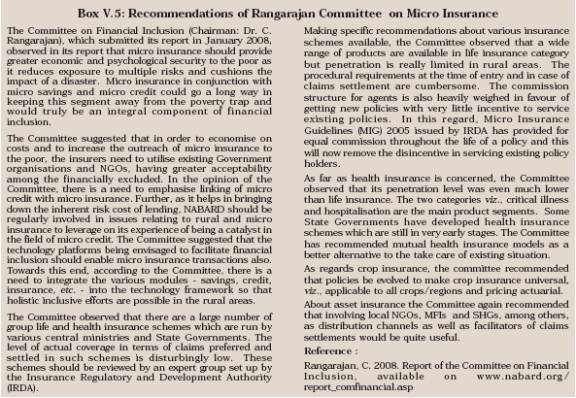
The Committee on Financial Inclusion (Chairman: Dr. C. Rangarajan), which submitted
its report in January 2008, highlighted the importance of micro insurance and
made wide ranging recommendations in this regard (Box V.5).
5.56 Generally, micro insurance schemes cover health care, life, accident
expenses, maternity protection and disability. Both the public sector and private
sector insurance companies have tied up with various MFIs in the country to offer
micro insurance schemes. One of the difficulties in the implemention of micro
insurance scheme is that poor have a lesser understanding of risk pooling and
are often reluctant to join schemes where payments have to be made with no immediate
returns.
4. Progress of Micro Finance in India
5.57 The micro finance movement has come a long way since its inception in
the early 1990s and has assumed enormous significance in the delivery of credit
to the hitherto excluded sections of the population. While the SBLP has emerged
as the most dominant model, the MFI model has also been gaining importance. 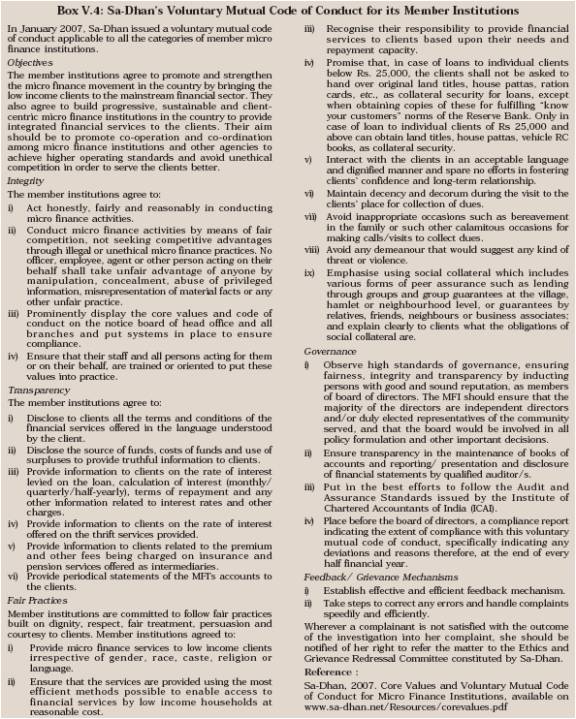
SHG-Bank
Linkage Programme Approach
5.58 The SBLP has
made considerable progress since its inception in the early 1990s, both in terms
of the number of SHGs credit linked with banks as also the bank loans disbursed
by SHGs. The cumulative number of SHGs credit linked with banks increased sharply
from 33,000 in 1992-99 to 264,000 in 2000-01 and further to 2,239,000 in
2005-06. During the above period, the cumulative bank loans disbursed to SHGs
also witnessed a sharp increase from Rs. 57 crore in 1992-99 to Rs.481 crore in
2000-01 and further to Rs.11,398 crore in 2005-06 (Table V.1
and Chart V.1).
5.59 The provisional data available
so far indicates that during the year 2007-08, 552,992 new SHGs were provided
with bank loan and 186,883 existing SHGs with repeat loans. Total bank loans disbursed
during the year were at Rs.4,228 crore, of which repeat bank loans to existing
SHGs were at Rs.1,686 crore. The growth of number of SHGs has decelerated in recent
years, particularly in the southern region, where rapid progress was made earlier.
The scheme is catching up slowly in the northern region. The MFIs have also expanded
their operations, which might have impacted the growth of the SBLP to some extent.
5.60 In terms of relative shares of different agencies,
commercial banks continued to account for the largest share, both in terms of
number of SHGs credit linked and bank loans disbursed, followed by regional rural
banks and co-operative banks (Table V.2). Among the commercial
banks, public sector banks accounted for the largest share of loans disbursed
to SHG sector (88.8 per cent) in 2006-07. Out of the total loans disbursed by
the commercial banks, 86.9 per cent of the loans were disbursed exclusively to
women SHGs (Appendix
V.1).
Table
V.1: SHG-Bank Linkage Programme* | (Amount
in Rs. crore) | Year | | Total
SHGs financed by | Bank
Loans | Refinance |
| | banks
(in '000) | | | | |
| | During | Cumulative | During | Cumulative | During | Cumulative |
| | the
year | | the
year | | the
year | |
1 | | 2 | 3 | 4 | 5 | 6 | 7 |
1992-99 | | 33 | 33 | 57 | 57 | 52 | 52 |
1999-00 | | 82 | 115 | 136 | 193 | 98 | 150 |
| | (147.9) | (247.9) | (138.1) | (238.1) | (88.5) | (188.5) |
2000-01 | | 149 | 264 | 288 | 481 | 244 | 394 |
| | (82.3) | (129.9) | (112.0) | (149.2) | (149.0) | (162.7) |
2001-02 | | 198 | 461 | 545 | 1,026 | 395 | 790 |
| | (32.6) | (74.9) | (89.0) | (113.4) | (61.9) | (100.5) |
2002-03 | | 256 | 717 | 1,022 | 2,049 | 622 | 1,412 |
| | (29.5) | (55.4) | (87.0) | (99.6) | (57.2) | (78.7) |
2003-04 | | 362 | 1,079 | 1,856 | 3,904 | 705 | 2,118 |
| | (41.4) | (50.4) | (81.0) | (90.6) | (13.3) | (50.0) |
2004-05 | | 539 | 1,618 | 2,994 | 6,898 | 968 | 3,086 |
| | (49.1) | (50.0) | (61.0) | (76.7) | (37.3) | (45.7) |
2005-06 | | 620 | 2,239 | 4,499 | 11,398 | 1,068 | 4,153 |
| | (15.0) | (38.3) | (50.3) | (65.2) | (10.3) | (34.6) |
2006-07 | | 1,106 | – | 6,570 | – | 1,293 | 5,446 |
2007-08 P | 740 | – | 4,228 | – | 1,616 | 7,062 |
P : Provisional.
–
: Not Available
* : Relating to commercial banks, RRBs and Co-operative banks.
Note :
1. From 2006-07 onwards, data on number of SHGs financed
by banks and bank loans are inclusive of ‘Swarnjayanti Gram Swarozgar
Yojna’ (SGSY) SHGs and existing groups receiving repeat loans. Owing
to this change, NABARD discontinued the publication of data on a cumulative basis
from 2006-07. As such data for 2006-07 onwards are not comparable with the data
in the previous years.
2. Figures in parentheses indicate percentage variations
over the year.
Source : NABARD. | 
5.61
Under the SBLP, as on March 31, 2007, 2.9 million SHGs had outstanding bank loans
of Rs.12,366 crore (Table V.3).
5.62 Of the three models
under the SBLP, the Model II, viz., SHGs promoted by NGOs/ Government
agencies and financed by banks has emerged as the most dominant model in the case
of India (Table V.4).
Table
V.2: Agency-wise SHG -Bank | Linkage
Position | (Amount
in Rs. crore) | Agency | SHGs
Credit | Bank
Loan | | Linked
(in '000) | Disbursed |
| 2006-07 | 2007-08P | 2006-07 | 2007-08P |
1 | 2 | 3 | 4 | 5 |
Commercial Banks | 572 | 312 | 3,919 | 2,043 |
| (52) | (42) | (60) | (48) |
RRBs | 381 | 241 | 2,053 | 1,599 |
| (34) | (33) | (31) | (38) |
Co-operative Banks | 153 | 187 | 599 | 586 |
| (14) | (25) | (09) | (14) |
Total | 1,106 | 740 | 6,570 | 4,228 |
P : Provisional data. | | | | |
Note :
1)
Figures in parentheses are percentage shares in the respective total.
Source
: NABARD. |
Table
V.3: Bank Loans Outstanding under SBLP | (as
at end-March 2007) | (Amount
in Rs. crore) | Agency | No.
of | Loans |
| SHGs | Outstanding |
1 | 2 | 3 |
Commercial Banks | 1,893,016 | 8,760 |
| (65.4) | (70.8) |
Regional Rural Banks | 729,255 | 2,802 |
| (25.2) | (22.7) |
Co-operative Banks | 272,234 | 804 |
| (9.4) | (6.5) |
Total | 2,894,505 | 12,366 |
| (100.0) | (100.0) |
Note : Figures
in parentheses are percentages to the respective totals.
Source :
NABARD. | 5.63 The region-wise pattern
of SHGs linked to banks showed greater concentration in the southern region, although
the spatial disparity has declined in the last few years with some increase in
the share of other regions, particularly the eastern region (Table
V.5).
5.64 In order to scale up efforts and reduce the regional imbalances
in outreach, 13 non-south Indian States (Assam, Bihar, Jharkhand, Gujarat, Himachal
Pradesh, Maharashtra, Madhya Pradesh, Chattisgarh, Orissa, Rajasthan, Uttar Pradesh,
Uttaranchal and West Bengal) with high incidence of rural poverty and where the
micro finance movement had not taken roots were identified by NABARD. Special
efforts by NABARD resulted in an increase in the number of SHGs credit linked
in these States from 100 thousand as on March 31, 2002 to 1.4 million as on March
31, 2007. Thus, the spread of the programme in the 13 States led to a significant
decline in the share of the southern States in SHGs linked to banks.
5.65 As on March 31, 2007, the number of SHGs maintaining
savings bank accounts with the banking sector was 4.2 million with outstanding
savings of Rs. 3,513 crore, thereby covering more than 58 million poor households
under the programme. Commercial banks had the maximum share of the SHG’s
savings (53.9 per cent), followed by RRBs (32.9 per cent) and co-operative banks
(13.2 per cent) (Table V.6). Among the commercial banks, the
public sector banks accounted for the largest share of savings (95.9 per cent),
while private sector banks accounted for marginal share (4.1 per cent). It is
noteworthy that around 87.3 per cent of the savings were by exclusive women SHGs
(Appendix V.2).
Table
V.4: Model-wise Cumulative Linkage Position | (as
at end-March) | Model
Type | 2004 | 2005 | 2006 |
| | No.
of | Bank | No.
of | Bank | No.
of | Bank |
| | SHGs | loans | SHGs | loans | SHGs | loans |
| | ('000) | (Rs.
crore) | ('000) | (Rs.
crore) | ('000) | (Rs.
crore) | | 1 | 2 | 3 | 4 | 5 | 6 | 7 |
(i) | Model
I- SHGs promoted, guided | 218 | 550 | 343 | 1,013 | 449 | 1,637 |
| and
financed by banks | (20.0) | (14.0) | (21.2) | (14.7) | (20.1) | (14.4) |
(ii) | Model
II- SHGs promoted by NGOs/ | | | | | | |
| Government
agencies and | 777 | 3,165 | 1,158 | 5,529 | 1,646 | 9,200 |
| financed
by banks | (72.0) | (81.0) | (71.6) | (80.2) | (73.5) | (80.7) |
(iii) | Model
III- SHGs promoted by NGOs and | | | | | | |
| financed
by banks using NGOs/ | | | | | | |
| formal
agencies as financial | 84 | 189 | 117 | 356 | 143 | 561 |
| intermediaries | (8.0) | (5.0) | (7.2) | (5.2) | (6.4) | (4.9) |
| | | | | | | |
Total (i+ii+iii) | 1,079 | 3,904 | 1,618 | 6,898 | 2,239 | 11,398 |
Note :
1. NABARD has changed the data reporting format since 2006-07 and now
does not publish model-wise cumulative figures relating to |
SHG Bank Linkage Programme. |
2. Figures in parentheses
are percentages to the respective total. | Source
: NABARD. |
Table
V.5: Regional Pattern of SBLP | (as
at end-March) | (Per
cent to total ) | Region | 2001 | 2002 | 2003 | 2004 | 2005 | 2006 |
1 | 2 | 3 | 4 | 5 | 6 | 7 |
Northern | 3.4 | 4.2 | 4.9 | 4.9 | 5.3 | 5.9 |
North-Eastern | 0.2 | 0.3 | 0.6 | 1.1 | 2.1 | 2.8 |
Eastern | 8.4 | 9.9 | 12.7 | 14.7 | 16.4 | 17.6 |
Central | 10.9 | 10.4 | 11.4 | 11.8 | 12.2 | 12.0 |
Western | 5.9 | 6.4 | 5.9 | 5.1 | 5.9 | 7.4 |
Southern | 71.1 | 68.8 | 64.6 | 62.5 | 58.0 | 54.3 |
All-India | 100.0 | 100.0 | 100.0 | 100.0 | 100.0 | 100.0 |
Source : NABARD. |
5.66 About 37 per cent of banks reported recovery
of above 95 per cent under the programme, 36 per cent banks reported recovery
in the range of 80-94 per cent and another 20 per cent banks reported recovery
in the range of 50-79 per cent. Some differences were observed in recovery rates
of commercial banks, co-operative banks and regional rural banks (Table
V.7). While the recovery rate of public sector banks varied between
52 per cent and 99 per cent, the same of private sector banks varied between 60
per cent and 100 per cent. Out of the 26 private sector banks, the recovery rate
of four banks was 100 per cent (Appendix
V.3).
5.67 Many groups promoted under various Government sponsored
programmes also constituted a part of the SBLP. As on March 31, 2007, the number
of SHGs having outstanding bank loans under the were at 700 thousand constituting
23.7 per cent of the total SHGs under the SBLP. The loan amount outstanding under
these SGSY loans were Rs.3,273 crore which constituted 26.5 per cent of the total
amount outstanding under the SBLP.
Swarnjayanti Gram
Swarozgar Yojana (SGSY)
Table
V.6: Savings of SHGs with Banks(as at end-March 2007) |
(Amount
in Rs. crore) | Agency | Total
Savings | Exclusive
Women SHGs | | No.
of SHGs | Amount
of Outstanding | No.
of SHGs | Amount
of Outstanding | | | Savings | | Savings |
1 | 2 | 3 | 4 | 5 |
Commercial Banks | 2,293,771 | 1,892 | 1,794,720 | 1,651 |
| (55.1) | (53.9) | (54.9) | (54.6) |
Regional Rural Banks | 1,183,065 | 1,158 | 974,811 | 1,043 |
| (28.4) | (32.9) | (29.8) | (34.5) |
Co-operative Banks | 683,748 | 462 | 501,708 | 331 |
| (16.4) | (13.2) | (15.3) | (10.9) |
Total | 4,160,584 | 3,513 | 3,271,239 | 3,025 |
| (100.0) | (100.0) | (100.0) | (100.0) |
Note
:
Figures in parentheses are percentages to the respective totals.
Source : NABARD | MFI Approach
5.68 The emerging role of MFIs as institutions other than banks engaged in
providing financial services to the poor is being recognised and the banking sector
has been extending loans to MFIs for on-lending to SHGs. During the year 2006-07,
bank loans amounting Rs. 1,152 crore were disbursed to 334 MFIs, taking the total
loans outstanding to Rs.1,584 crore to 550 MFIs as on March 31, 2007
(Table V.8 ).
Table
V.7: Recovery Performance of Bank Loans to SHGs |
(as at end-March
2007) | (No
of banks) | Agency | Total
No. of
Reporting Banks | Recovery
Performance of Bank Loans to | SHGs |
95 per cent | 80-94 | 50-79 | less
than 50 | | | and
above | per
cent | per
cent | per
cent | 1 | 2 | 3 | 4 | 5 | 6 |
Commercial Banks | 36 | 11 | 15 | 10 | 0 |
| | (30.6) | (41.7) | (27.8) | (0.0) |
Regional Rural Banks | 73 | 20 | 35 | 13 | 5 |
| | (27.4) | (47.9) | (17.8) | (6.8) |
Co-operative Banks | 181 | 76 | 55 | 35 | 15 |
| | (42.0) | (30.4) | (19.3) | (8.3) |
Total | 290 | 107 | 105 | 58 | 20 |
| | (36.9) | (36.2) | (20.0) | (6.9) |
Note : Figures
in parentheses indicate percentage shares in agency-wise totals.
Source
: NABARD |
Table
V.8: Bank Loans Provided to MFIs | (as
at end-March 2007) | (Amount
in Rs. crore) | Agency | Loans
Disbursed
By Banks to
MFIs during
2006-07 | Outstanding
Bank
Loans to
MFIs as on
March 31,2007 | | No.
of | Amount | No.
of | Amount |
| MFIs | | MFIs | |
1 | 2 | 3 | 4 | 5 |
Commercial Banks | 327 | 1,151 | 541 | 1,584 |
Regional Rural Banks | 7 | 0.2 | 8 | 0.2 |
Co-operative Banks | – | – | 1 | 0.01 |
Total | 334 | 1,152 | 550 | 1,584 |
– : Nil/ Negligible. | | | | |
Note:
1) Figures may not add up to their respective total due to
rounding off.
2) The actual number of MFIs would be less as some MFIs
have availed loans
from more than one bank.
Source : NABARD. |
5.69 The Reserve Bank carried out a survey of MFIs in 2007, which revealed
that most of the MFIs have a good recovery rate. Commercial banks remained the
most important source of funds for almost all the MFIs. Even though some complaints
regarding high interest rates and forcible loan recovery were registered in some
parts of the country, most of the borrowers reported that it was easy or very
easy to get a loan from MFIs (Box V.6).
5.
Micro Finance in India - Impact
5.70 There are several
instances of experiments of SHGs that have made a positive impact on the income
and employment situation of the poor (Box V.7).
5.71 A few assessment studies have been carried out on the impact of the SBLP
in India at the grassroot level. Puhazhendi and Satyasai (2000)1 observed a shift
towards higher income slabs between pre and post-SHG situation. About 74 per cent
of the sample households were below an annual income level of Rs.22,500 during
pre-SHG situation. The proportion declined to 57 per cent in the post-SHG situation
indicating increased income levels. Further, involvement in the group significantly
contributed to improving the self-confidence of the members. The communication
with other group members also improved after association with the SHGs. The members
were relatively more assertive in confronting with social evils and problematic
situations. 5.72 In another assessment, Puhazhendi and Badatya (2002)2 found that
availing loans from moneylenders and other informal sources with higher interest
rates was significantly reduced due to SHG intervention. It was also observed
that consumption oriented loans were replaced by production oriented loans during
post-SHG situation.
5.73 Some studies have also indicated that the size
of the loans is small and is often not sufficient to take up income generating
activities. As a result, the loans are utilised for consumption purposes or for
taking up subsistence-income generating activities.
5.74 The study conducted
by EDA Rural Systems and APMAS (2006) brought out that a significant proportion
of sampled groups (40 per cent) had a weak record of account keeping.The study
pointed out that financial statements are not being regularly prepared by the
SHGs. Only 28 per cent of the SHGs (22 per cent in the South and 35 per cent in
the North) prepared an income and expenditure statement and an equal number
of SHGs prepared a balance sheet and portfolio information. While members were
usually able to provide approximate figures of total savings and total SHG loans
outstanding, they were not able to provide information about profits earned or
loan outstanding to banks. Further, the SHGs do not have a clear policy on how
to deal with defaults or with dropouts, which formed about 10 per cent of membership. 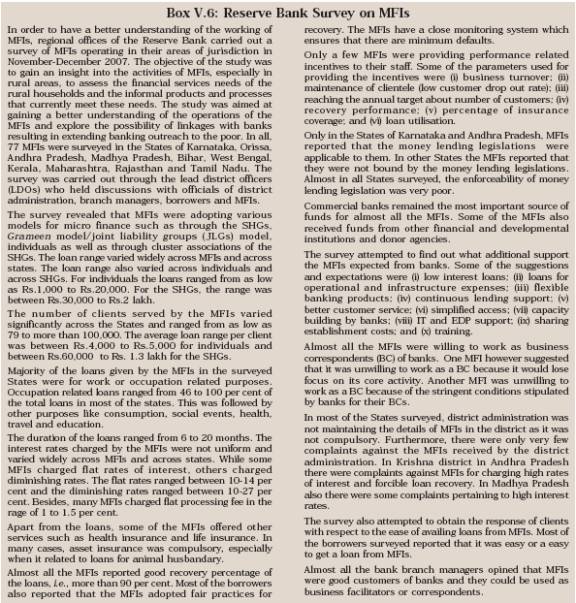
5.75
The study also observed that 30 per cent of SHGs in the sample were involved in
community actions. These involved improving community services (43 per cent of
the total actions, including water supply, education, health care, veterinary
care, village road), trying to stop alcohol sale and consumption (31 per cent),
contributing finance and labour for new infrastructure (12 per cent), protecting
natural resources and acts of charity (to non-members). The most common type of
action taken up by SHGs was the attempt to close down local liquor outlets. 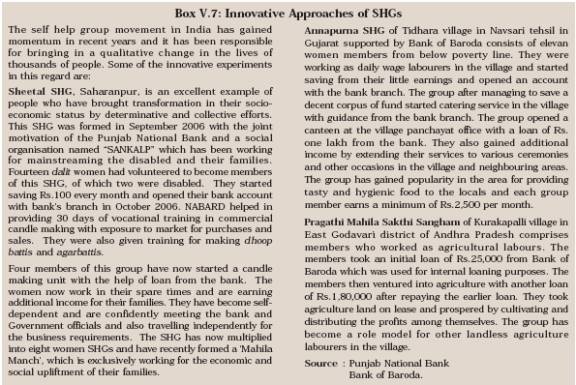
5.76
The study also pointed out that such community actions inculcated a new boldness
and confidence amongst women, often putting pressure on the authorities (panchayat,
district officers and police) to do their jobs, whether through petitions or by
staging rallies and blockades.
5.77 Some of the States like Andhra Pradesh
are trying to implement various developmental and poverty alleviation schemes
through SHGs.
5.78 To sum up, micro finance has come of age in India.
Although it is not a panacea for the poor, it has now developed into an important
delivery mechanism for reaching the poor and achieving financial inclusion. Studies
have brought out the positive impact of micro finance on participating clients.
As such, its role in enhancing human capital in the long-term would be considerable.
It has particularly helped women to become owners of assets, have an increased
say in decision making and take up leadership positions. The challenges facing
the sector are being addressed on a continuing basis, in consultation with all
stakeholders.
1 Puhazhendi, V. and K. J. S. Satyasai,
2000, Microfinance for Rural People: An Impact Evaluation, NABARD
2 Puhazhendi, V. and K. C. Badatya, 2002, SHG Bank Linkage Programme
for Rural Poor-An Impact Assessment, available on www.microfinancegateway.org |
 IST,
IST,


