 IST,
IST,


Consumer Confidence Survey - Q2:2013-14 to Q1:2014-15
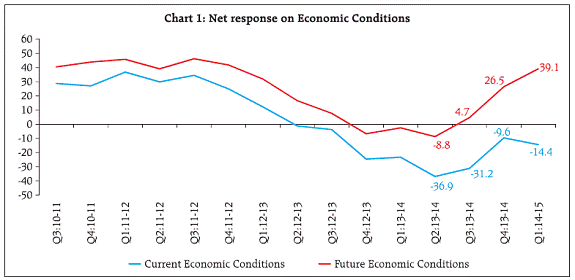
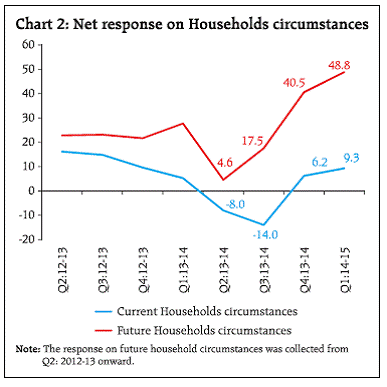
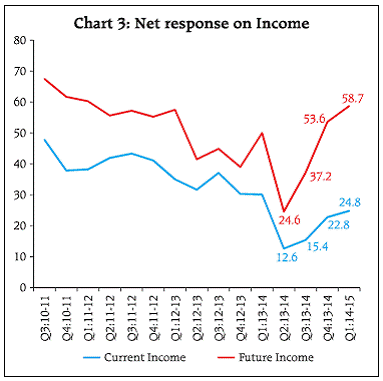
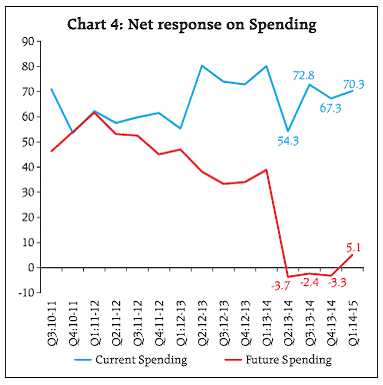
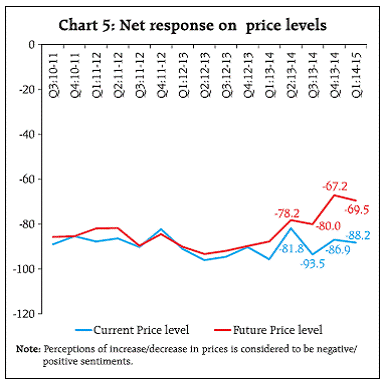
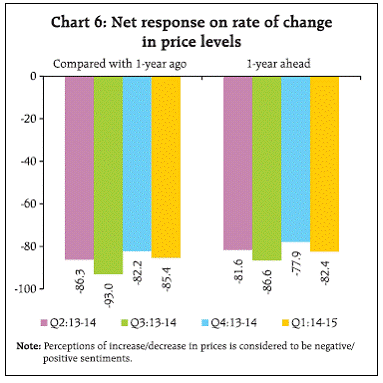
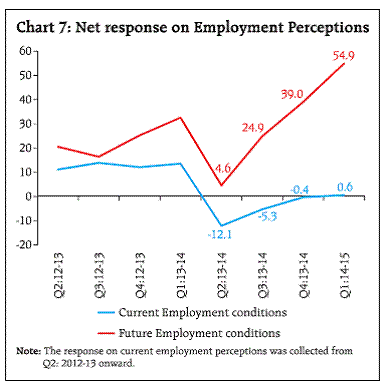
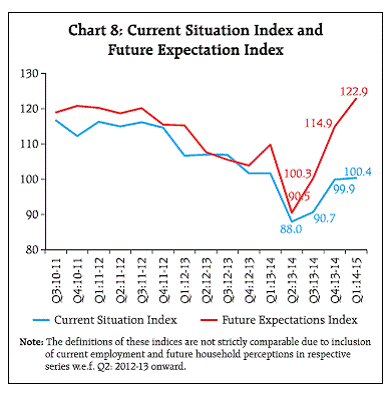
1. Introduction The Reserve Bank has been conducting Consumer Confidence Survey (CCS) on a quarterly basis since June 2010.The survey captures qualitative responses on questions pertaining to economic conditions, household circumstances, income, spending, prices and employment prospects. The survey results are based on the views of the respondents and are not necessarily shared by the Reserve Bank of India. The responses are analysed in two parts, viz., current situation as compared with a year ago and expectations for a year ahead. The quarterly results of CCS are released on the RBI website. This article presents analysis of survey results covering a longer time period, with particular focus on the last four rounds (Q2: 2013-14 to Q1:2014-15) of the survey. 2. Sample Coverage and Survey Questionnaire The survey is conducted in six metropolitan cities, viz., Bengaluru, Chennai, Hyderabad, Kolkata, Mumbai and New Delhi. In each round of survey, 5,400 respondents are selected (900 respondents from each city). A two stage sampling design is adopted for the survey. At the first stage in a city, the polling booths are selected using systematic random sampling technique, after arranging these according to various constituencies. In order to ensure wide geographical coverage, 45 polling booths spread over the entire city are selected. From each polling booth area, 20 respondents are selected following the right hand rule. The survey schedule is organised into four blocks covering the respondent’s details, economic conditions, household circumstances and general views on income, spending etc. and perceptions on price level. From Q2:2012-13 (10th round) onwards, the survey schedule was modified to include perceptions on future household circumstances, outlay for major expenditures viz., motor vehicle, house, consumer durables, etc., current employment scenario and current/future rate of price change. Qualitative information is obtained on a three point scale i.e. positive/no change/ negative. Box 1 Consumer confidence is considered to be a leading indicator of economic trends. With globalisation greater liberalisation of the domestic financial system and increasingly deregulated markets, need for quick and forward looking information has increased. Many developed economies conduct consumer confidence surveys. Some of the leading surveys are given below: USA: Two institutions viz., the Conference Board and University of Michigan collect 5,000 and 500 respondents’ views respectively and compiles consumer confidence index on monthly basis. University of Michigan captures information on current family finances, future family finances, future business conditions, future national economy and current buying conditions parameters. The Conference Board collates information on current business conditions, business conditions for the next six months, current employment conditions and employment conditions for the next six months and total family income for the next six months. Japan: Bank of Japan collects around 5,000 respondents’ view and compiles consumer confidence index on monthly basis. Survey schedule comprises of questions for eliciting information on select parameters viz., economic conditions, household circumstances, price levels, future land prices, growth potential of the Japanese economy and recognition and credibility of the Bank. Australia: Westpac-Melbourne Institute collects views of around 1,200 respondents on monthly basis in Australia for Consumer Confidence Survey. The survey comprises of five parameters viz., family finances v/s. a year ago, family finances next 12 months, economic conditions next 12 months, economic conditions next 5 years and good or bad time to buy major household items. UK: GfK NOP collects 2,000 respondents’ view on monthly basis for compiling consumer confidence. GfK NOP captures information on five parameters viz., personal financial situation over the last 12 months, personal financial situation over the next 12 months, general economic situation over the last 12 months, General economic situation over the next 12 months and ‘a good time or bad time for the average person to make a major outlay for items such as a furniture or electrical goods purchasing sentiments’. Euro Area: European commission conducts Consumer Confidence Survey by phone and covers 23,000 households on monthly basis. The questions focus on current economic and financial situation, saving intention as well as on expected developments regarding: consumer price indices, general economic situation and major purchases of durable goods. 3. Survey Results The survey results are shown for each parameter based on net response (difference between positive and negative perceptions). For reporting purpose, current is used for current situation as compared with one year ago and future is used for expectations for one year ahead period. 3.1 Economic Conditions The net response on current economic conditions became negative from Q2:2012-13 onwards and could not recover thereafter (Chart 1). The optimism regarding future economic conditions has consistently been better than that pertaining to the current economic conditions (Chart 1). The net responses in this case also turned negative during Q4:2012-13 to Q2:2013-14 of the survey. However, it turned positive since Q3: 2013-14. The net responses on future economic conditions appear to show sharp improvement after Q3:2013-14, rising from 4.7 per cent to 39.1 per cent. 3.2 Household Circumstances Net response on current household circumstances showed a sign of improvement from Q3:2013-14. It is observed that the outlook on household circumstances has been better than the current scenario (Chart 2). However, the net responses on future household circumstances witnessed rise since Q2:2013-14 and reached around 49 per cent in Q1:2014-15. ‘Salary and business income’ and ‘prices’ are the two major factors that have influenced respondents’ perceptions on household circumstances across all the survey rounds (Table 3). 3.3 Income The net response on current and future income perceptions was at its lowest in Q2:2013-14 but witnessed improvement in subsequent survey rounds. Current income perceptions have remained consistently lower as compared to the net perceptions on future income. The net response on future income improved to more than 50 per cent in latest two rounds i.e. Q4:2013-14 & Q1:2014-15 (Chart 3). The proportion of respondents, who reported relatively higher income as compared to the last year, has increased consistently from 34.5 per cent in Q2: 2013-14 to about 39.1 per cent in Q1:2014-15. However, this proportion in respect of future income expectations has remained above 40 per cent during last four quarters. About 43-54 per cent respondents reported that their income has remained at the same level as that of last year. However, the same proportion for future expectations is about 30-41 per cent only (Table 4). 3.4 Spending The net response on future spending has remained consistently lower as compared to net response on current spending. The net responses on current as well as future spending appear to show some improvement in Q1:2014-15 (Chart 4). More than three-fourths of the respondents reported that their current spending has increased as compared to a year ago (Table 5). However, this proportion in respect of increased future spending in the next year has been significantly lower. ‘Cost of consumer goods’, ‘cost of services’ and ‘income’ were observed to be the major factors that have influenced the perceptions on current spending (Table 6). 3.5 Perceptions on Price Levels and Inflation Net responses on current price level are below 90 per cent during last one year. These proportions were marginally lower in respect of net responses on future price levels (Chart 5). During the last four rounds, the proportion of respondents expecting prices to rise has decreased. The net response on expectations on price rise improved from 80 per cent to 70 per cent. Extending the query, the respondents among those who reported increase in price levels were asked whether the rate of price rise (i.e., inflation) would be higher or same or lower. In terms of net responses, more than 80 per cent of respondents expected inflation to increase over the next year (Chart 6, Table 8). 3.6 Cross Tabulations on Income versus Spending and Inflation versus Spending The cross tabulation on income and spending for last four rounds are given in Table 9. About 27-32 per cent of respondents reported increase in current spending to be associated with increase in current income. About 21- 38 per cent of respondents, reported increase in current spending even with current income remaining same or lower. The strength of association of expected increase in future spending with increase in future income is observed to be relatively lower as about 14-24 per cent respondents reported increase in expected spending to be associated with increase in future income. The cross tabulation on inflation and spending for last four rounds are given in Table 10 providing further insights on spending perceptions. The analysis of responses reveal that about 63-74 per cent of the respondents reported higher current spending in association with higher current inflation. Against 23-32 per cent respondents reported association of increase in future spending with increase in expected inflation as expected expectations of rise in future inflation was associated with lower spending intentions. 3.7 Perceptions on other Macroeconomic Indicators 3.7.1 Employment: In general, the respondents had more optimistic outlook regarding employment. The similar pattern is observed in terms of net responses on employment perceptions (Chart 7). The proportion of respondents expecting improvement in the future employment scenario has consistently been higher than those who felt improvement in current employment prospects (Table 12). 3.7.2 Plan for major expenses: Respondents were asked whether it was a good time to make major outlay for any major purchases viz., motor vehicle, house or durable goods. Gold/bullion was added as an item in the list from Q4:2012-13. During the last four rounds, less than 32 per cent of respondents reported that this is the right time to make outlays for major purchases viz., motor vehicle, house, durable goods and gold. Around one third of the respondents reported that it is a good time for purchasing gold (Table 12). 3.8 Consumer Confidence Index 3.8.1 Current Situation Index (CSI) and Future Expectations Index (FEI) In the pre Q2:2012-13 rounds, the CSI was based on the net responses in respect of economic conditions, household circumstances, income, spending and price levels and FEI was based on the net responses in respect of economic conditions, income, spending, employment conditions and price levels. From Q2:2012-13, these indices have been worked out using the common set of parameters viz. economic conditions, household circumstances, income, spending, employment conditions and price levels (new methodology in Annex 2). CSI and FEI were at their lowest in Q2:2013-14 since their inception. But CSI recovered slowly and reached threshold level in Q1:2014-15. However, there has been significant improvement in FEI due to increase in the positive perceptions on almost all parameters during last four rounds of survey, however, increase is not uniform across all indicators. Overall the consumer confidence index reflects improvements in the positive perceptions, in general, there exists optimism regarding future circumstances as compared to current situation. 3.8.2 Robustness of Estimates In order to evaluate the quality of estimates, the confidence intervals for mean CSI and FEI have been estimated using bootstrap methodology. Based on 10,000 re-samples selected through ‘simple random sampling with replacement’, the 99 per cent bootstrap confidence intervals for mean CSI and mean FEI are given in Table 14. The width of confidence intervals varied between 2.7 to 3.2 indicating the robustness of the estimates of CSI and FEI.
Annex 2: Methodology In standard opinion surveys, respondents generally have three reply options such as up/same/down; or above-normal/normal/ below-normal; or increase/remain-same/decrease. Because of the difficulty of interpreting all three per centages, the survey results are normally converted into a single quantitative number. One of the most common way of doing this is to use ‘Net-Responses’ (also called ‘Balances’ or ‘Net Balances’). It is defined as the per centage of the respondents reporting a decrease (negative), subtracted from the per centage reporting an increase (positive). Net Responses can take values from –100 to +100. In this survey, Net Response is used to analyse the Consumer Confidence Survey results. To combine the consumer confidence perceptions on various parameters, two indices are worked out. These are Current Situation Index for reflecting current situation as compared to one year ago and Future ExpectationsIndex to reflect the expectations one year ahead. For calculating the index, the following formula has been used. Overall Index = 100 + Average (Net Response of selected factors) Where Net Response = Positive perceptions (%) – Negative perception (%) The average net responses on the current perception on various factors, viz. economic conditions, household circumstances, income, spending, price level and employment@ are used for the calculation of the Current Situation Index. The average net responses on the future perceptions on various factors, viz. economic conditions, household@@, income, spending, price level and employment are used for the calculation of the Future Expectations Index. * Prepared in the Department of Statistics and Information Management, Reserve Bank of India, New Delhi. The latest round (June 2014) of the survey data was released on August 5, 2014 on the RBI Website. The previous annual article on the subject was published in September 2013 issue of the RBI Bulletin. @ & @@ : Current employment perception and future household perception have been captured from September 2012. These have been included for calculating CSI and FEI from September 2012, onwards. |
|||||||||||||||||||||||||||||||||||||||||||||||||||||||||||||||||||||||||||||||||||||||||||||||||||||||||||||||||||||||||||||||||||||||||||||||||||||||||||||||||||||||||||||||||||||||||||||||||||||||||||||||||||||||||||||||||||||||||||||||||||||||||||||||||||||||||||||||||||||||||||||||||||||||||||||||||||||||||||||||||||||||||||||||||||||||||||||||||||||||||||||||||||||||||||||||||||||||||||||||||||||||||||||||||||||||||||||||||||||||||||||||||||||||||||||||||||||||||||||||||||||||||||||||||||||||||||||||||||||||||||||||||||||||||||||||||||||||||||||||||||||||||||||||||||||||||||||||||||||||||||||||||||||||||||||||||||||||||||||||||||||||||||||||||||||||||||||||||||||||||||||||||||||||||||||||||||||||||||||||||||||||||||||||||||||||||||||||||||||||||||||||||||||||||||||||||||||||||||||||||||||||||||||||||||||||||||||||||||||||||||||||||||||||||||||||||||||||||||||||||||||||||||||||||||||||||||||||||||||||||||||||||

ఈ పేజీని షేర్ చేయండి:


భారతీయ రిజర్వ్ బ్యాంక్ మొబైల్ అప్లికేషన్ను ఇన్స్టాల్ చేయండి మరియు తాజా వార్తలకు త్వరిత యాక్సెస్ పొందండి!
మా యాప్ను ఇన్స్టాల్ చేయడానికి QR కోడ్ను స్కాన్ చేయండి


పేజీ చివరిగా అప్డేట్ చేయబడిన తేదీ:


