 IST,
IST,
RBI WPS (DEPR): 18/2011 : Inflation Threshold in India: An Empirical Investigation
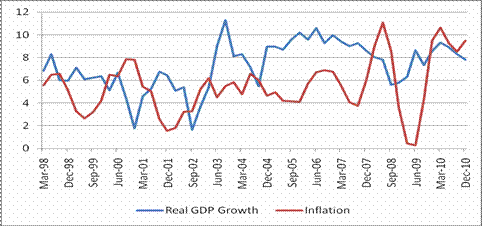
| RBI Working Paper Series No. 18 Abstract 1This paper examines the issue of the existence of threshold effects in the relationship between inflation rate and real GDP growth in India using 3 different approaches. In view of the structural changes of the economy, the empirical analysis uses data for the period of Q1:1996-97 to Q3:2010-11 in order to capture the more recent picture of the growth inflation nexus. A specific question addressed in this paper was: does inflation in India have to reach some minimum "threshold" before the growth effects turn adverse? The findings clearly suggest that inflation threshold in the sense of structural break point exists for India and this implies a non-linear relationship between inflation and growth. Empirical results suggest that there exists statistically significant structural break in the relation between output growth and inflation in between 4.0 and 5.5 per cent of inflation above which inflation retards growth rate of GDP and below the threshold level, there is a statistically significant positive relationship between inflation rate and growth. Thus substantial gains can be achieved if inflation is kept below the threshold. JEL classification: C22; E00; O11. Keywords: Inflation, Economic growth, Threshold inflation. Inflation Threshold in India: An Empirical Investigation Introduction In the aftermath of the recent global financial crisis in 2008, as growth gradually recovered, inflation gained momentum in India. Inflation remained higher and persisted at above the comfort level of the Reserve Bank of India. The debate of growth-inflation trade-off and the role of monetary policy reappeared and have once again acquired center stage of recent policy debate. The conventional view, influenced mostly by the short run Phillips Curve, subscribed that higher inflation tolerance could yield higher growth against the view that inflation itself is a risk to growth beyond a level. RBI Annual Report, 2010-11 refers to recent empirical work on ‘Backward bending Phillips Curve’, which argues that Phillips Curve is negatively sloped at low levels of inflation, becomes positively sloped at high levels of inflation and turns vertical if inflation expectations converge to actual inflation. This lends support to the hypothesis of the existence of a threshold level of inflation. Monetary policy that ensures that inflation remains low and stable over time contributes to long-run economic growth and financial stability (Bernanke, 2011). Low and stable inflation improves the functioning of the markets, making them more effective at allocating resources. It also allows households and businesses to plan for the future without having to be unduly concerned with unpredictable movements in the general level of prices. Therefore, price stability with growth is the prime objective for any central bank. This means central banks try to achieve low and stable inflation and high output growth through their monetary policy. In this context, much of the research on growth-inflation nexus has tried to address three key questions: (i) is there a robust negative relationship between inflation and growth? (ii) is there a "kink" in the relationship so that, at low levels of inflation, the relationship is positive? (iii) does inflation have to reach some minimum "threshold" before the growth effects turn adverse? All these questions suggest the possibility of a non-linear relationship between inflation and output growth. If such a non-linear relationship exists, then it should be possible to estimate the inflexion point, or threshold, at which the sign of the relationship between inflation and growth would switch. Inflation beyond the threshold level makes growth costly and calls for policy changes. Several recent empirical studies have examined the growth-inflation relationship in a non-linear framework using long annual cross-country data specifically looking at the change in the relationship between inflation and growth below and above a threshold. For example, Sarel (1996), and Bruno and Easterly (1998) show that harmful effects of inflation are not universal, but appear only over the threshold level of inflation. Nevertheless, there is the growing concern in developed countries that excessively low inflation threshold may hurt economic growth (Singh and Kalirajan, 2003). Most of the studies have focused on long annual time series data in a cross-country framework for examining the existence of threshold and its estimation. On the methodological front, there are a few options like Sarel (1996), Khan and Senhadji (2001) and Espinoza et al. (2010). While Sarel (1996) used ordinary least squares (OLS) and corresponding R-squared for estimating inflation threshold, Khan and Senhadji (2001) used a non-linear least squares approach. Espinoza et al. (2010) used Logistic Threshold Regression model which allows smooth transition between regimes for estimating the threshold inflation. Fig. 1: Recent Trend of Real GDP Growth and Inflation in India
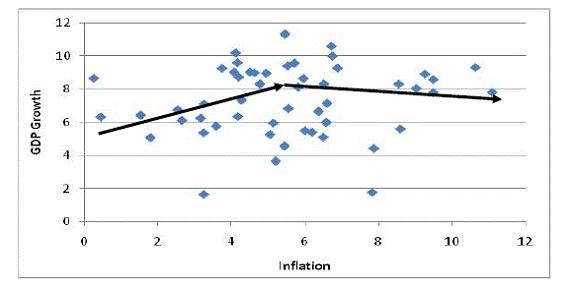
Generalization of the findings of the long-period cross-country studies to India is fraught with conceptual difficulties. This is because such studies on one end included countries with an inflation rate as low as one or two per cent and on the other, those with inflation rates going beyond 200 to 300 per cent. In addition, during last two decades or so, Indian economy has undergone a significant structural transformation. From 1996 to 2002, GDP growth was hovering around 6%, while y-o-y average Wholesale Price Index-inflation was close to 5% (Fig. 1). Subsequently, growth traversed much higher trajectory and inflation remained relatively low in the range 5-6% till global financial crisis adversely affected growth-inflation dynamics. After the recent global crisis in 2008, growth rate of India bounced back much quicker than anticipated and at the same time inflation went up significantly. Therefore, the dynamics of growth-inflation nexus in India is not straight forward. For a country like India, which has witnessed many structural changes in the past few decades, going back too long may not reflect the current evolving state of the economy. Hence recent data based on quarterly information is a possible alternative. With a view to capturing the recent structural changes in the economy, this study used quarterly data from Q1:1996-97 to Q3:2010-11 and empirically explored the existence of an inflation threshold, if any, based on three different approaches indicated above. The paper is organized as follows: Section 2 provides a survey of literature on inflation threshold. Selected methodologies for estimating a threshold of inflation are elaborated in Section 3. Empirical results are presented in Section 4 and the final section offers a few policy implications with concluding remarks. The seminal work by Fischer (1993) is among the first to examine the possibility of non-linearities in the relationship between economic growth and inflation in the long run. Using both cross section and panel data for a sample that includes developing and industrialized countries, Fischer's parameter estimates indicate a negative relationship between inflation and growth. Subsequently, many empirical studies on inflation threshold used a large panel data across countries. Sarel (1996) used annual data from 1970 to1990 for 87 countries and found that the threshold is at 8 per cent below which the effect of inflation on growth is negligible (or slightly positive) but beyond 8 there is a significant, extremely powerful and robust negative effect on economic growth. On similar lines, Ghosh and Phillips (1998) used a large panel data set, covering IMF member countries over 1960–96. Their results suggest a negative relationship between inflation and growth that is both statistically and economically significant. The relationship is non-linear in two senses: first, at very low inflation rates, the relationship is positive; second, at all other inflation rates, the apparent marginal effect of inflation on growth becomes less important as higher inflation rates are considered. Analysis of Khan and Senhadji (2001) using a dataset including 140 countries (comprising both industrial and developing countries) for a period 1960 to 1998 revealed that the threshold level of inflation above which it significantly slows growth is estimated at 1–3 per cent for industrial countries and 11–12 per cent for developing countries. Drukker, Gomis- Porqueras, and Hernandez-Verme (2005) confirmed the existence of a threshold using a panel of 138 countries, but they estimated its level to be higher, at about 19 per cent. This level of threshold, higher than usually estimated, was confirmed by Pollin and Zhu (2006) who also divided the sample by decades and suggested that threshold would be around 15-18 per cent. A much lower threshold was obtained by Burdekin et al. (2004), who estimated a panel model of 72 countries using annual data and, allowing for multiple thresholds, found that for developing countries, inflation proves to be costly when it is higher than 3 per cent. A second break was also identified at 50 per cent, above which marginal growth costs declines significantly. Espinoza et al. (2010) used a panel of 165 countries and for a period 1960–2007. They estimated a threshold of about 10 per cent for all country groups (except for advanced countries) above which inflation quickly becomes harmful to growth. However, for the advanced economies, threshold was much lower. Many studies in Indian context have provided differing views on inflation threshold. Chakarvarty Committee (1985) referred to it as the acceptable rise in prices at 4 per cent. This, according to the Committee, reflects changes in relative prices necessary to attract resources to growth sectors. “As growth is not uniform in all the sectors, maintaining absolute price stability, meaning a zero rate of increase in prices, may not be possible and nor is it desirable.” Rangarajan (1998), who pioneered the concept of threshold inflation, brought central bank focus on inflation rate at 6–7 per cent known as “acceptable level” of inflation. His idea of threshold was: at what level of inflation do adverse consequences set in? The study by Vasudevan et al. (1998) and, Kannan and Joshi (1998) found the threshold level to be around 6 per cent. Results of Samantaraya and Prasad (2001) are also on similar line as they found the threshold level to be around 6.5 per cent. In contrast, Singh and Kalirajan (2003) using annual data for the period of 1971–1998 provided argument against any threshold level for India. A more recent study by Singh (2010) which used both, yearly and quarterly data, found threshold level of inflation for India at 6 per cent but failed to confirm the same in Sarel (1996) sense. It is rightly acknowledged in the literature that inflation has a non-linear impact on growth. While below a threshold level, inflation has a positive effect; it will have an adverse effect on growth once it crosses the threshold. Prima facie, such a non-linear relationship exists for Indian data (Fig. 2). Fig. 2: Non-linear Relationship between GDP Growth and WPI Inflation in India
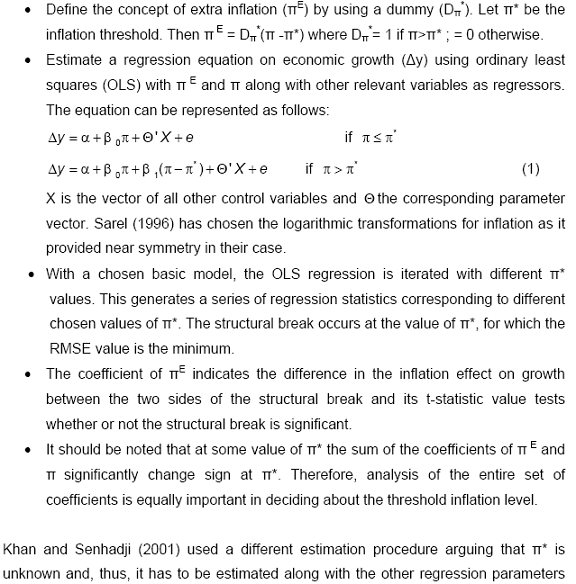
Many studies attempted to estimate the threshold level of inflation using different methodologies. In this study, we have used three different methodologies as proposed by Sarel (1996), Khan and Senhadji (2001) and Espinoza et al. (2010) for estimating threshold level of Inflation for India. The purpose of applying three different methodologies was to ensure the robustness of the results. A brief review of the various methodologies is given below. Sarel (1996) came out with an estimation procedure for inflation threshold which is basically running a series of regression equations and finding the threshold value of inflation which maximizes R-squared or minimizes Root Mean Square Error (RMSE). The procedure could be defined in following steps:
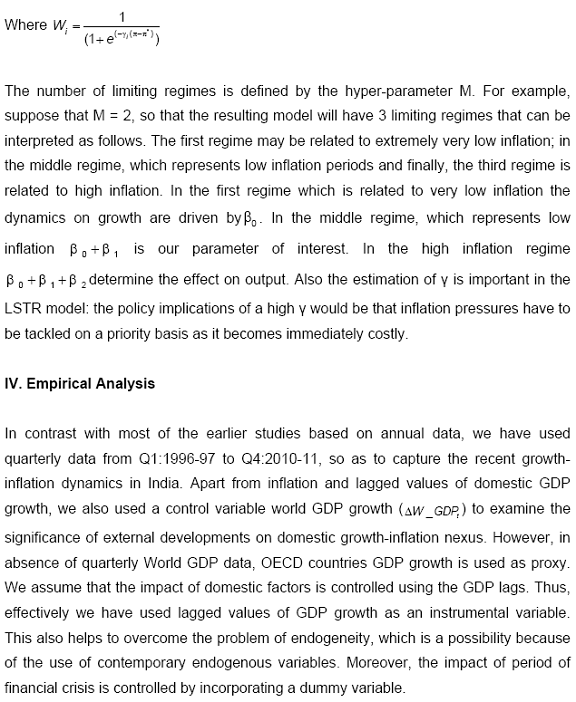
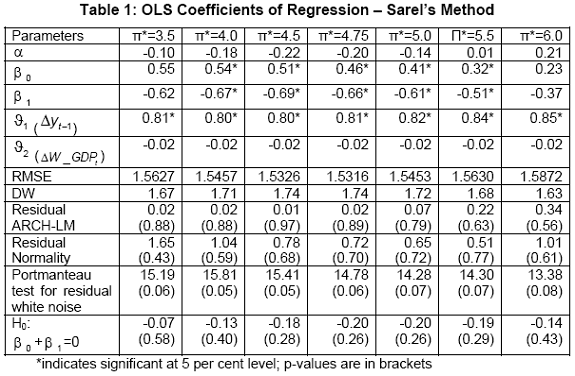
A recent paper by Espinoza et al. (2010) used a Logistic Smooth Transition Regression (LSTR) model proposed by Teräsvirta (1994, 1998) to estimate the threshold and the speed of transition from one regime (low effect of inflation on growth) to another (high effect of inflation on growth). The basic difference of their model with that of Khan and Senhadji (2001) is that instead of using dummy variable to differentiate the regimes they assigned weights based on a logistic function. The model that we are using is slightly different from Espinoza et al. (2010) but uses a LSTR. We use the model specification as proposed by McAleer & Medeiros (2008) which employs a quasi maximum likelihood (QML) estimator of smooth transition regression with multiple regimes.
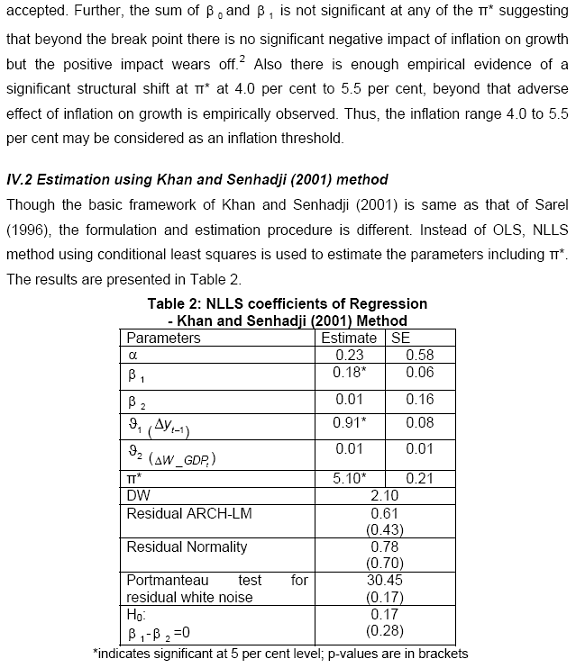
Most of the earlier studies have used logarithmic transformation of inflation. The reason for using a different functional form is the non-symmetric nature of inflation on growth. Other explanations include the impact of multiplicative shocks in inflation which have similar effects on growth for any level of initial inflation. In Indian context for the period considered, the inflation series is somewhat symmetric. Indeed, its logarithmic transformation makes it more skewed. Hence, we used inflation at level for estimating the threshold. IV.1 Estimation using Sarel’s method Following the methodology proposed by Sarel (1996) threshold inflation is tested using the framework defined in the methodology section. The regression diagnostics for all models are found to be satisfactory. The results are given in Table 1 below:
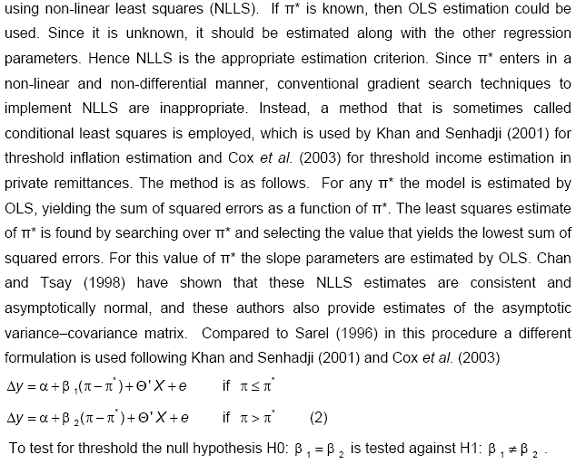
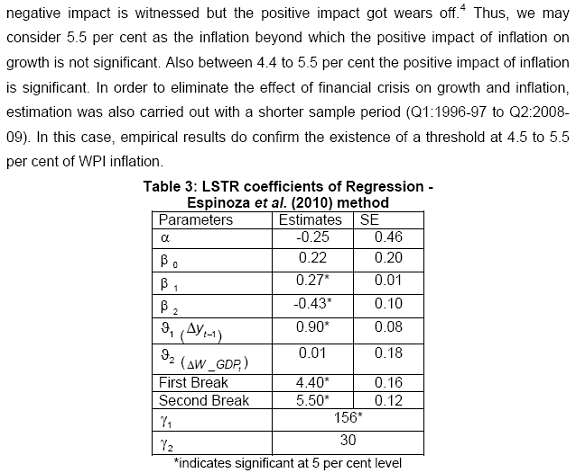
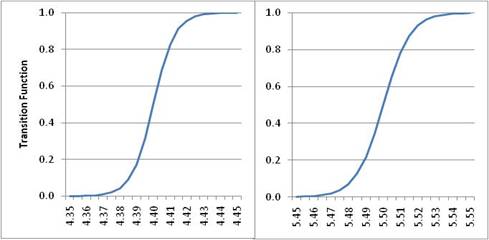
Using conditional least squares, we estimated a statistically significant break at 5.1 per cent of inflation. The regression diagnostics are found to be satisfactory. However, the test for existence of a threshold is rejected since beta coefficients are not statistically different. Hence, empirical results following Khan and Senhadji (2001) methodology is reassuring with the results obtained earlier by the Sarel (1996) methodology. Both approaches did not find threshold inflation in true sense of the term. But empirical evidence suggests that the inflation growth dynamics changes beyond 5.1 per cent of inflation. The 95 per cent of confidence interval of the break is 4.7 per cent to 5.5 per cent. Thus, when inflation moves beyond the break point, the positive effect of inflation on growth dies out and hence 4.7 to 5.5 can be treated as the inflation threshold, considering that impact of inflation above 5.5 per cent turns unfavourable to growth. IV.3 Estimation using Espinoza et al. (2010) method The estimation method suggested by Espinoza et al. (2010) is employed based on following inputs: (1) choice of relevant variables to be included in the model, which we kept same as above approaches; (2) selection of the transition variable - which is obviously inflation in this case; and (3) determination of the number of regimes which we fixed as three as it was giving better results. The regression results are given in Table 33. Hillebrand et al. (2010) has already established the asymptotic normality and consistency of the QML estimates. Hence we can have straightforward inference from estimated parameters and their SE.
Fig 3. Transition Function
High output growth and low inflation are among the most important objectives of macroeconomic policy. But there are perceived trade-offs between lowering inflation and achieving high growth. Empirical evidence emphasizes that the growth-inflation relationship depends on the level of inflation—at some low levels, inflation may be positively correlated with growth, but at higher levels inflation is likely to be harmful to growth. In other words, the relationship between inflation and output growth is non-linear. If such a non-linear relationship exists, then it should be possible to estimate the inflexion point, or threshold, beyond which output growth becomes costly. In this context, several studies have examined the relationship between inflation and long-run growth in a non-linear framework. Based on the quarterly data for the period Q1:1996-97 to Q3: 2010-11, this paper examines the growth-inflation nexus in India and empirically investigates the existence of any threshold level of inflation. Inflation threshold is identified in literature using various methods. For this study, we have used three different methodologies to ensure robustness of our findings. Empirical results based on the full sample (Q1:1996-97 to Q3:2010-11) show that there exists statistically significant structural break in the relation between growth and inflation at 4.0% and 5.5%. For WPI-inflation up to 5.5%, there is positive impact on growth, which is statistically significant. The relationship reverses when WPI-inflation is beyond 5.5% and inflation effect on growth turns negative. This study provides evidence of a shift in regime indicating possible adverse impact of inflation on growth beyond 5.5% WPI-inflation. It must be emphasised here that the concepts of inflation target and inflation threshold are distinct. Inflation targeting is a construct of monetary policy making in which a central bank announces a ‘target’ and then steers its policy tools towards achieving that target. Inflation threshold is a point of inflexion for the growth-inflation trade-off. Therefore, inflation threshold need not necessarily be the ‘target’ of monetary policy. In fact, the inflation objective or the target level of inflation for monetary policy should be lower than the inflation threshold, considering the existence of significant lags in the transmission of monetary policy measures and the costs of inflation. @ The authors are Executive Director, Officer-in-Charge, Director and Research Officer, respectively, of the Department of Statistics and Information Management, Reserve Bank of India. 1Views expressed in the paper are those of the authors and not of the Reserve Bank of India. 2 Most studies for India using Sarel approach do not get this reversal at the threshold, and hence report this as a limitation of the estimated threshold. 3 We used the Matlab codes developed by Marcelo C. Medeiros available in http://sites.google.com/site/marcelocmedeiros/Home/codes 4 In order to examine the robustness of the results, equations were also estimated without the control variable world GDP growth. However, the point of inflexion as reported above did not change. References
|
పేజీ చివరిగా అప్డేట్ చేయబడిన తేదీ:


