 IST,
IST,
Chapter III : Financial Sector: Regulation and Developments
Well over a decade after the global financial crisis, financial vulnerabilities continue to build globally although the financial system resilience has increased. Domestic financial markets saw some disruption emanating from the non-bank space and its growing importance in the financial system. In order to finetune the supervisory mechanism for the banks, the Reserve Bank has recently reviewed the structure of supervision in the context of the growing diversity, complexities and interconnectedness within the Indian financial sector. The Securities and Exchange Board of India (SEBI) has put in place broad guidelines for interoperable framework between Clearing Corporations. It has also concurrently overhauled the margin framework to make it more robust. The Insurance Regulatory and Development Authority of India (IRDAI) has constituted a committee to identify Systemically Important Insurers. The Insolvency and Bankruptcy Board of India (IBBI) is showing steady progress in the resolution of stressed assets. National Pension System (NPS) and Atal Pension Yojana (APY) have both continued to progress towards healthy numbers in terms of total number of subscribers as well as assets under management (AUM). With an increase in the quantum of frauds reported in the banking system being attributed to prevalence of legacy cases particularly in PSBs, there is a need for timely recognition and reporting to reduce their economic costs and to address the vulnerabilities in a proactive and timely manner. International and domestic regulatory developments International developments 3.1 Well over a decade after the global financial crisis (GFC) and the subsequent policy responses, the October 2018 Global Financial Stability Report (GFSR) observed that , “Although the global banking system is stronger than before the crisis, it is exposed to highly indebted borrowers as well as to opaque and illiquid assets and foreign currency rollover risks.” GFSR (April 2019) reiterates that “… financial vulnerabilities have continued to build in the sovereign, corporate, and non-bank financial sectors in several systemically important countries leading to elevated medium-term risks”, given that the financial conditions continue to be accommodative. More importantly, the key trigger for the GFC and the subsequent backlash in political economy terms impinges on society at large. Box 3.1 sheds some light on the social dimension of risks and its implications for society. 3.2 One area where jurisdictions are trying to strengthen the oversight mechanism subsequent to GFC is ‘financial accounting’. In India, the regulatory framework for NBFCs has been overhauled with the introduction of Ind AS by the Ministry of Corporate Affairs in a phased manner (please refer footnote 40 of Chapter II). Concurrently, the European Banking Authority (EBA) adopted IFRS 9, replacing the previous accounting standard for financial instruments (IAS 39) for European banks with effect from January 01, 2018. IFRS 9 is an improvement over IAS 39 in terms of accounting for financial instruments by banks since it moves from an earlier model of an incurred loss approach to a more forward looking expected credit loss approach for credit provisioning. To get a better understanding of the initial impact of the new provisions, EBA recently published1 its first observations on the impact and implementation of IFRS by EU institutions. Some of its significant observations are:
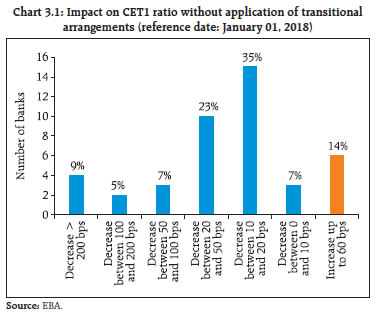
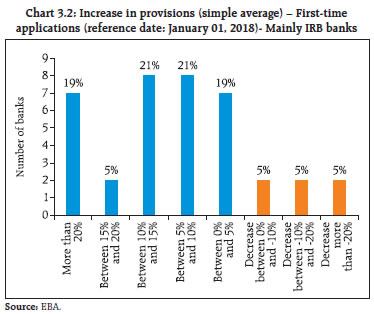
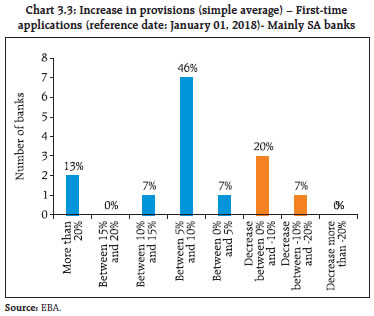
a) The day-one impact on Common Equity Tier 1 (CET1) ratios, based on the data collected for the sample of banks,4 was a negative 51 bps (based on a simple average). However, there was significant variability in the CET1 impact among the banks in the sample (Chart 3.1). Banks using mainly an internal rating based (IRB) approach experienced a significantly smaller negative impact in terms of the CET15 (-19 bps on a simple average), than banks mainly using the standardised approach (SA) for credit risk (-157 bps on a simple average). b) The difference between the increase in provisions and the related CET1 impact in relative terms for IRB and SA banks can be mainly attributed to the fact that for IRB banks regulatory expected losses are already reflected in CET1. In practice, this means that the existing IRB shortfall under the erstwhile incurred loss-based IAS 39 absorbs part of the increase in provisions when applying IFRS 9, as it was already being deducted from CET1 (Charts 3.2 and 3.3). c) As regards asset classification, banks reported that 85 per cent of on-balance sheet exposures (gross amount) were allocated to stage 1; 8 per cent to stage 2; and 7 per cent to stage 3. Regarding the off-balance sheet exposures (commitments and financial guarantees), the allocation corresponded to 93 per cent, 5 per cent and 2 per cent in stages 1, 2 and 3 respectively. In this regard, it is also relevant to understand how the subjective assessments of impairment have been applied with regard to expected credit loss (ECL). Under IFRS 9, assets 30 days past due are required to be classified as stage 2 impaired on a rebuttable basis. As can be seen in Table 3.1, for 10 of the 53 banks, no assets beyond 30 days past due were unimpaired implying that only 19 per cent banks had adopted the automatic factor to transfer their exposures from stage 1 to stage 2 without applying subjective evaluation allowed by the accounting regime. This possibly highlights the importance of standardisation of benchmarks for use in subjective evaluations so as to make the balance sheet and P&L numbers comparable. d) Concurrently, it is also relevant to find out to what extent assets classified under 90 days past due as impaired (under incurred loss model) qualified as stage 3 impaired under the ECL impairment model. Table 3.2 shows that 26 per cent banks considered all assets past due beyond 90 days as impaired. e) These observations may be useful for jurisdictions that are seeking to move towards IFRS 9, especially the ‘subjectivity’ that is embedded in IFRS 9 which could be prone to misuse in jurisdictions fraught with ‘governance’ problems.
3.3 With regard to bank supervision, the revised market risk capital framework was recently endorsed by the Group of Governors and Heads of Supervision (GHOS). Some of the key changes include (a) clarifications on the scope of exposures that are subject to market risk capital requirements; (b) a simplified standardised approach for use by banks that have small or non-complex trading portfolios; (c) refined standardised approach treatment of foreign exchange risks and index instruments; (d) revised standardised approach risk weights applicable to general interest rate risk, foreign exchange and certain exposures subject to credit spread risks; (e) revisions to the assessment process to determine whether a bank’s internal risk management models appropriately reflect the risks of individual trading desks; and (f) revisions to the requirements for identifying risk factors that are eligible for internal modelling. This revised standard comes into effect on January 01, 2022. Once implemented, the revised framework is estimated to increase market risk capital requirements by 22 per cent on average as compared with Basel 2.5 as against 40 per cent increase under the framework issued in 2016. Market risk-weighted assets (RWAs) will account for 5 per cent of total RWAs on average, compared with 4 per cent under Basel 2.5.8 3.4 On the OTC-derivatives front, the G-20 had outlined five areas of reforms - trade reporting of OTC derivatives; central clearing of standardised OTC derivatives; exchange or electronic platform trading, where appropriate, of standardised OTC derivatives; higher capital requirements for non-centrally cleared derivatives; and initial and variation margin requirements for non-centrally cleared derivatives. Central clearing is a key feature of global derivatives markets since the GFC. Almost two-third of over-the- counter (OTC) interest rate derivative contracts, as measured by outstanding notional amounts, are now cleared via central counterparties (CCPs). Systemically important banks and CCPs interact in highly concentrated OTC markets. The endogenous interactions between banks and CCPs in periods of stress could potentially lead to destabilising feedback loops both in asset and derivative markets. In this context, a recent BIS review9 highlighted the potential feedback loop that can consequently form. It calls for mutually reinforcing regulatory standards for CCPs and banks as also incentivising the two entities to work together to ensure financial stability. 3.5 The International Organisation of Securities Commissions (IOSCO) published a report10 setting out its views on good practices for audit committees of listed companies in supporting the quality of external audits. The report notes that while the auditor has primary responsibility for audit quality, the audit committee should promote and support quality thereby contributing to greater confidence in the quality of information in the listed company’s financial reports. The report also recommends certain best industry practices with regard to appointment as also assessment of the auditors’ independence. 3.6 The International Association of Insurance Supervisors (IAIS) launched a consultation document11 on a proposed holistic framework for the assessment and mitigation of systemic risks in the insurance sector. The sources of systemic risks that it identified include, (a) liquidity risk, (b) interconnectedness, (c) lack of substitutability and (d) other risks like climate and cyber risks. Climate risks affecting insurers can be grouped into two main categories: physical risks arising from extreme climate events and transition risks arising due to policies and regulations for transitioning to a low carbon economy. The report posits that non-incorporation of physical risks arising due to climate change can potentially result in underpricing / under reserving, thereby overstating insurance sector resilience. IAIS further identifies three transmission channels whereby these sources of systemic risks may be transmitted to the broader economy: (i) the asset liquidation channel, (ii) exposure channel and, (iii) the critical functions channel. IAIS proposes internalising the systemic transmission channels in its policy guidelines. 3.7 The Basel Committee on Banking Supervision (BCBS) published a report12 identifying and comparing a range of regulatory and supervisory cyber-resilience practices observed in banks across jurisdictions. The current challenges and initiatives for enhancing cyber-resilience are summarised in 10 key findings and illustrated by case studies which focus on concrete developments in the jurisdictions covered. BCBS classifies the expectations and practices into four broad dimensions of cyber resilience: governance and culture; risk measurement and assessment of preparedness; communication and information-sharing; and interconnections with third parties. Some of the key findings of the study are:
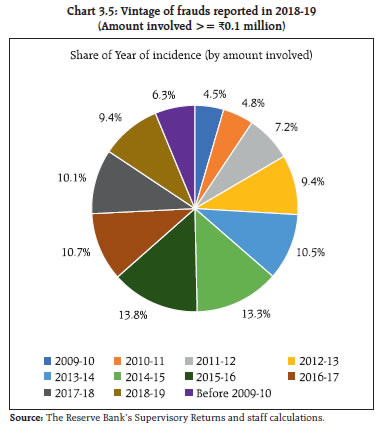
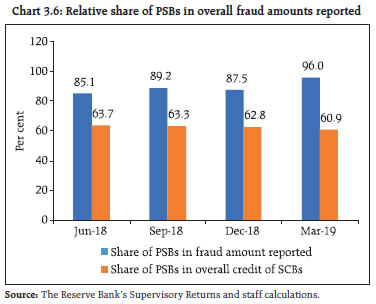
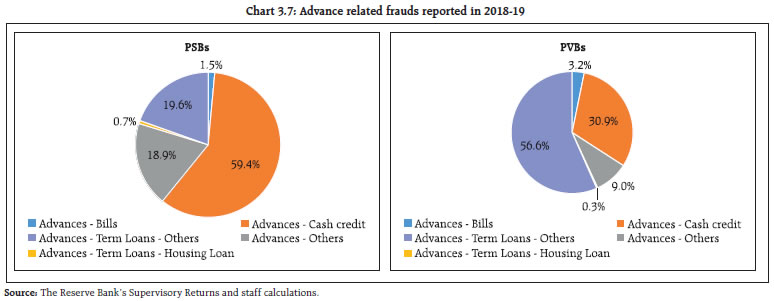
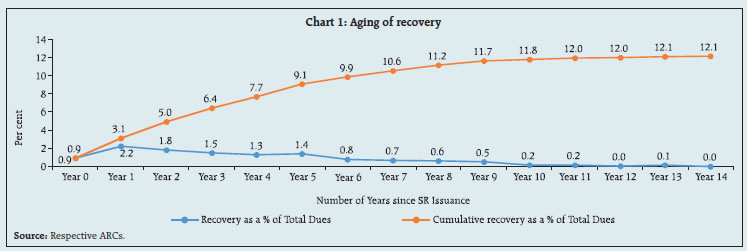
3.8 The Financial Action Task Force (FATF), in its 2019 report13 to G-20 ministers and central bank governors sets out its ongoing work to fight money laundering and terrorist financing. The report notes that blockchain and other distributed ledger technologies may deliver significant benefits to the financial system and the broader economy. Virtual assets, however, also pose serious money laundering and terrorist financing risks. FATF is actively monitoring virtual currency/crypto-asset payment products and services, including pre-paid cards linked to virtual currencies, Bitcoin ATMs and initial coin offerings (ICOs). Domestic developments I. The Financial Stability and Development Council 3.9 Since the publication of the last FSR in December 2018, the Sub-Committee of the Financial Stability and Development Council (FSDC) held its 22nd meeting chaired by the Governor, RBI on March 14, 2019. It discussed various issues that impinge on financial stability in the country, including ways of addressing challenges pertaining to the quality of credit ratings, interlinkages between housing finance companies and housing developers and interlinking of various regulatory databases. The Sub-Committee also reviewed the activities of its various technical groups and the functioning of State Level Coordination Committees (SLCCs) in various states / union territories. A thematic study on financial inclusion and financial stability and a National Strategy for Financial Inclusion (NSFI) are the other issues that were discussed. 3.10 The Financial Stability and Development Council held its meeting on 19th June, 2019 which was chaired by the Finance Minister of India. The Meeting reviewed the current global and domestic economic situation and financial stability issues including, inter-alia, those concerning Banking and NBFCs. The Council also held consultations to obtain inputs/ suggestions of the financial sector regulators for the Budget. All the regulators presented their proposals for the Union Budget 2019-20. The Council took note of the activities undertaken by the FSDC Sub-Committee chaired by Governor, RBI and the action taken by members on the decisions taken in earlier meetings of the Council. II. Banks (A) Supervision 3.11 The revised prudential framework on stressed assets issued by the Reserve Bank on June 7, 2019 significantly extends the erstwhile stressed asset resolution framework as also builds in incentive for early adoption of a resolution plan (RP). The major features of the revised framework are as follows: i. Applicability: Scope widened to include Small Finance Banks, Systematically Important NBFC (non-Deposit taking) & NBFCs (Deposit taking) besides SCBs (excl. RRB) & All India Term Financial Institutions. ii. Resolution Strategy: Lenders shall undertake a prima facie review of the borrower account within thirty days from default (“Review Period”) and may also decide on the resolution strategy, including the nature of the Resolution Plan (RP), the approach for implementation of the RP, etc. The lenders may also choose to initiate legal proceedings for insolvency or recovery. iii. Adoption of Inter Creditor Agreement (ICA): All Lenders (including NBFCs and ARCs) to sign ICA; ICA addresses concerns of dissenting lenders who are to receive value greater than or equal to Liquidation value in RP. iv. Adoption of Majority vote: Resolution Plan (RP) will be binding on all lenders if approved by lenders representing 75% in value of outstanding debt (Fund based+Non-fund based) and 60% by number. Earlier, no such limit was prescribed. v. Time-Lines: Defined time-lines of 210 days, after the date of first default, for cases with Aggregate Exposure (AE) of greater than ₹20 billion (accounts with AE upto ₹15 billion to be covered by January 1, 2020, and other accounts from a date that would be specified in due course). vi. Implementation Conditions for RP: RPs involving restructuring / change in ownership in respect of accounts where the aggregate exposure of lenders is ₹1 billion and above, shall require independent credit evaluation (ICE) of the residual debt by credit rating agencies (CRAs) specifically authorised by the Reserve Bank for this purpose. vii. Disincentive on delay in resolution: Additional provisioning for delayed implementation of RP or filing of insolvency application under IBC. viii. Incentive for Implementation: Reversal of additional provisioning on implementation of RP or filing of insolvency application under IBC. 3.12 The Central Board of the Reserve Bank recently reviewed the present structure of supervision in RBI in the context of the growing diversity, complexities and interconnectedness within the Indian financial sector. With a view to strengthening the supervision and regulation of commercial banks, urban co-operative banks and non-banking financial companies, the Board decided to create a specialised supervisory and regulatory cadre within RBI. (B) Banking Frauds14 3.13 A brief analysis of frauds with amounts involving ‘₹0.1 million and above’ reported during the last 10 years is presented in Chart 3.4. It was observed that in many cases frauds being reported now were perpetrated during earlier years. The recognition of date of occurrence is not uniform across banks. To ensure timely and assured detection of frauds in large accounts, the Government issued a direction in February 2018 to all PSBs to examine all NPA accounts exceeding ₹0.5 billion from the angle of possible fraud. Systemic and comprehensive checking of legacy stock of NPAs of PSBs for fraud during 2018-19 has helped unearth frauds perpetrated over a number of years, and this is getting reflected in increased number of reported incidents of frauds in recent years compared to previous years. 3.14 The time-lag between the date of occurrence of a fraud and the date of its detection is significant. The amount involved in frauds that occurred between 2000-01 and 2017-18 formed 90.6 per cent of those reported in 2018-19 (Chart 3.5). 3.15 With regard to frauds reported, the relative share of PSBs in the overall fraud amount reported in 2018-19 was in excess of their relative share in the credit (Chart 3.6). 3.16 Similar to earlier trends, loans and advances related frauds continued to be dominant, in aggregate constituting 90 per cent of all frauds reported in 2018-19 by value. In the advance related fraud category, cash credit / working capital loans related frauds dominated in PSBs whereas retail term loans (non-housing) were a major contributor to advance related frauds in PVBs (Chart 3.7). 3.17 As on December 31, 2018, 204 borrowers who had been reported as fraudulent by one or more banks were not classified as such by other banks having exposure to the same borrower. One of the major areas of non-uniformity in processes pertains to identifying Red Flagged Accounts (RFA). The red flagging of accounts based on an indicative list of early warning signals is not uniform across banks. In several cases, banks are unable to confirm RFA tagged accounts as frauds or otherwise within the prescribed period of six months. As per CRILC data, at the end of March 31, 2019, the RFA reported by banks exceeded the stipulated six-month period in 176 cases. The reasons cited for delays in recognising frauds include delays in completing forensic audits or inconclusive findings of forensic audits. It is proposed to revise the Master Direction on Frauds in this regard and issue necessary guidance to banks. 3.18 Since it is much more difficult to quantify operational risks than credit or market risks as some operational risks interact with credit and market risks through people and processes in a complex way, timely recognition is one important aspect that can reduce the economic costs of frauds. The Reserve Bank is reviewing its Master Direction on frauds and considering additional measures for timely recognition of frauds and enforcement action against violations. (C) Enforcement 3.19 During July 2018 to June 201915, the Enforcement Department (EFD) undertook enforcement action against 47 banks (including nine foreign banks, one payment bank and a co-operative bank), and imposed an aggregate penalty of ₹1,221.1 million for non-compliance with/contravention of directions on fraud classification and reporting, discipline to be maintained while opening current accounts and reporting to the CRILC platform and RBS; violations of directions/ guidelines issued by the Reserve Bank on know your customer (KYC) norms and Income Recognition & Asset Classification (IRAC) norms; payment of compensation for delay in resolution of ATM-related customer complaints; violation of all-inclusive directions and specific directions prohibiting opening of new accounts; non-compliance with the directions on the cyber security framework and time-bound implementation and strengthening of SWIFT-related operational controls; contravention of directions pertaining to third party account payee cheques and non-compliance with directions on note sorting, directions contained in Risk Mitigation Plan (RMP), directions to furnish information and directions on ‘Guarantees and Co-acceptances’, among others. (D) Resolution and recovery 3.20 The Insolvency and Bankruptcy Code, 2016 (IBC or Code) is an evolving piece of economic legislation. The implementation of the Code has greatly overhauled the regulatory measures in respect of resolution of impaired assets and contributed to a more efficient deployment of capital. The corporate insolvency resolution process under the Code envisages estimating a fair value and liquidation value of the assets of the corporate debtor (CD). The Insolvency and Bankruptcy Board of India (IBBI) commenced the valuation examination for asset classes of (a) securities or financial assets, (b) land and buildings, and (c) plant and machinery with effect from March 31, 2018. The Insolvency Law Committee submitted its second report on October 16, 2018 recommending the adoption of the UNCITRAL Model Law of Cross Border Insolvency, 1997, which provides for a comprehensive framework to deal with cross-border insolvency issues. It also recommended a few carve-outs to ensure that there is no inconsistency between the domestic insolvency framework and the proposed cross-border insolvency framework. 3.21 Quarter wise progress in terms of insolvency resolution is given in Table 3.3. Out of 1,858 corporates in the resolution process till March 2019, 152 were closed on appeal or review, 94 resulted in resolution and 378 yielded liquidation. About 50 per cent of the admitted corporate insolvency resolution processes were triggered by operational creditors (OC) and about 40 per cent by financial creditors (Table 3.4). 3.22 The resolution plan with respect to six of the 12 large borrowers of SCBs that constituted the first batch of referrals to IBC for resolution have been approved. Other accounts are in different stages of the process. The outcome of the six large accounts that ended with resolution plans is given in Table 3.7. 3.23 Rising stress in balance sheets of companies and that of large banks and the recovery risks associated with credit portfolios has led to deliberations on an optimal institutional response to tackle the NPA overhang. The framework pertaining to resolution of NPAs has evolved from asset reconstruction companies (ARCs) to setting up of resolution mechanisms under IBC. While so far this chapter has dealt with recovery related performance under IBC, Box 3.2 gives insights into the performance of asset reconstruction companies (ARCs).
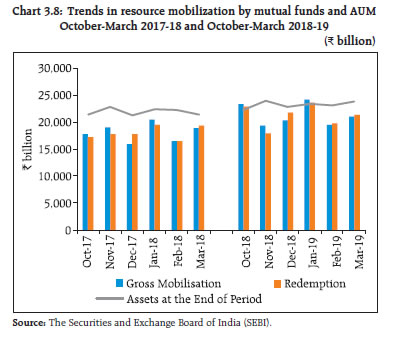
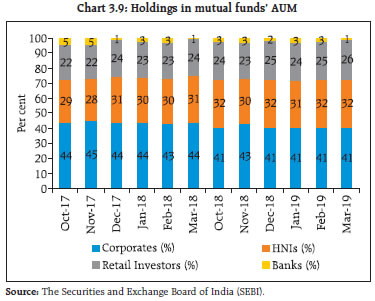
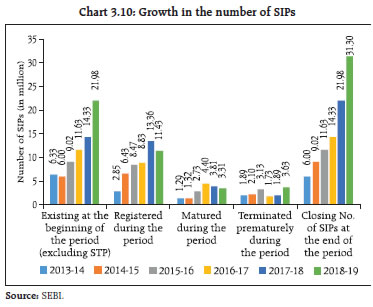
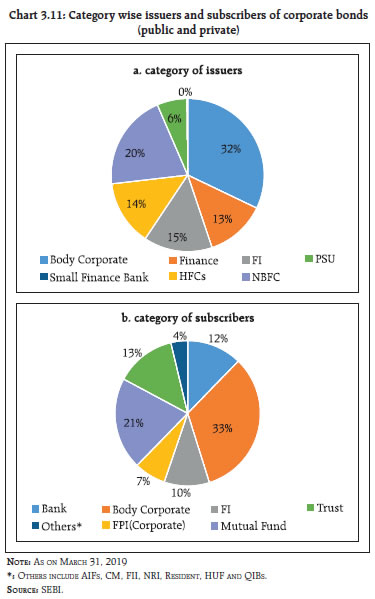
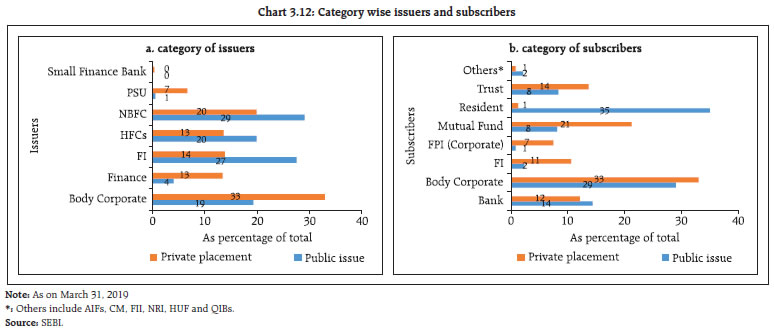
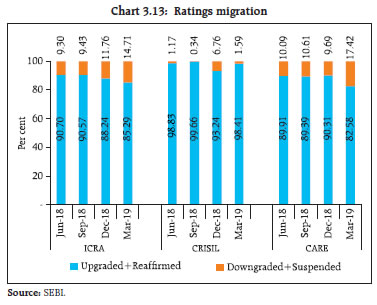
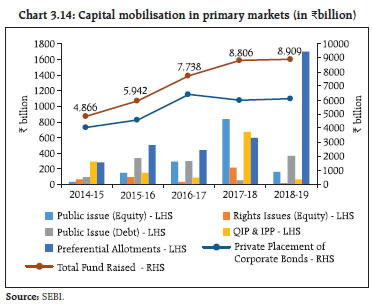
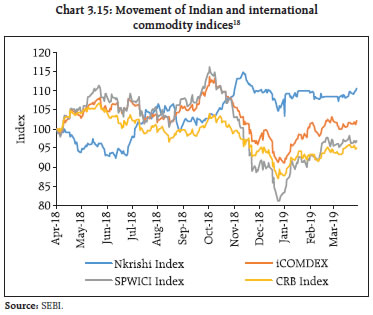
III. Securities and commodity derivatives markets (A) Regulatory developments 3.24 The broad guidelines to operationalise the interoperability framework between clearing corporations by June 01, 2019 have been laid down. Interoperability provides for linking of multiple clearing corporations and allows market participants to consolidate their clearing and settlement functions at a single clearing corporation, irrespective of the stock exchange on which the trade is executed. It is envisaged that interoperability will lead to efficient allocation of capital for market participants, thereby saving on costs and also providing better trade execution. 3.25 To bring the margin period of risk (MPOR) in greater conformity with the principles for financial market infrastructures (PFMI), and based on the recommendations of the SEBI’s Risk Management Review Committee (RMRC), it was decided that: a) Stock exchanges/clearing corporations estimate the appropriate MPOR, subject to a minimum of two days, for each equity derivative product based on liquidity therein and scale up the applicable margins accordingly. b) With a view to make the risk management framework more robust, the payment of mark-to-market (MTM) margin be mandatorily made by all the members before start of trading on the next day. c) To align the margin across index futures and index options contracts, the short option minimum charge (SOMC) for index option contracts was revised to 5 per cent from 3 per cent. (B) Market developments (i) Mutual funds 3.26 During October 2017 – March 2018 there was a net inflow of ₹697.9 billion, which declined by 9.2 per cent to ₹639.4 billion in October 2018 – March 2019. AUM increased by 11.4 per cent in March 2019 compared to March 2018 (Chart 3.8). SIP has been growing continuously, which is adding stability to the inflows. 3.27 Share of Individual holdings in total AUM, which comprises of the holdings of retail and HNIs, grew from 51.2 per cent in October 2017 to 56.4 per cent in October 2018 and it further increased to 58.1 per cent in March 2019. The individual category AUM had grown by 17.8 per cent by the end of March 2019 as compared to March 2018. 3.28 Share of Institutional holdings, which comprise of corporates and banks declined from 48.8 per cent in October 2017 to 43.6 per cent in October 2018 and it further declined to 41.9 per cent in March 2019. Sustained growth in individual holdings in mutual funds could provide more diversity in holding patterns and consequent stability to mutual funds from the point of redemption pressures (Chart 3.9). 3.29 Systematic investment plans (SIPs) grew constantly and remained a favoured choice for investors (Chart 3.10). Net folio increase during 2018-19 over 2017-18 was 9.3 million, which is a 42.4 per cent increase during the year. There was enormous growth of 421.6 per cent in the number of SIPs from 2013-14 to 2018-19 with the numbers increasing from 6 million to 31.3 million. Investments through SIPs in mutual funds are relatively more stable from the point of view of sustainability of fund inflows. (ii) Trends in capital mobilisation (a) Corporate bonds 3.30 During 2018-19, ₹366.8 billion was raised through 25 public issues in the bond market, which is highest in the last five years. Additionally, corporate bonds worth more than ₹6 trillion issued through private placement were listed on stock exchanges during the same period (Chart 3.11). The major issuers of corporate bonds were body corporates and NBFCs accounting for more than 50 per cent of outstanding corporate bonds as on March 31, 2019 (Chart 3.11 a) whereas body corporates and mutual funds were their major subscribers (Chart 3.11b). Chart 3.12 details the disaggregated issuer / investor profiles of public and private issuances. 3.31 An analysis of the credit rating of debt issues of listed companies by major credit rating agencies (CRAs) in India for the last four quarters shows that on an aggregate basis there was an increase in the share of downgraded/ suspended companies during the September - December 2018 and January - March 2019 quarters. The agency wise rating movements confirm the trend with the exception of CRISIL (Chart 3.13). (b) Initial public offerings (IPOs) 3.32 The incremental yearly growth in Capital raised through primary markets flatlined (₹8.9 trillion) after an impressive growth of 10 per cent in 2017-18 (8.8 trillion) (Chart 3.14). 3.33 During 2018-19, the funds raised by public and rights issues in equities went down significantly by more than 80 per cent as compared to 2017-18. However, capital raised by public issues in the debt market witnessed a sharp increase during the same period. The funds raised by preferential allotments also went up 2.9 times during 2018-19 as compared to 2017-18. (iii) Commodity derivatives 3.34 During 2018-19, benchmark index TR-MCX iCOMDEX increased by 2.1 per cent and NCDEX NKrishi increased by 12.4 per cent. During the same period, the S&P World Commodity Index decreased by 3.1 per cent and the Thomson Reuters CRB Index decreased by 5.9 per cent. During October 2018 – March 2019, TR-MCX iCOMDEX declined by 6.8 percent while the NCDEX NKrishi Index increased by 7.8 per cent. Both the S&P World Commodity Index and the Thomson Reuters CRB Index declined during the same period by 13.7 percent and 5.8 percent respectively (Chart 3.15) 3.35 The total turnover at all the commodity derivative exchanges (futures and options combined) saw a growth of 22.6 per cent during April 2018-March 2019 as compared to April 2017-March 2018. During 2018-19, the volume of commodity futures registered a growth of 19.8 per cent while the options volume jumped over 16 times19 in comparison to last year. 3.36 The commodity derivatives markets witnessed mixed trends during October 2018–March 2019. Concerns of US-China trade tensions, slower economic growth in China, and other commodity specific fundamentals reverberated with decline of metal segment. In the energy segment, array of geopolitical and macroeconomic factors impacted the crude oil prices. The total share of non-agri derivatives in the turnover was observed to be 91.1 per cent during October 2018 – March 2019 (Table 3.8). 3.37 Trading in commodity derivatives commenced at BSE and NSE from October 2018. Commodities currently trading on BSE include gold, silver, crude oil, copper, guar gum, guar seed and cotton. The commodities trading at NSE include gold, silver and crude oil. IV. The insurance market 3.38 Exponential growth in insurance was observed post opening up of the sector in 2000-01. Sizeable market share coupled with higher interconnectivity of some insurers engendered a need to identify systemically important insurers as also to have adequate regulatory framework for them. 3.39 The risk-based capital (RBC) approach links the level of required capital with the risks inherent in the underlying business. It represents an amount of capital that a company should hold based on an assessment of risks to protect stakeholders against adverse developments. In September 2017, IRDAI formed a ten-member steering committee for planning and implementation of Risk-based solvency regime. 3.40 IRDAI constituted a ‘Project Committee’ to study and develop an appropriate framework for Risk-based Supervisory Framework in Insurance industry. The Project Committee submitted their report in November 2017. Subsequently, in January 2018, an Implementation Committee was formed which has submitted its interim report in June 2018. A note to the industry regarding Authority’s intention of moving towards Risk Based Supervisory Framework (RBSF) was circulated to all the insurance companies in October 2018. V. Pension funds 3.41 The National Pension System (NPS) and Atal Pension Yojana (APY) both continued to progress towards healthy numbers in terms of the total number of subscribers as well as assets under management (AUM). The number of subscribers in NPS and APY reached 12.4 million and 14.9 million respectively (Table 3.9). AUM under NPS and APY touched ₹3.11 trillion and ₹68.60 billion respectively (Table 3.10). 3.42 The Pension Funds Regulatory and Development Authority (PFRDA) continued its work for financial inclusion of the unorganised sector and low-income groups by expanding the coverage under APY. As on 31st March 2019, 406 banks were registered under APY with the aim of bringing more citizens under the pension net. 3.43 As on March 31, 2019 pension funds under NPS had an aggregate debt exposure (investments in debentures issued by IL&FS) of around ₹12.8 billion to the distressed IL&FS Group. The total NPAs in this exposure were around ₹3.6 billion as on March 31, 2019. Out of this exposure, ₹2.3 billion is in the form of unsecured debt. As per the recent National Company Law Appellate Tribunal (NCLAT) order dated February 13, 2019, all investments made in IL&FS by PFs are now classified as ‘Red’ category under IBC, meaning that these companies are not even able to make payments to senior secured financial creditors. 3.44 Given the sudden and sharp downgrade of some corporate debt by credit rating agencies (CRAs), PFRDA advised the pension funds not to depend only on the ratings given by the rating agencies but also undertake detailed research and analysis of the issuer/entity in which they propose to make investments. VI. Recent regulatory initiatives and their rationale 3.45 Some of the recent regulatory initiatives, along with the rationale thereof, are given in Table 3.11. 1 Available at: https://eba.europa.eu/documents/10180/2087449/Report+on+IFRS+9+impact+and+implementation.pdf 4 A sample of 54 banks across 20 member states although CET1’s day-1 impact data was collected from 43 banks only. 5 Without reckoning transitional arrangements. 6 Implying 0 per cent of the assets beyond 30 days past due are being classified under stage 1. 7 Implying all assets beyond 90 days past due are being classified under stage 3 impaired. 8 The Basel 2.5 reforms included requirements for banks to hold additional capital against default risks and ratings migration risk (that is, the risk that a rating change triggers significant mark-to-market losses). The reforms also required banks to calculate an additional value-at-risk (VaR) capital charge calibrated to stressed market conditions (‘stressed VaR’). Basel 2.5 also removed most securitisation exposures from internal models and instead required such exposures to be treated as if held in the banking book. 9 Available at: https://www.bis.org/publ/qtrpdf/r_qt1812h.htm 10 Available at: https://www.iosco.org/library/pubdocs/pdf/IOSCOPD618.pdf 11 Available at: https://www.iaisweb.org/page/consultations/closed-consultations/2019/holistic-framework-for-systemic-risk-in-the-insurance-sector//file/77862/holistic-framework-for-systemic-risk-consultation-document 12 Available at: https://www.bis.org/bcbs/publ/d454.htm 13 Available at: http://www.fatf-gafi.org/media/fatf/documents/G20-April-2019.pdf 14 The data for the purpose of this analysis is as reported by banks and select Financial Institutions and is subject to change by way of rectification and updation due to developments subsequent to initial reporting. 16 Recovery measured as a proportion of total bank claims, net of management costs discounted @10% to the respective year of origination. 17 Recovery measured as a proportion of total SRs issued, net of management costs discounted @10% to the respective year of origination. 18 The TR-MCX iCOMDEX Commodity Index is a composite index based on the traded futures prices at MCX comprising a basket of contracts of bullion, base metal, energy and agri commodities. The NCDEX NKrishi is a value weighted index, based on the prices of the 10 most liquid commodity futures traded on the NCDEX platform. The S&P World Commodity Index is an investable commodity index of futures contracts traded on exchanges outside the US comprising of energy, agricultural products, industrial and precious metals. The Thomson Reuters/Core Commodity CRB Index is based on exchange traded futures representing 19 commodities, grouped by liquidity into four groups of Energy, Agriculture, Livestock and Metals. 19 The large relative jump in commodity options volume in FY 2018-19 is due to base effect, as these options started trading only in October 2017. | ||||||||||||||||||||||||||||||||||||||||||||||||||||||||||||||||||||||||||||||||||||||||||||||||||||||||||||||||||||||||||||||||||||||||||||||||||||||||||||||||||||||||||||||||||||||||||||||||||||||||||||||||||||||
పేజీ చివరిగా అప్డేట్ చేయబడిన తేదీ:


