 IST,
IST,
VI. Price Situation
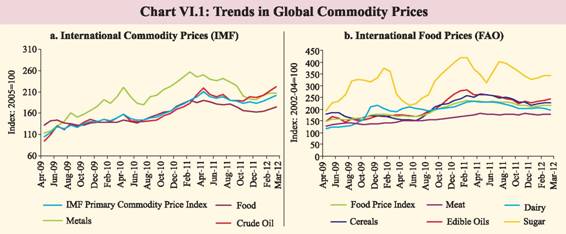
2011-12 was marked by strong inflationary pressures that began easing only in December. The recent fall in inflation has been largely supported by transitory factors such as a seasonal decline in vegetable prices and favourable base effect. However, demand moderation, reflected in the dampening of the pricing power of producers has also played a role. Meanwhile, more permanent supply-side responses, for example in the dairy sector, have just begun to take shape. Going forward, inflation in 2012-13 is likely to remain around current levels. Importantly, the near-term inflation trajectory is subject to significant upside risks, in particular from high oil prices and unsustainable levels of suppressed inflation, the lagged pass-through impact of rupee depreciation, higher freight rates and taxes, sustained wage pressures, and the structural nature of protein-food inflation. Central banks eased further with larger risks to global growth even as global inflation risks remain VI.1 Weak global growth momentum kept global inflation risk under check during 2011. However, global metal prices, after softening for large part of the year firmed up during Q4 of 2011-12. Global crude prices that surprised on the up for most of 2011-12, not only remained elevated but also increased significantly during Q4 of 2011-12. As a result, upside risks persist. Inflation divergence between emerging and developing economies (EDEs) and advanced economies (AEs) also persisted. As EDEs have a higher share of commodities in their consumption baskets, higher commodity prices are likely to exert larger pressure on inflation in EDEs than on AEs. VI.2 The uncertainty in the global growth outlook and volatility in commodity prices impart considerable uncertainty on the near- term global inflation outlook. Incomplete deleveraging of the private sector and the urgency of fiscal consolidation in many parts of the AEs to reduce the looming debt burden may further weaken demand-side risks to inflation. On the other hand, sustained easy monetary conditions and supply disruptions in commodity markets pose significant upside risks. VI.3 The monetary policy focus across countries, both AEs and EDEs has changed course significantly since mid-2011 as concerns about sustaining the recovery of economic growth in AEs and strength of growth impetus in EDEs increasingly weighed in the monetary policy stance adopted by the central banks. Central banks in AEs have generally reduced their policy rates or kept them at near-zero levels while the ECB also resorted to long-term repurchase operations (LTRO). The central banks of EDEs, which were earlier raising policy rates to control inflation, turned course and reduced policy rates and eased liquidity conditions to address growth concerns (Table VI.1). Upside risks to global commodity prices are significant in 2012-13 VI.4 Global commodity price pressures, except those on crude oil, generally remained subdued for most of 2011-12 before accelerating in Q4 (Chart VI.1). Global crude oil prices also increased significantly in Q4 of 2011-12 as geo- political tensions and concerns about supply disruptions contributed to price pressures. The path of global commodity prices in 2012-13 is uncertain. On current assessment, during the year, Indian basket crude oil prices could average around the current levels of about US$ 120/barrel but both upside and downside risks to this projection remain large. The slow growth in AEs and the deceleration in China coupled with the fact that commodity prices have hardened significantly in the past two years provide some hope that high commodity prices may correct somewhat during the course of the year. However, the global liquidity glut and the financialisation of global commodity markets constitute a significant upside risk (see V.23-V.24).
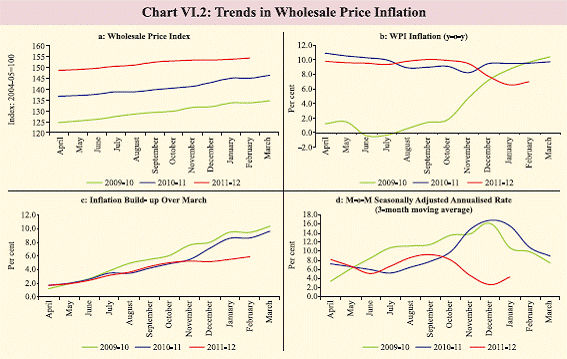
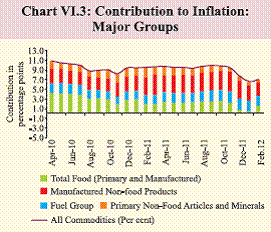
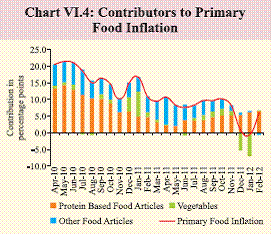
Headline inflation in India softened in line with projected trajectory VI.5 After almost two years of sustained high inflation, inflation started declining from November 2011. Headline inflation, which was at 10 per cent in September 2011, declined to 6.6 per cent by January 2012. Though inflation increased marginally in February 2012, the momentum indicators, as measured by 3-month moving average seasonally adjusted month- over-month changes, suggest softening of price pressures (Chart VI.2). VI.6 In terms of contribution to overall inflation, the decline has been prominent for food (Chart VI.3). The contribution of non-food manufactured products has declined gradually over the recent months alongside the deceleration in growth momentum. The contribution of the fuel group to overall inflation remains high, despite the current levels of domestic petroleum prices not fully reflecting global market prices. Primary food inflation reversed after the sharp decline as transitory effects waned VI.7 The sharp decline in primary food inflation witnessed during Q3 of 2011-12 was the result of favourable base effect and a more than expected seasonal decline in vegetable prices. As was assessed in the previous edition of this document, the decline of food inflation to negative territory was a temporary phenomenon and primary food inflation increased sharply from -0.5 per cent in January 2012 to 6.1 per cent in February 2012 (Chart VI.4). Both the waning base effect and the increase in prices of vegetables from a seasonal trough contributed to the rebound in food inflation.
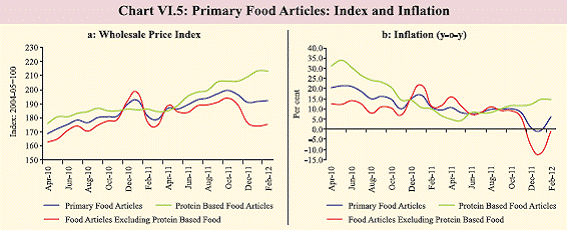
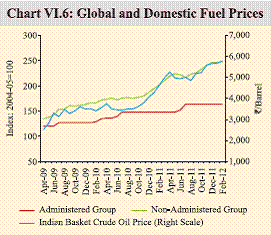
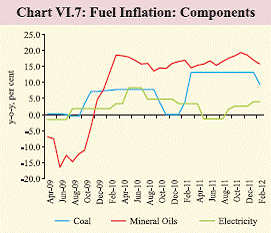
Although protein inflation declined in 2011-12, structural demand-supply imbalances keep it high VI.8 On a yearly average basis, protein inflation softened to about 10 per cent in 2011- 12 (April-February) after remaining close to 20 per cent in the preceding two years. However, it still remains high and has been rising steadily since August 2011 (Chart VI.5). High inflation in protein-rich food items along with significant upward revisions in Minimum Support Prices (MSP) and increases in rural wages in excess of inflation have imparted upward push to food inflation. Besides the lagged supply response, input cost pressures have led to sustained double-digit inflation in protein-rich food items. Recognising the importance of supply- augmenting measures to address the concerns about food inflation, the government in the Union Budget for 2012-13 announced a number of measures to augment supply and improve storage and warehousing facilities. These schemes include a `22 billion project to improve productivity in the dairy sector, and a national mission for ‘Food Processing’, apart from provisions to add storage capacity for foodgrains. These supply-side measures will help in containing food inflation but the overall benefits will be realised only with a lag. Energy prices likely to remain a significant source of inflation VI.9 A major concern on the inflation front continues to be high fuel prices driven by the increase in international oil prices. Domestic fuel group inflation that captures changes in energy prices has been in double-digit for 25 successive months (up to February 2012). The increase in fuel group inflation has largely been driven by increase in prices of mineral oils, besides moderate increases in coal and electricity prices. Most importantly, suppressed inflation in administered prices continues to remain substantial and significant increases in crude oil prices in Q4 of 2011-12 and exchange rate depreciation in H2 of 2011-12 have amplified the magnitude of suppressed inflation (Chart VI.6). Currently, the estimated under- recoveries by domestic oil marketing companies for diesel and PDS kerosene are `14.36 and `31.04 per litre, respectively, and `570.50 per cylinder for domestic LPG. The Union Budget for 2012-13 has budgeted a lower amount towards fuel subsidy; if subsidies have to be contained within the budgeted limits, it would require a significant revision in administered fuel prices, which would lead to spike in price levels. This would translate into higher price level in the near-term but inflation would later moderate and suppressed inflation pressures would also wane. Therefore, while fuel inflation risks remain significant in the near term, even if global crude prices ease moderately from current levels, the deregulation of fuel prices is a desired policy option.
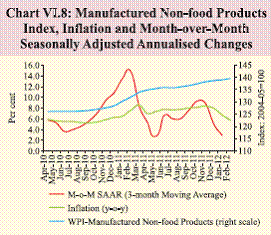
VI.10 Apart from oil prices, another source of risk to inflation is the possible upward revision in coal prices. Electricity prices are also likely to come under pressure from higher input costs (Chart VI.7). Generalised price pressures soften as growth deceleration eases demand VI.11 After remaining over 7 per cent for 11 consecutive months, non-food manufactured products inflation started to decline from January 2012 and reached 5.8 per cent by February 2012 as growth deceleration dampened demand pressures. Month-over-month increases in prices have moderated in recent months (as per the 3-month moving average SAAR) (Chart VI.8). The increase in railway freights and the rollback of an earlier cut in excise duty (as part of the Railway Budget and Union Budget, respectively), however, will increase cost pressures, which could lead to an increase in the prices of non-food manufactured products, thereby increasing inflation in the short-term. The pass-through of these fiscal measures over time do not constitute an upside risk to the medium-term inflation trajectory.
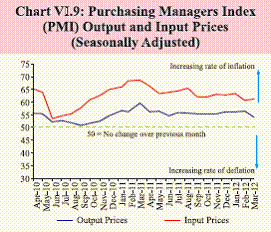
VI.12 Pressure from input costs is yet to soften and input cost increases continue to be much higher than increases in output prices, as is borne out by the HSBC Markit Purchasing Managers Index (PMI) for input and output prices (Chart VI.9). This could further squeeze profit margins in an environment of weak demand.
Exchange rate pass-through risks remain significant VI.13 Since August 2011, the depreciation of the rupee has emerged as a major upside risk to the inflation trajectory (Table VI.2). Even though global commodity prices moderated, the sharp depreciation of the rupee between August and December 2011 more than offset the impact of declining commodity prices. Since January 2012, the rupee has appreciated while international commodity prices have firmed up. Apart from the commodity price outlook, exchange rate movements have added uncertainty to the inflation trajectory. Pass- through of both depreciation of the exchange rate and higher oil prices have been partial so far due to suppressed inflation in the fuel group.
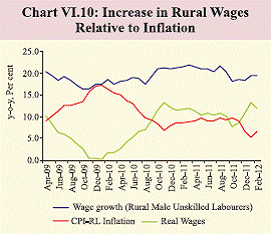
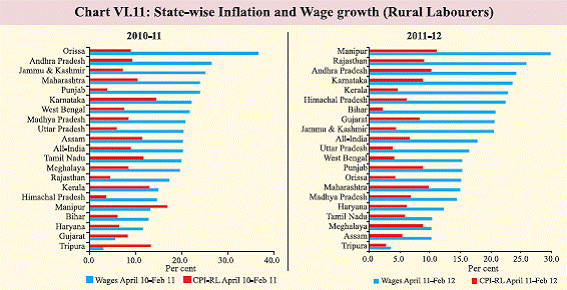
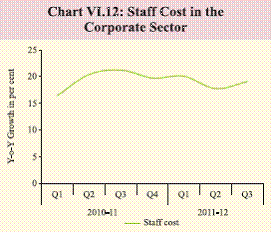
Wage pressures in both rural and urban areas are yet to soften VI.14 The pressure on generalised inflation from sustained increase in wage costs has been one important characteristic of the recent high inflation episode. Wage increases for unskilled labourers in rural areas continue to be at a rate faster than the comparable rate of inflation (i.e., CPI-RL) (Chart VI.10). There are, however, significant divergences across major States (Chart VI.11). Similarly, in the formal sector, the analysis of company finance data suggests that growth in staff costs remain firm (Chart VI.12). Private market surveys also suggest relatively higher rates of increase in salaries and perks in the organised sector in India compared with other countries. A host of factors could explain the increase in wages, including high inflation, withdrawal of the labour force with increased participation in education and government schemes such as MGNREGS. Though rising real wages could enhance welfare, the inflationary implications of high increases in wages have to be managed to sustain the benefits from high growth.
New CPIs show sustained increase in price levels VI.15 Annual inflation according to the new CPI became available for the first time in January 2012. The latest data show that inflation was higher in urban areas (9.5 per cent) than in rural areas (8.4 per cent) leading to all-India inflation of 8.8 per cent for February 2012 (Table VI.3). While part of the higher CPI inflation reflects the high weight of food in the consumption basket (49.7 per cent for all- India), stronger price pressures in services included in the CPI basket point to the persistence of generalised inflation. This is also reflected in the all-India CPI excluding food and fuel inflation being high at 10.1 per cent as compared to the WPI excluding food and fuel inflation of 7.0 per cent for February 2012. Once longer time series information on CPI inflation becomes available, trends in services prices will improve the assessment of the generalised inflation process. CPI- Industrial Workers inflation was at 7.6 per cent while CPI-Rural Labourers and CPI-Agricultural Labourers inflation were at 6.7 and 6.3 per cent, respectively, in February 2012, which are much lower than the inflation reported by the new CPI.
Inflation moderated in response to slowing growth but upside risks remain VI.16 The impact of the slowdown in growth momentum on generalised inflation has been visible as inflation in the non-food manufactured products category receded in recent months. However, the inflation outlook for 2012-13 needs to factor in significant upside risks. These emerge from volatile commodity prices, lagged pass-through of the exchange rate depreciation, sustained wage push pressures, unsustainable levels of suppressed inflation and likely sustained government spending as consolidation is mainly due to revenue-augmenting fiscal measures. The spatial and temporal distribution of the south-west monsoon has always been a major determinant of short-term food inflation, while structural factors continue to play a major role in conditioning food inflation dynamics. Recent measures announced in the Union Budget to improve supply responses in the agriculture sector and protein-rich food are expected to yield positive results, but not immediately. Against this backdrop, monetary policy has to recognise the need for keeping inflation expectations anchored in an environment of significant upside risks to inflation, while shifting the balance of policy to arrest the deceleration in growth momentum. |
|||||||||||||||||||||||||||||||||||||||||||||||||||||||||||||||||||||||||||||||||||||||||||||||||||||||||||||||||||||||||||||||||||||||||||||||||||||||||||||||||||||||||||||||||||||||||||||||||||||||||||||||||||||||||||||||||||||||||||||||||||||||||||||||||||||||||||||||||||||||||||||||||||||||||||||
పేజీ చివరిగా అప్డేట్ చేయబడిన తేదీ:


