The external debt data for end-June 2007 have been compiled. As per the current practice, India's external debt statistics are compiled and published for four reference periods in a fiscal year viz., for end-March in the Reserve Bank's Annual Report, for end-June in the Reserve Bank's Monthly Bulletin, for end-September in the Economic Survey, Ministry of Finance (MoF), Government of India (GoI) and for end-December in 'India's External Debt: A Status Report', MoF, GoI. A detailed account of external debt in the standard format as at end-June 2007 in rupee and dollar terms is presented in Statement 1 and Statement 2, respectively. The data on external debt have been revised since June 2005 to include data on non-resident (ordinary) (NRO) account deposits under the non-resident Indian deposits which are now compiled. As a result of the inclusion of NRO deposits in external debt, the stock of external debt has been revised upward since the quarter ending June 2005.
I. Stock of External Debt
The external debt was placed at US $ 165.4 billion at the end of June 2007 recording an increase of US $ 8.7 billion or 5.6 per cent over the end-March 2007 level (Table 1 and Chart 1). According to the component analysis, external commercial borrowings (ECBs) contributed around 63 per cent of the increase in total external debt, followed by NRI deposits (15.6 per cent) and trade credit up to one year maturity, excluding the suppliers’ credit up to 180 days (12 per cent).
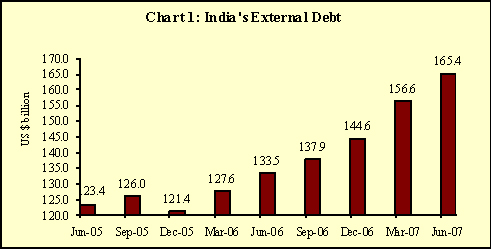
Table 1: Outstanding External Debt
At end of |
Total
External
Debt
(US $ million) |
Variation (in US $ million) |
Over corresponding
quarter previous year |
Over previous
quarter |
(1) |
(2) |
(3) |
(4) |
Jun 05 |
123,438 |
10,661 (9.5) |
-722 (-0.6) |
Sep 05 |
126,045 |
13,074 (11.6) |
2,607 (2.1) |
Dec 05 |
121,361 |
1,028 (0.9) |
-4,684 (-3.7) |
Mar 06 |
127,623 |
3,463 (2.8) |
6,262 (5.2) |
Jun 06 |
133,455 |
10,017 (8.1) |
5,832 (4.6) |
Sep 06 |
137,942 |
11,897 (9.4) |
4,487 (3.4) |
Dec 06 |
144,578 |
23,217 (19.1) |
6,636 (4.8) |
Mar 07 |
156,649 |
29,026 (22.7) |
12,071 (8.3) |
Jun 07 |
165,394 |
31,939 (23.9) |
8,745 (5.6) |
Note: Figures in parentheses indicate percentage increase.
II. Components of External Debt
Among the various components of external debt, external commercial borrowings (ECB) at US $ 48.3 billion have recorded a significant increase of US $5.5 billion (12.9 per cent) during the first quarter of 2007-08 (Table 2 and Chart 2). Ongoing technological upgradation and modernisation combined with expansion of domestic industrial activities have led to increased investment demand by Indian companies which are reflected in increase of external commercial borrowings (including FCCBs).
The NRI deposits at US $ 42.6 billion at end-June 2007, showed an increase of US $ 1.4 billion. Despite an outflow from NRI deposits, the above increase was on account of valuation gain. The outstanding NRO deposits amounted to US $ 1,616 million at end-March 2007 and US $ 1,846 million at end-June 2007.
Among other components, short term trade credit (up to one year maturity excluding suppliers’ credit up to 180 days maturity) recorded an increase of US $ 1.0 billion (8.8 per cent), whereas trade credit above one year maturity witnessed an increase of US $ 818 million (11.7 per cent) during the quarter ended June 2007 over end-March 2007. While multilateral debt showed an increase of US $ 317 million (0.9 per cent), bilateral debt declined by US $ 417 million (2.6 per cent) during the first quarter of 2007-08.
Table 2: Variation in External Debt by Components
Item |
At the end-of |
Variation during end-June 2007
and end March 2007 |
June 07 |
March 07 |
March 06 |
|
(US $ million) |
|
(US $ million) |
(Per cent) |
(1) |
(2) |
(3) |
(4) |
(5) |
(6) |
1. Multilateral |
35,958
(21.7) |
35,641
(22.8) |
32,559
(25.5) |
317 |
0.9 |
2. Bilateral |
15,687
(9.5) |
16,104
(10.3) |
15,734
(12.3) |
-417 |
-2.6 |
3. IMF |
0
(0.0) |
0
(0.0) |
0
(0.0) |
0 |
0.0 |
4. Trade Credit |
|
|
|
|
|
a. Above 1 year |
7,782
(4.7) |
6,964
(4.4) |
5,419
(4.2) |
818 |
11.7 |
b. Up to 1 year* |
13,019
(7.9) |
11,971
(7.6) |
8,696
(6.8) |
1,048 |
8.8 |
|
|
|
|
|
|
5. Commercial Borrowings |
48,314
(29.2) |
42,780
(27.3) |
26,902
(21.1) |
5,534 |
12.9 |
6. NRI Deposits (long-term) |
42,603
(25.8) |
41, 240
(26.3) |
36,282
(28.4) |
1,363 |
3.3 |
7. Rupee Debt |
2,031
(1.2) |
1,949
(1.2) |
2,031
(1.6) |
82 |
4.2 |
8.Total Debt |
165,394
(100.0) |
156,649
(100.0) |
127,623
(100.0) |
8,745 |
5.6 |
Memo Items |
A. Long-Term Debt |
152,375
(92.1) |
144,678
(92.4) |
118,927
(93.2) |
7,697 |
5.3 |
B. Short-Term Debt |
13,019
(7.9) |
11,971
(7.6) |
8,696
(6.8) |
1,048 |
8.8 |
Figures in parentheses indicate share to total debt.
* Exclude suppliers’ credit of up to 180 days maturity.
III. Currency Composition
The currency composition of India’s external debt remained broadly unchanged with the US Dollar continuing to remain the predominant currency accounting for 50.4 per cent of the total external debt stock, followed by the Indian rupee (18.0 per cent), SDR (12.3 per cent) and Japanese yen (12.0 per cent) (Table 3 and Chart 3).
Table 3: Currency Composition of External Debt
(Percentage share in total external debt) |
Currency |
At end-June 2007 |
At end-March 2007 |
(1) |
(2) |
(3) |
US Dollar |
50.4 |
48.6 |
SDR |
12.3 |
13.1 |
Indian Rupee |
18.0 |
18.2 |
Japanese Yen |
12.0 |
12.7 |
Euro |
4.1 |
4.4 |
Pound Sterling |
2.8 |
2.6 |
Others |
0.4 |
0.4 |
Total |
100.0 |
100.0 |
IV. Valuation Changes
As mentioned earlier, the stock of total external debt at end-June 2007 witnessed an increase of US $ 8.7 billion. Out of this, the increase of US $ 1.2 billion was on account of valuation effects, reflecting the depreciation of the US dollar against other major international currencies. This would imply that excluding the valuation effects, the stock of external debt as at end-June 2007 increased by about US $ 7.5 billion.
V. Indicators of Debt Sustainability
External debt sustainability indicators of India are set out below (Table 4):
- The share of concessional debt in total external debt declined substantially to 23.8 per cent at end-June 2007 from 25.5 per cent at end-March 2007 and 30.9 per cent at end-March 2006. This development indicates the increasing importance of external borrowings from private sources on commercial terms.
- India’s foreign exchange reserves exceeded the external debt by US $ 48.0 billion providing a cover of 129.0 per cent to the external debt stock at the end of June 2007 as compared with 127.1 per cent as at end-March 2007 level (Chart 4).
- The debt service ratio (ratio of total debt servicing to total current receipts) was placed lower at 4.6 per cent during the first quarter of 2007-08 as compared with 4.8 per cent during 2006-07 and 9.9 per cent during 2005-06.
- Short term debt excluding the suppliers’ credit up to 180 days maturity stood at US $ 13 billion, accounting for 7.9 per cent of the total debt.
- Short term debt excluding the suppliers’ credit up to 180 days maturity to reserves ratio remained almost at around 6 per cent since end-March 2006.
Table 4: Indicators of Debt Sustainability
(Per cent) |
Indicators |
End-June 2007 |
End-March 2007 |
End-March 2006 |
(1) |
(2) |
(3) |
(4) |
Total debt /GDP |
- |
16.6 |
16.0 |
Short-term/GDP* |
- |
1.3 |
1.1 |
Short-term/Total debt* |
7.9 |
7.6 |
6.8 |
Short-term debt/Reserves* |
6.1 |
6.0 |
5.7 |
Concessional debt/Total debt |
23.8 |
25.5 |
30.9 |
Reserves/ Total debt |
129.0 |
127.1 |
118.9 |
Debt Service Ratio** |
4.6 |
4.8 |
9.9 |
Note: Debt service ratio is defined as a ratio of total debt servicing to total current receipts.
* excluding suppliers’ credit up to 180 days.
** relates to April-June 2007, fiscal year 2006-07 and 2005-06.
Alpana Killawala
Chief General Manager
Press Release :2007-2008/439
|
 IST,
IST,