RbiSearchHeader

Press escape key to go back

Past Searches

Theme
Theme
Text Size
Text Size
S2

RbiAnnouncementWeb

RBI Announcements
RBI Announcements

Asset Publisher

83643419

Consumer Confidence Survey: March 2012

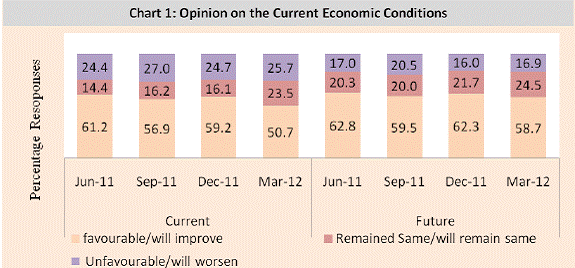
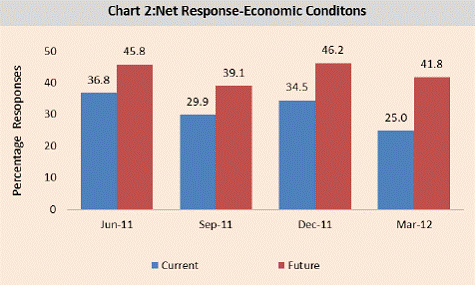
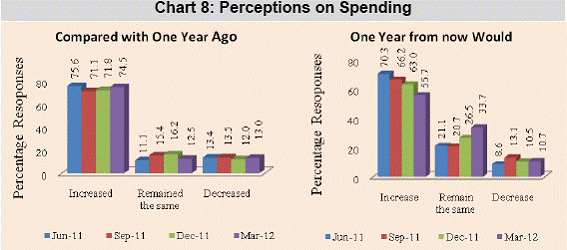
This article presents the salient findings of the Consumer Confidence Survey conducted in March 2012, the 8th round in the series.It gives an assessment of the consumer sentiments of the respondents based on their perceptions of the general economic conditions and their own financial situation.The assessments are analysed in two parts,viz.,current situation as compared with a year ago and expectations for a year ahead.

The survey indicates that, households’ perception about current economic conditions and expectation for next one year has decreased in terms of net response; however, more than half of the respondents continue to feel that the current economic conditions and future prospects are favourable. Majority of respondents perceived that household circumstances have become better, though the proportion of respondents reporting worsening of current household circumstances has increased as compared with the previous round. More than half of the respondents reported an increase in income, but this proportion has been declining over the last four rounds. A similar decreasing trend is observed in case of expectation of increased income in the next year; this may have also affected further spending intentions.

I. Introduction

The change in consumer confidence has the potential to affect real economic activities through the changes in business sentiments. The Reserve Bank has been conducting a Quarterly Consumer Confidence Survey for obtaining the qualitative information,since June 2010. The 8th round of the survey was conducted in March 2012.

II. Sampling Design

The survey covers six metropolitan cities, viz., Bangalore, Chennai, Hyderabad, Kolkata, Mumbai and New Delhi.Each city is divided into three major areas and each major area is further divided into three sub-areas. From each sub-area, about 100 respondents are selected randomly. For each round of survey 5,400 respondents are selected (900 respondents from each city). For the current round, out of the total 5,400 survey schedules, 5,352 schedules were found to be suitable for the further analysis.

III. Structure of the Survey Questionnaire*

The survey schedule consists of qualitative questions pertaining to impression about economic conditions, views on household circumstances, perceptions on price level, perception on employment prospects, developments in real estate prices and views on growth potential of the Indian economy.

IV Survey Results: Key Highlights

IV.1 Economic Conditions

  • About 51 percent of the respondents reported economic conditions to be favourable as compared with a year ago and about 59 percent reported that the economic conditions would be favourable in the next one year (Chart 1).

C1
  • There is a shift in responses from ‘favourable’ to ‘no change’ (neutral).This shift has led to a fall in the net-response on economic conditions (Chart 2).

C2

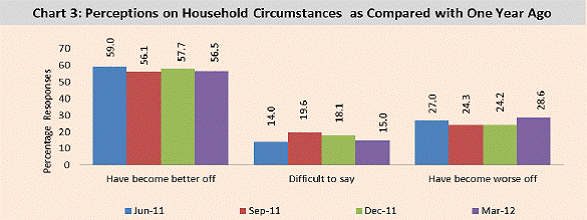
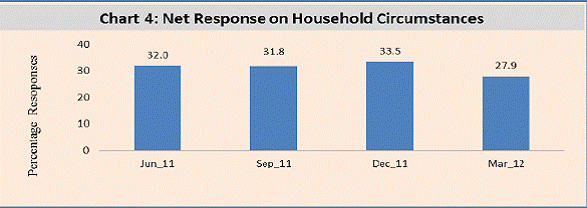
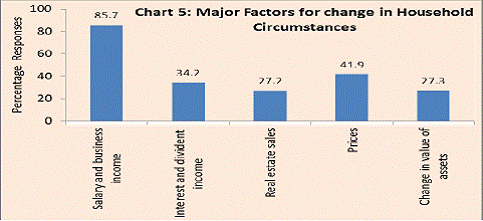
IV.2 Household Circumstances

  • Though majority of the respondents perceived that household circumstances have become better off,the proportion of respondents reporting worsening of current household circumstances has increased (Chart 3).

C3
  • As a result, net response on household circumstances declined to some extent (Chart 4).

C4
  • Among the respondents who perceived change (better-off/worse-off) in household circumstances as compared with one year ago, around 85 percent reported ‘salary and business income’, as a main factor for change in household circumstances (Chart 5). Other important factors leading to change in household circumstances are ‘price level’, ‘interest and dividend income’, ‘value of assets’ and ‘income from sales of real estate’.

C5

Note: As respondents may report multiple factors,total of percentage relating to factors may be more than 100.

IV.3 Income

  • More than half of the respondents reported an increase in current as well as future income; however, this proportion has gradually declined over the last four rounds (Chart 6).

  • About one third of the respondents felt that their income would remain the same in next one year.The proportion of such responses has been increasing in the last four quarters.

C6
  • The net response on current and future income has declined marginally in March 2012 as compared with December 2011 (Chart 7).

C7

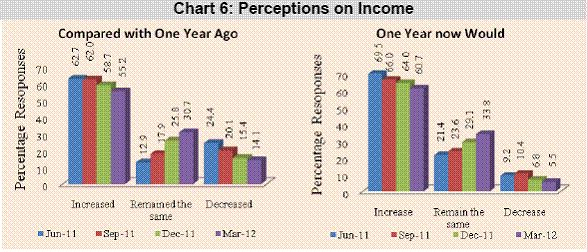
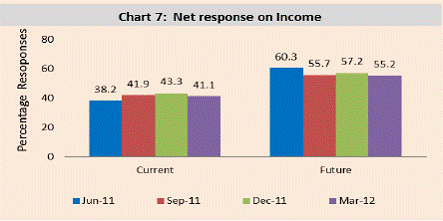
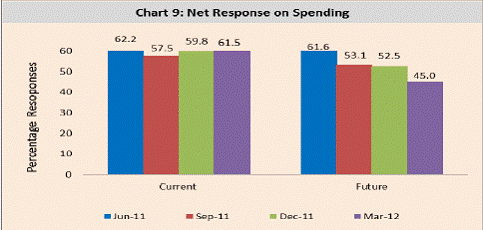
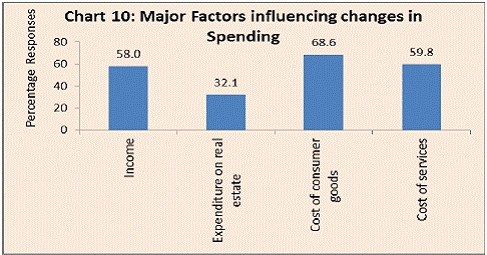
IV.4 Consumer Spending

  • Around three-fourth of the respondents reported increased spending in the current year as compared with the previous year.(Chart 8).

  • There is a noticeable drop in the share of respondents who intend to increase spending in the next year. However, there is a commensurate increase in share of respondents with intention of maintaining the same level of spending in the next year.

C8
  • Net response on the perceptions on current spending as compared with a year ago has increased marginally (Chart 9). However, net response on future spending has been declining over the quarters.

C9

C10

Note: - As respondents may report multiple factors, total of percentage relating to factors may be more than 100.
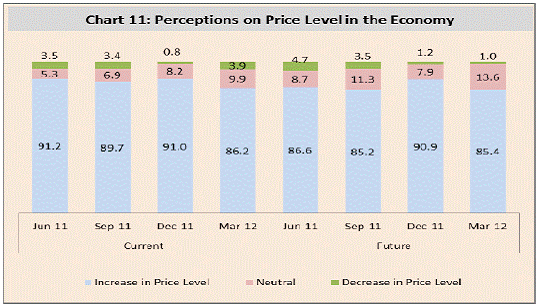
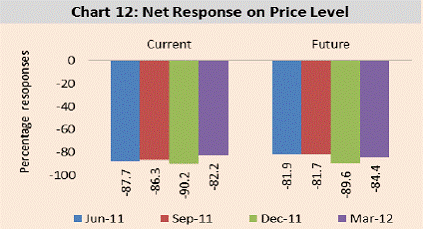
  • Among the respondents who perceived change (increase/decrease) in their spending as compared with a year ago, around 69 percent reported ‘cost of consumer goods’, as a main factor for spending changes (Chart 10). Other important factors of change in spending are ‘cost of services’, ‘income’ and ‘expenditure on real estate’.

IV.5 Price Level

  • About 85 percent of the respondents felt that prices would continue to increase during the next year.The proportion of respondents perceiving and expecting an increase in price level for current and future periods has declined in March 2012 as compared with December 2011. (Chart 11).

C11
  • As the negative perceptions on the current and future price levels have declined,the net responses on price levels have improved (Chart 12).

C12

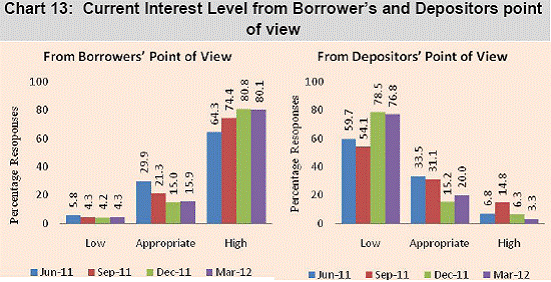
IV.6 Perceptions on other Macroeconomic Indicators

IV.6.1 Interest Rates

  • About 80 percent of the respondents reported that interest rates were high from borrower’s point of view. Now 16 percent of respondents felt the rate is appropriate (Chart 13).

  • From depositors’ point of view, about 77 percent of depositors felt the rate is low. About 20 percent of the respondents were of the view that the current interest rates are appropriate

C13

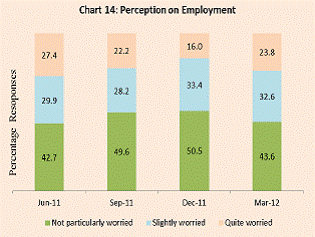
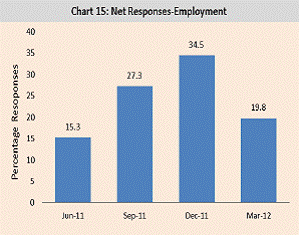
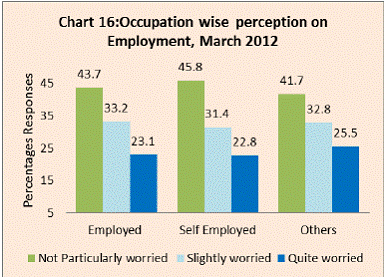
IV.6.2 Employment Conditions

  • The proportion of respondents reporting ‘not particularly worried’ on future employment prospects has declined to 43.6 percent in March 2012 as compared with about 50 percent in December 2011 (Chart 14).

C14

C15
  • However, the share of respondents worried about employment prospects increased to 23.8 percent from 16.0 percent in the previous round. As a result,net response decreased significantly in the current round (Chart 15).

  • Among the employed respondents,about 44 percent reported ‘not particularly worried’ (Chart 16).

C16

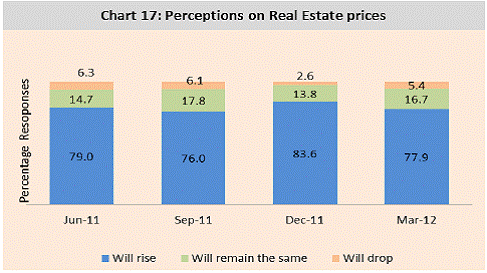
IV.6.3 Future Developments in Real Estate Prices

  • The proportion of respondents expecting a rise in future real estate prices has declined from 83.6 percent in December 2011 to 77.9 percent in March 2012 (Chart 17).

C17

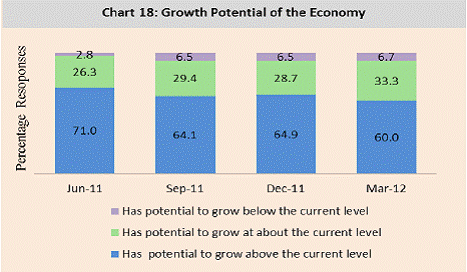
IV.6.4 Growth Potential of the Economy

  • Majority of respondents perceived that Indian economy has potential to grow above the current level in the long run (Chart 18).

C18

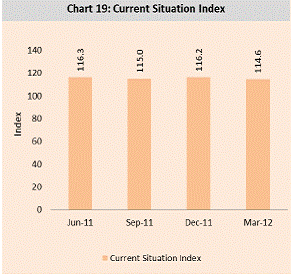
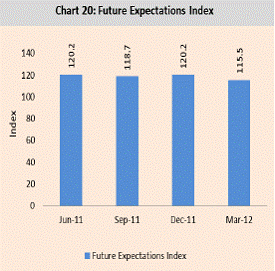
IV.7 Current Situation Index and Future Expectations Index

  • Current Situation Index (CSI), constructed based on economic conditions, household circumstances,income,spending and price level,moved in a narrow band of 114-116 during the last four quarters (Chart 19).

  • Overall Current Situation Index has dropped marginally to 114.6, mainly due to fall in the indicators pertaining to economic conditions,household circumstances and income perceptions.

C19

C20
  • The Future Expectations Index based on economic conditions,income,spending, price level and future employment prospects,has declined visibly from 120.2 in December 2011 to 115.5 in March 2012 (Chart 20).

  • Overall Future Expectations Index has dropped mainly due to fall in the indicators pertaining to economic conditions, future employment prospects,and spending.


* The survey schedule and methodology for constructing the confidence index were published in December 2011 issue of RBI Bulletin.

RbiTtsCommonUtility

PLAYING
LISTEN

Related Assets

RBI-Install-RBI-Content-Global

RbiSocialMediaUtility

بھارت موبائل ایپلی کیشن کے ریزرو بینک کو انسٹال کریں اور تازہ ترین خبروں تک فوری رسائی حاصل کریں!

Scan Your QR code to Install our app

RbiWasItHelpfulUtility

یہ صفحہ مددگار تھا؟