Industrial Outlook Survey of the Manufacturing Sector for Q2:2020-21
Today, the Reserve Bank released the results of the 91st round of the Industrial Outlook Survey (IOS) conducted during July-September 2020. The survey encapsulates qualitative assessment of the business climate by Indian manufacturing companies for Q2:2020-21 and their expectations for Q3:2020-211. In all, 959 companies responded in this round of the survey. Owing to uncertainty driven by the Covid-19 pandemic, an additional block was included in this round of the survey for assessing the manufacturers’ outlook on key parameters for two and three quarters ahead.
Highlights:
A. Assessment for Q2: 2020-21
Manufacturing companies assessed upturn in production, capacity utilisation and order books during Q2:2020-21 from the unprecedented contraction in the previous quarter.
Respondents indicated frail sentiments on employment and external demand conditions.
Overall financial situation was assessed to have improved.
Respondents maintained negative sentiments on selling prices and profit margins in Q2:2020-21, though pessimism moderated.
Overall business sentiment in the Indian manufacturing sector, as reflected by the business assessment index (BAI)2, surged from a record low at 55.3 in Q1:2020-21 to 96.2 in Q2:2020-21, though it remained in the contraction zone.
B. Expectations for Q3: 2020-21
Manufacturers expect further improvements in production, capacity utilisation and order books in Q3:2020-21.
Going forward, respondents polled some recovery in external demand situation and job landscape.
Overall financial situation and availability of finance portrayed optimism.
Outlook on profit margins for Q3:2020-21 remained negative.
The business expectations index (BEI) reverted to the expansion zone and stood at 111.4 in Q3:2020-21 from 99.5 in the previous quarter.
Table A: Summary of Net responses3 on Survey Parameters
(per cent)
Parameters
Assessment period
Expectation period
Q1:2020-21
Q2:2020-21
Q2:2020-21
Q3:2020-21
Production
-63.9
10.3
11.2
26.4
Order Books
-54.9
5.9
8.0
20.6
Pending Orders
41.2
22.8
26.0
14.2
Capacity Utilisation
-61.6
1.6
7.6
17.5
Inventory of Raw Materials
-7.8
-5.8
-5.9
-4.2
Inventory of Finished Goods
-12.6
-8.7
-7.6
-5.3
Exports
-41.7
-0.6
-3.8
7.5
Imports
-32.9
-2.8
-1.0
4.9
Employment
-28.6
-9.2
-7.7
2.4
Financial Situation (Overall)
-48.9
7.8
11.4
25.3
Availability of Finance (from internal accruals)
-30.8
3.8
6.4
15.1
Availability of Finance (from banks & other sources)
-3.0
12.0
10.6
13.6
Availability of Finance (from overseas, if applicable)
Manufacturers polled improvement in key demand indicators in Q4:2020-21 sustaining through Q1:2021-22 (Table B).
Purchase of inputs is likely to exert higher pressure.
Respondents indicated gradual hardening of output prices.
Table B: Business Expectations of Select Parameters for extended period – Net response
(per cent)
Parameters
Round 90
Round 91
Q2:2020-21
Q3:2020-21
Q4:2020-21
Q1:2021-22
Overall Business Situation
15.7
32.9
35.7
34.9
Production
11.2
26.4
33.6
32.3
Order Books
8.0
20.6
28.0
23.3
Capacity Utilisation
7.6
17.5
28.3
24.7
Employment
-7.7
2.4
12.7
12.6
Cost of Raw Materials
-32.0
-32.1
-36.1
-33.1
Selling Prices
-6.0
-0.2
10.2
14.4
Table 1: Assessment and Expectations for Production
(Percentage responses)
Quarter
Total response
Assessment
Expectations
Increase
Decrease
No change
Net response
Increase
Decrease
No change
Net response
Q2:2019-20
481
26.5
28.4
45.2
-1.9
40.1
11.0
48.9
29.1
Q3:2019-20
775
28.7
28.3
43.1
0.4
34.8
21.0
44.2
13.9
Q4:2019-20
860
33.6
19.8
46.6
13.8
35.4
18.2
46.4
17.2
Q1:2020-21
802
8.3
72.2
19.5
-63.9
37.8
14.1
48.1
23.7
Q2:2020-21
959
42.4
32.1
25.5
10.3
41.4
30.2
28.5
11.2
Q3:2020-21
43.4
16.9
39.7
26.4
‘Increase’ in production is optimistic. Note: The sum of components may not add up to total due to rounding off (This is applicable for all tables).
Table 2: Assessment and Expectations for Order Books
(Percentage responses)
Quarter
Total response
Assessment
Expectations
Increase
Decrease
No change
Net response
Increase
Decrease
No change
Net response
Q2:2019-20
481
27.4
30.2
42.5
-2.8
31.6
11.1
57.3
20.5
Q3:2019-20
775
26.9
26.6
46.5
0.3
34.3
20.4
45.3
13.9
Q4:2019-20
860
30.1
20.1
49.9
10.0
33.6
17.0
49.3
16.6
Q1:2020-21
802
8.9
63.8
27.3
-54.9
33.5
15.1
51.4
18.4
Q2:2020-21
959
37.2
31.3
31.5
5.9
36.4
28.4
35.3
8.0
Q3:2020-21
39.2
18.6
42.2
20.6
‘Increase’ in order books is optimistic.
Table 3: Assessment and Expectations for Pending Orders
(Percentage responses)
Quarter
Total response
Assessment
Expectations
Above Normal
Below Normal
Normal
Net response
Above Normal
Below Normal
Normal
Net response
Q2:2019-20
481
4.5
25.5
70.0
21.0
16.1
9.4
74.5
-6.7
Q3:2019-20
775
3.4
25.5
71.1
22.1
3.9
18.3
77.8
14.4
Q4:2019-20
860
4.1
18.5
77.4
14.4
3.7
19.5
76.8
15.9
Q1:2020-21
802
6.1
47.3
46.6
41.2
4.6
16.2
79.1
11.6
Q2:2020-21
959
7.2
30.1
62.7
22.8
5.8
31.8
62.4
26.0
Q3:2020-21
7.4
21.5
71.1
14.2
Pending orders ‘Below Normal’ is optimistic.
Table 4: Assessment and Expectations for Capacity Utilisation (Main Product)
(Percentage responses)
Quarter
Total response
Assessment
Expectations
Increase
Decrease
No change
Net response
Increase
Decrease
No change
Net response
Q2:2019-20
481
15.9
24.9
59.2
-9.0
23.1
9.2
67.7
13.9
Q3:2019-20
775
17.5
25.8
56.7
-8.3
24.4
20.0
55.6
4.4
Q4:2019-20
860
21.0
19.0
60.0
2.0
23.1
15.2
61.6
7.9
Q1:2020-21
802
6.0
67.6
26.3
-61.6
25.5
14.2
60.3
11.3
Q2:2020-21
959
31.8
30.2
37.9
1.6
36.2
28.6
35.2
7.6
Q3:2020-21
32.4
15.0
52.6
17.5
‘Increase’ in capacity utilisation is optimistic.
Table 5: Assessment and Expectations for Level of CU (compared to the average in last 4 quarters)
(Percentage responses)
Quarter
Total response
Assessment
Expectations
Above Normal
Below Normal
Normal
Net response
Above Normal
Below Normal
Normal
Net response
Q2:2019-20
481
8.1
26.6
65.3
-18.6
9.2
8.8
82.0
0.3
Q3:2019-20
775
6.6
26.9
66.5
-20.3
9.3
21.7
69.0
-12.4
Q4:2019-20
860
7.6
21.6
70.7
-14.0
7.9
18.5
73.6
-10.6
Q1:2020-21
802
2.7
63.6
33.7
-60.9
9.1
16.4
74.5
-7.3
Q2:2020-21
959
5.9
43.4
50.8
-37.5
5.8
39.2
55.0
-33.5
Q3:2020-21
8.3
25.5
66.2
-17.2
‘Above Normal’ in Level of capacity utilisation is optimistic.
Table 6: Assessment and Expectations for Assessment of Production Capacity (with regard to expected demand in next 6 months)
(Percentage responses)
Quarter
Total response
Assessment
Expectations
More than adequate
Less than adequate
Adequate
Net response
More than adequate
Less than adequate
Adequate
Net response
Q2:2019-20
481
15.1
14.2
70.7
0.9
13.5
6.9
79.6
6.6
Q3:2019-20
775
15.8
11.7
72.5
4.2
15.3
12.4
72.2
2.9
Q4:2019-20
860
14.3
9.5
76.2
4.8
14.6
11.4
74.0
3.2
Q1:2020-21
802
19.0
24.5
56.5
-5.6
13.7
8.8
77.5
4.9
Q2:2020-21
959
15.9
17.2
66.9
-1.3
18.7
17.3
64.0
1.3
Q3:2020-21
15.9
12.3
71.8
3.5
‘More than adequate’ in Assessment of Production Capacity is optimistic.
Table 7: Assessment and Expectations for Exports
(Percentage responses)
Quarter
Total response
Assessment
Expectations
Increase
Decrease
No change
Net response
Increase
Decrease
No change
Net response
Q2:2019-20
481
21.3
21.3
57.5
0.0
24.0
8.2
67.8
15.8
Q3:2019-20
775
18.3
19.2
62.5
-0.9
24.3
17.0
58.7
7.3
Q4:2019-20
860
20.1
14.3
65.5
5.8
22.4
13.8
63.9
8.6
Q1:2020-21
802
8.7
50.4
40.9
-41.7
22.5
11.5
66.0
11.0
Q2:2020-21
959
25.3
25.9
48.8
-0.6
23.1
26.9
50.0
-3.8
Q3:2020-21
25.1
17.6
57.3
7.5
‘Increase’ in exports is optimistic.
Table 8: Assessment and Expectations for Imports
(Percentage responses)
Quarter
Total response
Assessment
Expectations
Increase
Decrease
No change
Net response
Increase
Decrease
No change
Net response
Q2:2019-20
481
16.0
14.5
69.6
1.5
18.4
7.4
74.2
11.1
Q3:2019-20
775
13.2
12.3
74.5
0.9
18.1
11.7
70.2
6.4
Q4:2019-20
860
16.0
11.3
72.7
4.7
15.7
10.2
74.1
5.4
Q1:2020-21
802
7.6
40.5
51.8
-32.9
16.9
10.3
72.8
6.6
Q2:2020-21
959
18.4
21.2
60.5
-2.8
19.9
21.0
59.1
-1.0
Q3:2020-21
17.3
12.4
70.4
4.9
‘Increase’ in imports is optimistic.
Table 9: Assessment and Expectations for level of Raw Materials Inventory
(Percentage responses)
Quarter
Total response
Assessment
Expectations
Above average
Below average
Average
Net response
Above average
Below average
Average
Net response
Q2:2019-20
481
17.1
8.4
74.5
-8.6
11.8
4.2
84.0
-7.7
Q3:2019-20
775
13.9
7.7
78.4
-6.2
13.2
6.6
80.3
-6.6
Q4:2019-20
860
12.9
7.8
79.3
-5.1
10.6
7.0
82.4
-3.6
Q1:2020-21
802
21.3
13.5
65.2
-7.8
9.8
6.9
83.3
-2.9
Q2:2020-21
959
16.7
10.9
72.3
-5.8
15.5
9.7
74.8
-5.9
Q3:2020-21
11.5
7.4
81.1
-4.2
‘Below average’ Inventory of raw materials is optimistic.
Table 10: Assessment and Expectations for level of Finished Goods Inventory
(Percentage responses)
Quarter
Total response
Assessment
Expectations
Above average
Below average
Average
Net response
Above average
Below average
Average
Net response
Q2:2019-20
481
22.5
8.0
69.5
-14.5
13.0
6.0
81.0
-7.0
Q3:2019-20
775
18.3
7.3
74.4
-11.0
15.7
5.0
79.3
-10.7
Q4:2019-20
860
13.3
6.7
80.0
-6.5
12.9
6.2
80.9
-6.7
Q1:2020-21
802
27.0
14.3
58.7
-12.6
10.4
6.2
83.4
-4.3
Q2:2020-21
959
18.9
10.2
70.9
-8.7
17.2
9.5
73.3
-7.6
Q3:2020-21
12.4
7.2
80.4
-5.3
‘Below average’ Inventory of finished goods is optimistic.
Table 11: Assessment and Expectations for Employment
(Percentage responses)
Quarter
Total response
Assessment
Expectations
Increase
Decrease
No change
Net response
Increase
Decrease
No change
Net response
Q2:2019-20
481
13.4
14.2
72.4
-0.9
16.6
5.7
77.7
10.9
Q3:2019-20
775
12.2
13.8
74.0
-1.6
12.1
11.4
76.5
0.7
Q4:2019-20
860
13.4
11.3
75.3
2.0
12.5
10.7
76.8
1.8
Q1:2020-21
802
3.9
32.5
63.7
-28.6
14.3
9.0
76.7
5.2
Q2:2020-21
959
11.8
21.0
67.2
-9.2
11.0
18.7
70.3
-7.7
Q3:2020-21
14.5
12.1
73.3
2.4
‘Increase’ in employment is optimistic.
Table 12: Assessment and Expectations for Overall Financial Situation
(Percentage responses)
Quarter
Total response
Assessment
Expectations
Better
Worsen
No change
Net response
Better
Worsen
No change
Net response
Q2:2019-20
481
21.2
22.2
56.6
-1.1
34.3
6.1
59.6
28.3
Q3:2019-20
775
24.6
19.3
56.1
5.3
30.6
14.8
54.7
15.8
Q4:2019-20
860
26.5
13.6
59.9
12.8
31.2
11.7
57.1
19.5
Q1:2020-21
802
8.7
57.6
33.6
-48.9
33.1
8.8
58.0
24.3
Q2:2020-21
959
31.8
23.9
44.3
7.8
34.6
23.2
42.2
11.4
Q3:2020-21
36.7
11.4
51.9
25.3
‘Better’ overall financial situation is optimistic.
Table 13: Assessment and Expectations for Working Capital Finance Requirement
(Percentage responses)
Quarter
Total response
Assessment
Expectations
Increase
Decrease
No change
Net response
Increase
Decrease
No change
Net response
Q2:2019-20
481
28.4
10.7
60.9
17.7
27.7
5.5
66.8
22.1
Q3:2019-20
775
27.4
8.7
63.9
18.7
29.3
5.5
65.3
23.8
Q4:2019-20
860
28.3
6.4
65.4
21.9
27.3
5.7
66.9
21.6
Q1:2020-21
802
36.9
18.8
44.4
18.1
28.8
5.7
65.5
23.1
Q2:2020-21
959
33.3
11.4
55.3
21.9
37.2
11.5
51.3
25.7
Q3:2020-21
31.3
6.9
61.8
24.4
‘Increase’ in working capital finance is optimistic.
Table 14: Assessment and Expectations for Availability of Finance (from Internal Accruals)
(Percentage responses)
Quarter
Total response
Assessment
Expectations
Improve
Worsen
No change
Net response
Improve
Worsen
No change
Net response
Q2:2019-20
481
19.6
12.7
67.7
6.9
23.0
5.7
71.3
17.3
Q3:2019-20
775
19.0
12.4
68.6
6.6
21.4
8.1
70.5
13.2
Q4:2019-20
860
23.1
9.5
67.4
13.7
22.1
8.8
69.1
13.4
Q1:2020-21
802
7.2
38.0
54.8
-30.8
23.1
6.0
70.9
17.0
Q2:2020-21
959
22.2
18.4
59.5
3.8
22.5
16.1
61.3
6.4
Q3:2020-21
24.8
9.7
65.5
15.1
‘Improvement’ in availability of finance is optimistic.
Table 15: Assessment and Expectations for Availability of Finance (from banks and other sources)
(Percentage responses)
Quarter
Total response
Assessment
Expectations
Improve
Worsen
No change
Net response
Improve
Worsen
No change
Net response
Q2:2019-20
481
14.3
10.0
75.8
4.3
17.4
4.4
78.2
13.0
Q3:2019-20
775
14.6
7.4
78.1
7.2
18.7
6.0
75.3
12.7
Q4:2019-20
860
16.9
6.1
76.9
10.8
17.7
5.9
76.4
11.7
Q1:2020-21
802
12.9
15.8
71.3
-3.0
18.1
6.4
75.4
11.7
Q2:2020-21
959
20.3
8.3
71.4
12.0
20.4
9.8
69.8
10.6
Q3:2020-21
19.4
5.8
74.8
13.6
‘Improvement’ in availability of finance is optimistic.
Table 16: Assessment and Expectations for Availability of Finance (from overseas, if applicable)
(Percentage responses)
Quarter
Total response
Assessment
Expectations
Improve
Worsen
No change
Net response
Improve
Worsen
No change
Net response
Q2:2019-20
481
6.9
4.1
89.1
2.8
13.1
3.5
83.5
9.6
Q3:2019-20
775
7.5
5.0
87.6
2.5
9.2
4.1
86.7
5.1
Q4:2019-20
860
7.2
4.4
88.4
2.8
7.3
4.3
88.4
3.0
Q1:2020-21
802
3.2
13.5
83.3
-10.3
7.9
4.0
88.1
4.0
Q2:2020-21
959
6.8
7.4
85.7
-0.6
7.9
9.9
82.2
-2.0
Q3:2020-21
7.2
6.6
86.1
0.6
‘Improvement’ in availability of finance is optimistic.
Table 17: Assessment and Expectations for Cost of Finance
(Percentage responses)
Quarter
Total response
Assessment
Expectations
Increase
Decrease
No change
Net response
Increase
Decrease
No change
Net response
Q2:2019-20
481
21.3
8.1
70.6
-13.1
22.5
7.1
70.4
-15.4
Q3:2019-20
775
16.9
8.2
74.9
-8.7
18.5
8.4
73.1
-10.0
Q4:2019-20
860
15.0
8.4
76.6
-6.6
15.0
7.1
77.9
-7.9
Q1:2020-21
802
16.3
15.9
67.8
-0.4
12.7
6.6
80.6
-6.1
Q2:2020-21
959
17.5
14.7
67.7
-2.8
17.6
10.9
71.5
-6.7
Q3:2020-21
15.5
8.8
75.7
-6.7
‘Decrease’ in cost of finance is optimistic.
Table 18: Assessment and Expectations for Cost of Raw Materials
(Percentage responses)
Quarter
Total response
Assessment
Expectations
Increase
Decrease
No change
Net response
Increase
Decrease
No change
Net response
Q2:2019-20
481
42.4
7.1
50.5
-35.3
31.4
3.8
64.8
-27.6
Q3:2019-20
775
37.2
11.1
51.7
-26.1
37.0
6.2
56.8
-30.8
Q4:2019-20
860
41.1
7.1
51.8
-34.1
35.6
5.6
58.8
-30.0
Q1:2020-21
802
39.9
10.7
49.4
-29.3
38.9
5.3
55.7
-33.6
Q2:2020-21
959
46.1
8.2
45.7
-38.0
37.8
5.7
56.5
-32.0
Q3:2020-21
36.7
4.6
58.7
-32.1
‘Decrease’ in cost of raw materials is optimistic.
Table 19: Assessment and Expectations for Salary/Other Remuneration
(Percentage responses)
Quarter
Total response
Assessment
Expectations
Increase
Decrease
No change
Net response
Increase
Decrease
No change
Net response
Q2:2019-20
481
38.6
2.6
58.8
-36.0
34.5
0.9
64.6
-33.7
Q3:2019-20
775
30.6
3.6
65.8
-27.0
25.0
1.8
73.2
-23.2
Q4:2019-20
860
27.1
2.3
70.6
-24.8
25.1
3.0
71.9
-22.1
Q1:2020-21
802
12.4
22.0
65.5
9.6
35.8
2.7
61.5
-33.1
Q2:2020-21
959
15.7
12.9
71.4
-2.8
16.5
12.5
70.9
-4.0
Q3:2020-21
15.8
6.8
77.4
-9.0
‘Decrease’ in Salary / other remuneration is optimistic.
Table 20: Assessment and Expectations for Selling Price
(Percentage responses)
Quarter
Total response
Assessment
Expectations
Increase
Decrease
No change
Net response
Increase
Decrease
No change
Net response
Q2:2019-20
481
13.8
21.4
64.8
-7.6
15.5
8.4
76.1
7.1
Q3:2019-20
775
12.0
21.6
66.4
-9.6
18.6
14.0
67.3
4.6
Q4:2019-20
860
16.4
13.9
69.7
2.5
15.2
13.0
71.9
2.2
Q1:2020-21
802
9.5
26.6
64.0
-17.1
18.0
9.7
72.3
8.3
Q2:2020-21
959
13.9
19.7
66.4
-5.8
12.9
18.9
68.1
-6.0
Q3:2020-21
12.8
13.0
74.3
-0.2
‘Increase’ in selling price is optimistic.
Table 21: Assessment and Expectations for Profit Margin
(Percentage responses)
Quarter
Total response
Assessment
Expectations
Increase
Decrease
No change
Net response
Increase
Decrease
No change
Net response
Q2:2019-20
481
13.5
36.1
50.4
-22.6
21.9
14.5
63.6
7.4
Q3:2019-20
775
12.3
34.4
53.3
-22.1
17.6
26.1
56.3
-8.5
Q4:2019-20
860
15.8
27.4
56.8
-11.6
16.3
26.4
57.3
-10.2
Q1:2020-21
802
5.0
61.8
33.2
-56.8
17.5
20.4
62.1
-2.9
Q2:2020-21
959
15.3
41.8
43.0
-26.5
13.7
40.5
45.8
-26.8
Q3:2020-21
14.7
26.7
58.6
-12.0
‘Increase’ in profit margin is optimistic.
Table 22: Assessment and Expectations for Overall Business Situation
(Percentage responses)
Quarter
Total response
Assessment
Expectations
Better
Worsen
No change
Net response
Better
Worsen
No change
Net response
Q2:2019-20
481
24.5
25.4
50.1
-0.8
41.1
6.0
52.9
35.2
Q3:2019-20
775
26.4
22.9
50.8
3.5
37.3
15.6
47.1
21.7
Q4:2019-20
860
31.6
15.8
52.6
15.7
35.8
13.2
50.9
22.6
Q1:2020-21
802
8.3
68.5
23.2
-60.2
38.6
10.4
50.9
28.2
Q2:2020-21
959
39.6
27.9
32.5
11.8
41.0
25.3
33.6
15.7
Q3:2020-21
45.7
12.8
41.6
32.9
‘Better’ Overall Business Situation is optimistic.
Table 23: Business Sentiments
Quarter
Business Assessment Index (BAI)
Business Expectations Index (BEI)
Q2:2019-20
92.5
112.8
Q3:2019-20
93.0
102.2
Q4:2019-20
102.2
105.0
Q1:2020-21
55.3
108.8
Q2:2020-21
96.2
99.5
Q3:2020-21
111.4
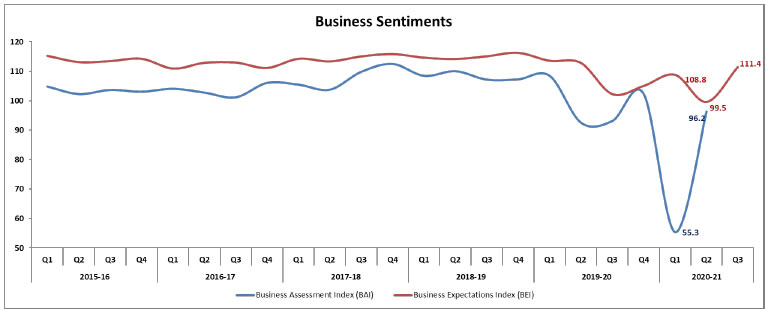
1 The survey results reflect the views of the respondents, which are not necessarily shared by the Reserve Bank of India. This round of the survey was launched on August 7, 2020 and results were compiled with data received till September 23, 2020. The results of the 90th round of the survey (Q1:2020-21) were released on August 6, 2020 on the RBI’s website.
2 For each survey round, two indices are computed – one based on assessment [viz., Business Assessment Index (BAI)] and another based on expectations [viz., Business Expectations Index (BEI)]. Each index is a composite indicator calculated as a simple average of nine business parameters, where each parameter is derived as a weighted net response of companies, weights being the share of industry groups in gross value added (GVA). The nine parameters considered are: (1) overall business situation; (2) production; (3) order books; (4) inventory of raw material; (5) inventory of finished goods; (6) profit margins; (7) employment; (8) exports; and (9) capacity utilisation. BAI/BEI gives a snapshot of the business outlook in every quarter and takes values between 0 and 200, with 100 being the threshold separating expansion from contraction.
3 Net Response (NR) is the difference between the percentage of respondents reporting optimism and those reporting pessimism. It ranges between -100 to 100. Any value greater than zero indicates expansion/optimism and any value less than zero indicates contraction/pessimism. In other words, NR = (I – D), where, I is the percentage response of ‘Increase/optimism’, and D is the percentage response of ‘Decrease/pessimism’ and E is the percentage response as ‘no change/equal’ (i.e., I+D+E=100). For example, increase in production is optimism whereas decrease in cost of raw material is optimism.
RbiTtsCommonUtility
PLAYING
LISTEN
LOADING...
0:062:49
Related Assets
RBI-Install-RBI-Content-Global
RbiSocialMediaUtility
Share this page:
Install the RBI mobile application and get quick access to the latest news!
RbiWasItHelpfulUtility
Was this page helpful?Thanks!
Would like to give more details?
Thank you for your feedback!Thank you for your feedback!