 IST,
IST,
IV. Monetary and Liquidity Conditions
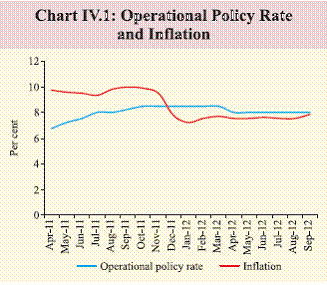
Liquidity conditions have eased during 2012-13, as a result of calibrated and pre-emptive measures, which include OMO purchases and reduction in both the SLR and the CRR. The Reserve Bank also front loaded a reduction in its repo rate by 50 basis points in April 2012. However, with inflation remaining high, it has kept the policy rate unchanged since then. While the reserve money growth decelerated and broad money growth remained steady in Q2 of 2012-13, the aggregate deposit and non-food credit growth have been below the indicative trajectory. Going forward, the secondary impact of the CRR cut, appropriate liquidity conditions and seasonal pick-up in credit demand are expected to influence the monetary aggregates, while the trajectory of the monetary cycle will be shaped by evolving growth-inflation dynamics. Reserve Bank injects liquidity to support credit flow, while calibrating monetary policy on growth-inflation dynamics IV.1 The Reserve Bank has calibrated monetary policy in line with evolving growth-inflation dynamics. Without fundamentally changing its policy stance that has primarily sought to contain inflation and inflation expectations over the past two years, it has been ensuring that liquidity conditions do not tighten excessively. As a result of the infusion of liquidity through CRR cuts of 125 bps in Q4 of 2011-12 and again by 25 bps in September 2012 (Table IV.1), coupled with over `800 billion of liquidity infusion through outright open market purchases during 2012-13 so far, liquidity conditions have remained easier in 2012-13 as compared with 2011-12. Besides, the Reserve Bank lowered the Statutory Liquidity Ratio (SLR) by 100 bps with effect from August 11, 2012 – a measure that was expected to support private credit. It also front-loaded a 50 bps policy rate cut in April, in anticipation of measures supportive of fiscal consolidation that have been partly taken in September 2012 (Chart IV.1). IV.2 Active liquidity management through CRR, OMO and SLR has kept liquidity largely in line with the policy objective that factored in the persistence of inflation at a substantially higher than the Reserve Bank’s comfort level as well as the need to ensure that supply of credit is not a constraining factor for productive needs.
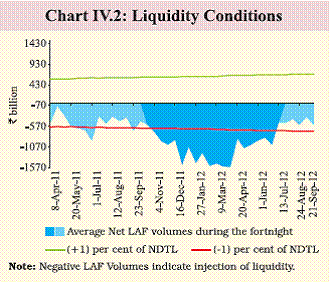
Conditions transit back to a phase of comfortable liquidity IV.3 Since 2011-12, the liquidity conditions can be broadly divided into three distinct phases. After remaining within the Reserve Bank’s comfort zone during the first phase from April 2011 to October 2011, the liquidity deficit crossed the one per cent of NDTL level (Chart IV.2). This large liquidity deficit was mainly caused by forex intervention and increased divergence between credit and deposit growth. The deficit conditions were further aggravated by frictional factors like the build-up of government cash balances with the Reserve Bank that persisted longer than anticipated and the increase in currency in circulation.
IV.4 The Reserve Bank had to actively manage liquidity to provide greater liquidity cushion to the financial system, while at the same time guarding against the risk of resurgence of inflationary pressure. Consequently, liquidity conditions eased significantly in Q1 of 2012-13 and the extent of the deficit mostly returned to the Reserve Bank’s comfort level from July 2012, marking the onset of the third phase. Three major factors that contributed to this turnaround in Q2 of 2012-13 were the injection of liquidity by way of open market operations (OMOs), decline in currency in circulation and a decline in government cash balances with the Reserve Bank. The increased use of the export credit refinance facility by banks after the increase in its limit announced in the Mid- Quarter review of June 2012 and the one per cent reduction in the SLR announced on July 31, 2012 also helped in improving liquidity conditions.
IV.5 Liquidity conditions improved significantly in July 2012 compared with June 2012, with average daily net liquidity injection under LAF declining to around `480 billion, which further declined marginally in August 2012. The first half of September saw a significant decline in liquidity injection, mainly on account of a decline in the government’s cash balances. Anticipating possible pressure on liquidity in the subsequent period on account of advance tax payment, seasonal pickup in the credit demand and transitional pressure arising from the currency demand during the festive season, the Reserve Bank, in September 2012 reduced the CRR by 25 basis points, which resulted in around `170 billion of primary liquidity injection into the banking system. With advance tax outflows from the banking system, the average daily net liquidity injection increased to more than `700 billion in the second half of September 2012, which was less than the quarterly spikes generally associated with advance tax collections. There was no auction purchase under outright open market operation (OMO) in Q2 of 2012-13, although there were purchases of government securities through the NDS-OM trading platform. IV.6 The liquidity deficit eased in the first week of October 2012, but it has increased once again from the second week of the month. With less than usual front loading by the banks, the spike was mainly on account of banks’ demand for reserve requirements coupled with the rise in government’s surplus with the Reserve Bank. The average daily net liquidity injection under the LAF was around `580 billion during October 1-24, 2012.
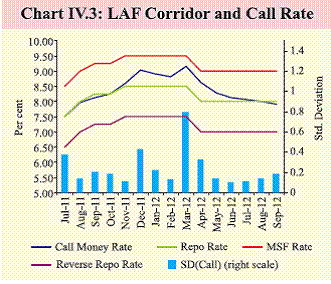
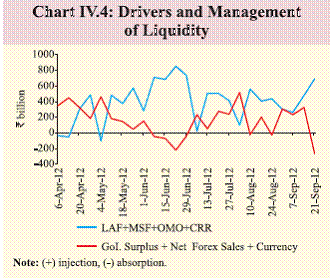
IV.7 Overall, the liquidity stress in the banking system declined in Q2 of 2012-13. This was evident from the lower recourse to the marginal standing facility (MSF) by banks during this period. Despite the advance tax outflows and the increase in borrowing limit under MSF from April 2012, the SCBs did not avail of MSF in September 2012. Moreover, the monthly average call rate, which hovered between the repo rate and the MSF rate during November 2011-July 2012, declined subsequently and has mostly hovered below the repo rate since August 2012. Further, there was a sharp decline in volatility in the call rate in this financial year so far, as measured by the standard deviation of the rate movements in a month (Chart IV.3). IV.8 In general, the calibrated liquidity management of the Reserve Bank (Chart IV.4) has addressed three crucial contemporaneous challenges, which include facilitating credit flows, ensuring smooth policy transmission and smoothing operational rate. Appropriate liquidity management provided a liquidity cushion to facilitate credit flows to the productive sectors of the economy. It, on the other hand, ensured that the drawls under the Liquidity Adjustment Facility (LAF) broadly remained within the indicative target of (+/–) 1 per cent of NDTL, thereby facilitating monetary policy transmission; and finally, the decline in volatility in the money market rate captured the central banks’ tendency to smooth operational interest rate in line with an optimal monetary policy framework.
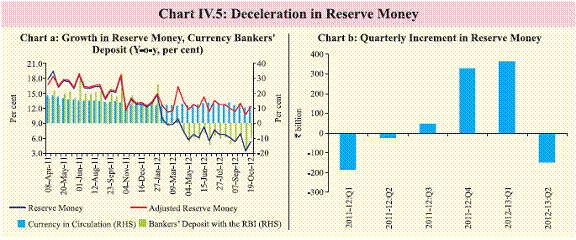
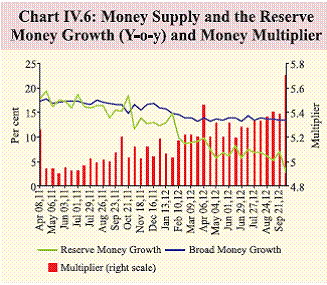
Reserve money decelerated in Q2 of 2012-13 IV.9 There was marked deceleration in reserve money during Q2 of 2012-13. On the component side, while the currency in circulation growth (y-o-y) decelerated, the growth in banker’s deposit (y-o-y) with the Reserve Bank declined and remained negative in the financial year so far. This decline in bankers’ deposits mainly reflects the reduction in impounded liquidity and, thus, the easing of liquidity conditions as envisaged by the 150 basis point CRR reductions since January 2012. The CRR adjusted reserve money (y-o-y) growth remained relatively stable and hovered around 12.5 in the financial year so far, although it remained below the 16.5 per cent level recorded during the comparable period in 2011-12 (Chart IV.5 and Table IV.2). Broad money grew steadily in Q2 of 2012- 13 but remained below the indicative trajectory IV.10 During this financial year so far, the money supply (y-o-y) growth hovered around 13.6 per cent. While the deceleration in reserve money contributed to the lower broad money growth, the countervailing increase in the money multiplier, especially in Q2 of 2012-13, has contributed to steadying the monetary expansion. In Q2 of 2012-13, the increase in money multiplier has been driven by reductions in the currency-deposit ratio and the aggregate deposit to bankers’ deposit ratio. With a CRR cut effective from the fortnight beginning September 22, 2012, there was a further reduction in the banker’s deposit to aggregate deposit ratio, which lead to an increase in the money multiplier (Chart IV.6).
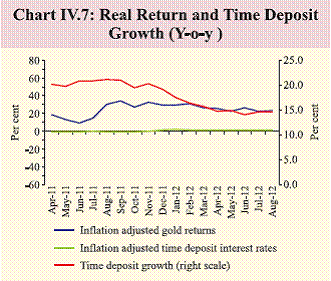
Aggregate deposit and credit growth decelerated IV.11 On the component side, the year-on-year aggregate deposit growth has decelerated. It mainly reflected the underlying trend in time deposits, which constitute around 90 per cent of the aggregate deposit. The moderation in the net financial saving rate of the household sector during 2011-12 partially reflected the slower growth in households’ holding of bank deposits. Moreover, low real interest rates in time deposits and relatively high rate of returns in alternate assets (e.g., gold) might explain some part of the deceleration in time deposits (Chart IV.7). The sharp decline in aggregate deposits at end-Q2 could be due to the decline in deposit rates announced by various banks from September 7, 2012 as well as the advance tax outflow from the banking system. Following the seasonal pattern, the currency with the public also declined in Q2 of 2012-13.
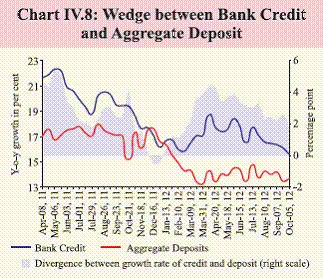
IV.12 Non-food credit growth, which had generally increased during Q1 of 2012-13, has decelerated in Q2. This has been mainly due to the slack investment demand and slowdown in the credit-intensive manufacturing sector. The increased risk perception of banks could also have played a role in the low bank credit disbursement. Despite the positive wedge between the y-o-y growth in credit and aggregate deposit, the wedge between the two narrowed in Q2 compared to Q1 of 2012-13. The decline in the divergence between these growth rates helped contain one of the structural factors causing deficit liquidity in the banking system during Q2 of 2012-13 (Chart IV.8).
IV.13 There was a deceleration in credit growth (y-o-y) for all SCBs at end-September 2012. At the bank-group level, the deceleration was particularly sharp for the public sector banks (PSBs). As PSBs are the largest lenders in terms of outstanding credit, deceleration in their credit growth pulls down the overall credit expansion of all SCBs taken together. The credit growth of the foreign banks registered an even sharper deceleration. Private sector banks, which registered strong credit growth in the comparable period last year, continued to witness a robust credit growth (Table IV.3). IV.14 The deceleration in the credit growth reflected the slack investment demand, slowing economic activity and more importantly, deteriorating credit quality, especially in the case of PSBs. The ratio of gross non-performing assets (NPAs) to gross advances and the net NPA to net advances that had increased significantly during 2011-12, rose further in Q1 of 2012-13 across the bank groups (Table IV.4). The increases in these ratios were maximum for the PSBs, which account for the major part of the bank advances. The slippage ratio that indicates the fresh NPAs increased across the sectors signalling additional stress in the banking sector. Restructuring of standard assets also increased significantly for PSBs during Q1 of 2012-13. Deterioration in the assets quality and in the macroeconomic conditions resulted in added risk aversion in the banking sector. This led to a portfolio switch from credit creation to investments in G-secs on the back of large government market borrowing. The SCBs were holding around 28 per cent of their NDTL in SLR investments at end-September 2012.
IV.15 An analysis of sectoral deployment of credit based on data from select banks (which cover 95 per cent of total non-food credit extended by all SCBs) for September 2012 reveals that the non-food bank credit growth (y-o-y) to industries, services and personal loans decelerated compared with the previous year. The year-on-year bank credit growth to industry at 15.6 per cent in September 2012 decelerated considerably, from 22.9 per cent in September 2011. Deceleration in credit growth to industry was observed in all the major sub-sectors, barring chemical and chemical products, cement and cement products, and paper and paper products. Non-bank domestic sources dominated flow of resources to the commercial sector IV.16 The total flow of financial resources to the commercial sector during 2012-13 (up to October 5, 2012) has marginally declined when compared to the corresponding period in the previous year. Though the decline in flow has been accounted for by both bank and non-bank sources, the flow from non-banks has remained an important source of financing to the commercial sector (Table IV.5). Among the non-bank sources, funds from domestic sources have witnessed an increase this financial year so far, mainly due to the higher issuance of commercial papers and increase in net credit by housing finance companies (HFCs). Foreign sources of funding (up to September 2012), however, declined compared with the previous year, mainly on account of a decline in external commercial borrowings/ FCCBs and decline in foreign direct investment in India.
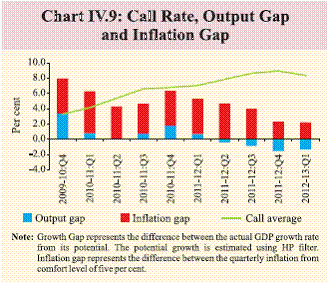
Monetary and liquidity conditions evolving with growth-inflation dynamics IV.17 The movement of operational target (weighted average call rate) that tracks the policy rate has evolved in line with output and inflation gaps (Chart IV.9). Though the monetary policy was tightened due to large inflation gap, the economic slowdown could be attributed to several other factors apart from monetary tightening (see Chapter I). Despite appropriate liquidity conditions prevailing over most of Q2 2012-13, the deceleration in non-food credit growth partly suggests exogenous or nonmonetary factors like slack global demand and increased risk aversion.
|
||||||||||||||||||||||||||||||||||||||||||||||||||||||||||||||||||||||||||||||||||||||||||||||||||||||||||||||||||||||||||||||||||||||||||||||||||||||||||||||||||||||||||||||||||||||||||||||||||||||||||||||||||||||||||||||||||||||||||||||||||||||||||||||||||||||||||||||||||||||||||||||||||||||||||||||||||||||||||||||||||||||||||||||
صفحے پر آخری اپ ڈیٹ:


