 IST,
IST,
IV. Monetary and Liquidity Conditions
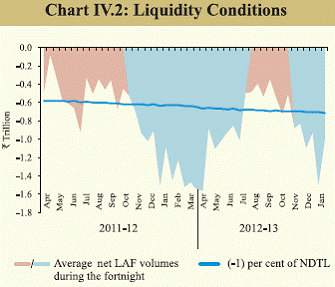
Monetary policy in this financial year so far has sought to balance the growth–inflation dynamics through a combination of measured steps for liquidity easing and policy rate cut. While reserve money growth adjusted for CRR has maintained reasonable pace during Q3, broad money growth remained below the indicative trajectory. Aggregate deposit growth lagged behind credit growth, even as credit expansion remains moderate due to slack in activity and deterioration in the asset quality of banks. Despite considerable primary liquidity infusion by the Reserve Bank through CRR cuts and open market purchases of government securities, liquidity conditions tightened in Q3 of 2012-13. This was mainly because of an increase in government cash balances with the Reserve Bank. Going forward, contingent on further moderation in inflation, monetary policy could increasingly shift focus and respond to growth, giving due cognizance to the evolving macro-financial factors. Tightening cycle gradually impacted inflation IV.1 During the current financial year, growth has slowed markedly, even as inflation remained above the Reserve Bank’s comfort level. Monetary Policy has responded to this evolving growth-inflation dynamics through calibrated easing. After lowering the cash reserve ratio (CRR) by 125 basis points (bps) during Q4 of 2011-12, the Reserve Bank frontloaded a reduction in its repo rate by 50 bps in April 2012. Even as elevated inflation and the twin deficits have severely restricted the space for further easing of the policy rate since April 2012, subsequent measures were directed towards ensuring adequate liquidity to facilitate a turnaround in credit deployment to productive sectors for supporting growth. As part of liquidity management measures, the CRR was reduced in two stages by a further 50 bps in a pre-emptive manner to ease monetary and liquidity conditions. Also, the statutory liquidity ratio (SLR) of scheduled commercial banks (SCBs) was reduced to improve the credit conditions facing the private sector (Table IV.1).
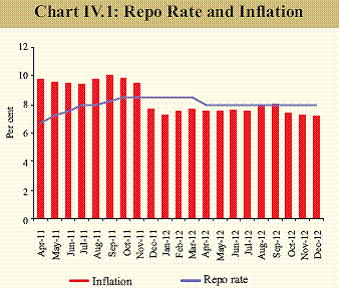
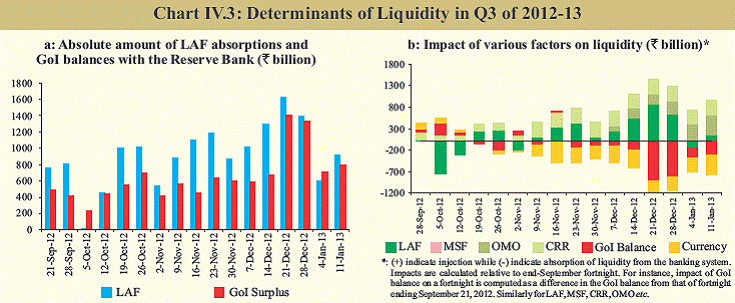
IV.2 Furthermore, apart from supplying liquidity through daily liquidity adjustment facility (LAF), the Reserve Bank made active use of the auctions under outright open market operations (OMOs) and injected primary liquidity of about `1.1 trillion coupled with liquidity injection of around `229 billion through anonymous trading platform (NDSOM) in 2012-13 so far. The judicious use of the two sets of instruments, i.e., keeping the policy rate unchanged since April and proactive liquidity easing measures conferred dual benefits that were evident as inflation gradually declined from its peak and credit off-take showed signs of improvements during most of November and December 2012. Inflation, however, continues to remain above the Reserve Bank’s comfort level (Chart IV.1). Reserve Bank takes measures to combat tight liquidity conditions IV.3 Liquidity conditions since April 2012 can be broadly classified into three phases. The financial year started with the spillover of the tight liquidity condition from the previous year, which was beyond the Reserve Bank’s comfort zone. The deficit was managed through a combination of primary liquidity injection through OMOs and LAF as well as an enhancement of the export credit refinance limit. The second phase commenced in July 2012 when, consequent upon these policy measures, the liquidity deficit declined and returned to the Reserve Bank’s comfort level and remained mostly there until the beginning of November 2012. To pre-empt any prospective tightening of liquidity conditions arising out of frictional factors such as advance tax outflows, festive season currency demand and increase in the wedge between the growth rates of credit and deposit, the Reserve Bank reduced the CRR by 25 bps in September 2012 in addition to the 100 bps SLR cut effective from August 2012 (Table IV.1). Since November 2012, the inter-bank market has witnessed a tightening of liquidity conditions mainly due to the buildup of government cash balances and rise in currency in circulation with the liquidity deficit crossing the Reserve Bank’s comfort level of (-1) per cent of net demand and time liabilities (NDTL) (Chart IV.2). IV.4 To address the tightness, the Reserve Bank, after considering the prevailing macroeconomic situation, again reduced the CRR of scheduled banks by 25 basis points to 4.25 per cent of their NDTL effective November 3, 2012. Consequently, about `175 billion of primary liquidity was injected into the banking system. Liquidity deficit worsened due to an unprecedented increase in currency demand during the first half of November 2012. The quarterly advance tax outflows in December 2012 further increased the liquidity deficit (Chart IV.3). IV.5 Given the significant squeeze on liquidity creation and large build-up of government cash balances, the Reserve Bank resumed open market purchase auctions of government securities on December 4, 2012 after a gap of nearly five months. The Reserve Bank injected primary liquidity through open market purchases to the tune of `391 billion during the month in addition to the liquidity injection through its LAF operations averaging about `1.2 trillion during the month. IV.6 In January 2013, with an increase in government spending, the recourse to LAF declined compared with the previous month. However, it continues to mostly remain higher than the Reserve Bank’s comfort level. The Reserve Bank remains committed to actively manage the liquidity conditions. Despite the large liquidity shortage since November 2012, there has been only one instance of recourse to Marginal Standing Facility (MSF) during November-December 2012. The call rate generally hovered around the repo rate, without significant spike, indicating the depth and resilience of the inter-bank market. This reflects the favourable effect of the new monetary policy operating procedure. Reserve money adjusted for CRR expanded at reasonable pace in Q3 of 2012-13 IV.7 Reserve money growth generally decelerated during Q3 of 2012-13, despite large injection of primary liquidity by the Reserve Bank through OMO and LAF (Chart IV.4). On the sources side, high government cash balances since end-September dampened the increase in the net Reserve Bank credit to the centre (Chart IV.3). On the components side, the decline in bankers’ deposits with the Reserve Bank due to CRR cuts eroded the effect of the increasing trend in the currency in circulation that was observed during the quarter. The quantum of reserve money, adjusted for the first-round impact of the CRR cuts, however, increased during the quarter compared to a decline in previous quarter. The release of impounded liquidity through CRR cuts was expected to stimulate credit creation and positively impact the broad money growth through the multiplier mechanism.
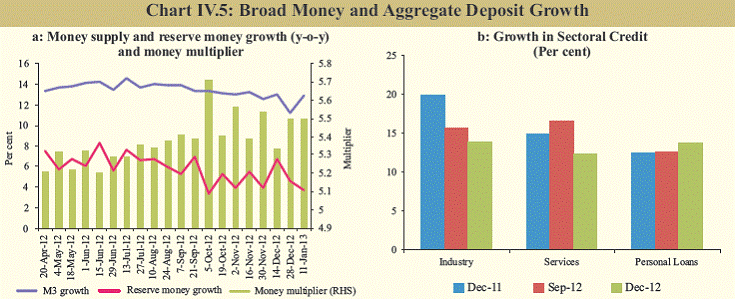
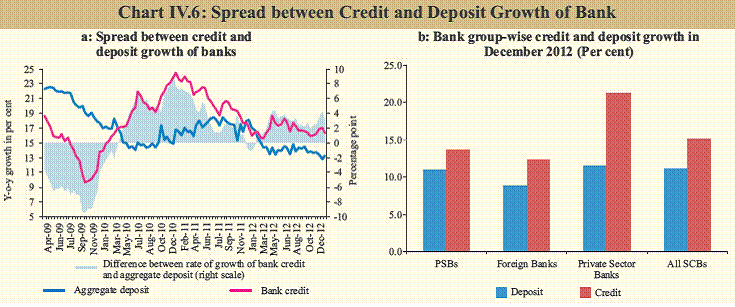
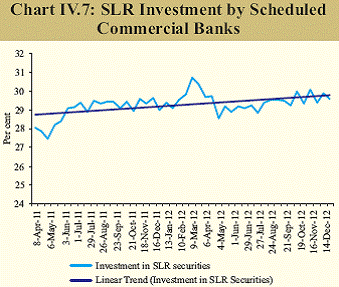
Broad money growth remains below indicative trajectory IV.8 Broad money growth decelerated in Q3 and fell below the indicative trajectory of the Reserve Bank, mainly due to deceleration in the growth of aggregate deposits (Table IV.2). On the sources side, both the global and domestic macroeconomic situation had some dampening impact on credit growth, which also muted the multiplier expansion that was expected to boost broad money growth (Chart IV.5). IV.9 Data on sectoral deployment of credit from select 47 banks accounting for about 95 per cent of the total non-food credit deployed by all the SCBs generally indicated a decrease in y-o-y growth in industrial credit as well as credit to the services sector in December 2012 compared with corresponding period previous year, and also compared with September 2012 (Chart IV.5b). Increased wedge between credit and deposit growth remains a concern IV.10 In 2012-13, the lack of commensurate growth in aggregate deposit to fund the credit growth has given rise to an asset-liability gap, which is also indicated by the increase in the credit-deposit ratio (Chart IV.6). The deceleration in the term deposits, which constitutes the major component of aggregate deposit, could be largely attributed to the low and declining real interest rates on time deposits. Moreover, with an increase in the wedge between credit and deposit growth, banks are likely to tap the inter-bank market to fund this gap. With already tight liquidity conditions, the widening wedge poses a concern as it is likely to worsen the tight liquidity condition. Risk aversion impacting credit as asset quality concerns accentuate IV.11 Besides sluggish demand, a major factor that could have led to the low credit growth of the PSBs over the past quarters is the deterioration in their asset quality (Table IV.3). Asset quality indicators of the banking sector, which had deteriorated significantly during 2011-12, have further deteriorated in the financial year so far (Table IV.4). The worsening asset quality during Q2 of 2012-13 continued to be led by public sector banks, which account for the major portion of bank advances. Deterioration in asset quality and in macroeconomic conditions resulted in increased risk aversion in the banking sector. This, in turn, led to a portfolio switch from credit creation to investment in SLR securities on the back of large government market borrowings (Chart IV.7).
Lagged monetary policy transmission to lending rate also indicates structural rigidities in the credit market IV.12 Taking a cue from the reduction in the policy rate (repo rate) by 50 bps in April 2012 and the subsequent reduction in the SLR by 100 bps in August 2012 and the CRR by 175 bps during January-November 2012, several banks have reduced their deposit and base rates during 2012-13 (up to January 15, 2013). Accordingly, the modal deposit rate and modal base rate of banks declined during the financial year so far. Though the impact of these policy measures is still unfolding, available data suggest that the transmission of the policy rate to deposit and lending rates of banks is relatively less pronounced than money market rates, reflecting the presence of structural rigidities in the credit market. Non-bank domestic sources augmented flow of resources to the commercial sector IV.13 The total flow of financial resources to the commercial sector for the financial year so far (up to January 11, 2013) was higher compared with the corresponding period of the previous year (Table IV.5). The increase in flow has been accounted for by both bank and non-bank sources, though the latter played a dominant role. Among the domestic sources, non-food credit and non-SLR investment by SCBs, net issuance of commercial paper, net credit by housing finance companies, systemically important non-deposit taking NBFCs, witnessed large increase compared to corresponding period previous year. Foreign sources of funding (up to December 2012), also recorded marginal increase compared with the previous year, mainly on account of a higher external commercial borrowings/ foreign currency convertible bonds and shortterm credit from abroad. However, FDI, which is considered to be the most stable source of capital inflows, witnessed a decline during the period.
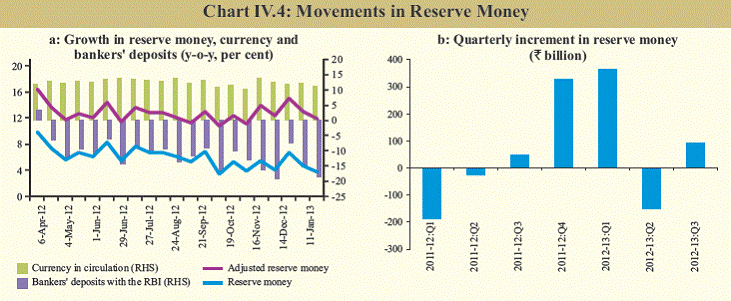
Monetary conditions may evolve with shifting growth-inflation dynamics IV.14 Since January 2012, monetary policy has sought to balance the growth–inflation dynamics through a combination of liquidity easing measures and policy rate cut. It has reduced the CRR and the SLR and infused primary liquidity through open market purchases. After front-loading a 50 bps repo rate cut in April 2012, the Reserve Bank has maintained a pause on policy rate so far because of inflation remaining above its comfort level and the lack of requisite adjustments to fiscal and current account imbalances. Going forward, if inflation continues to trend down, monetary policy could increasingly shift focus and respond to growth moderation. However, the exact policy path would be contingent upon the evolving dynamics of inflation and growth, the trajectory of monetary and credit aggregates and other macroeconomic and financial parameters. |
||||||||||||||||||||||||||||||||||||||||||||||||||||||||||||||||||||||||||||||||||||||||||||||||||||||||||||||||||||||||||||||||||||||||||||||||||||||||||||||||||||||||||||||||||||||||||||||||||||||||||||||||||||||||||||||||||||||||||||||||||||||||||||||||||||||||||||||||||||||||||||||||||||||||||||||||||||||||||||||||||||||||||||||||||||||||||||||||||||||||||||||||||||||||||||||||||||||||||||||||||||||||||||||||||||||||||||||||||||||||||||||||||||||||||||||||||||||||||||||||||||||||||||||||||||||||||||||||||||||||||
صفحے پر آخری اپ ڈیٹ:


