 IST,
IST,
Macroeconomic and Monetary Developments 2014-15 (An Update)
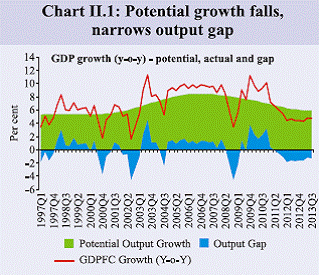
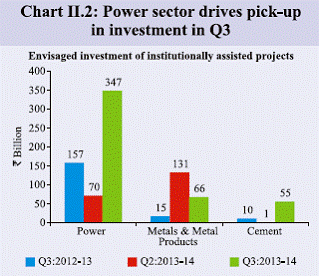
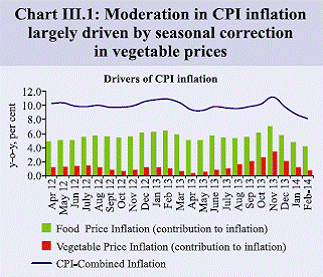
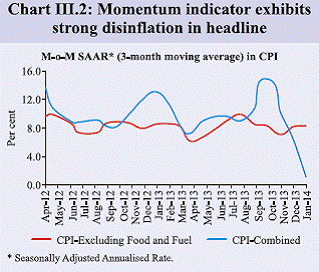
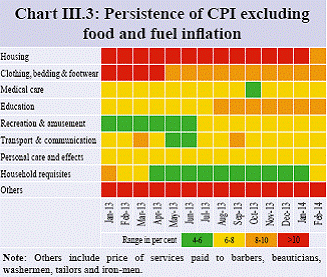
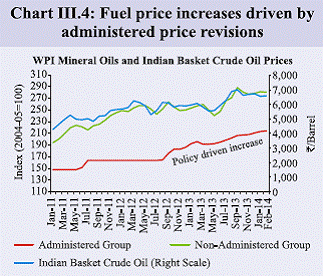
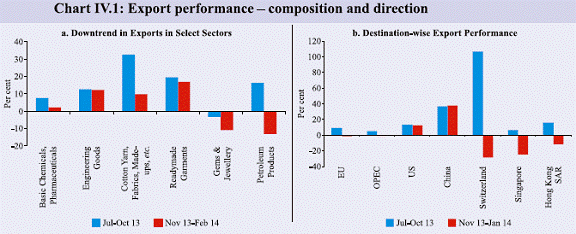
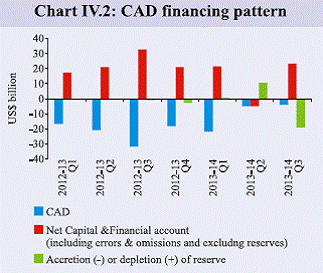
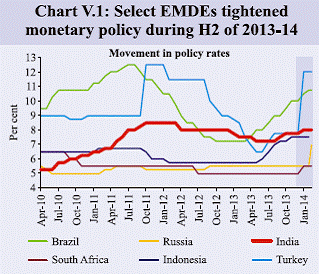
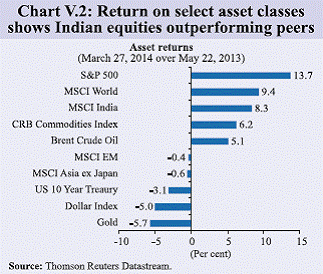
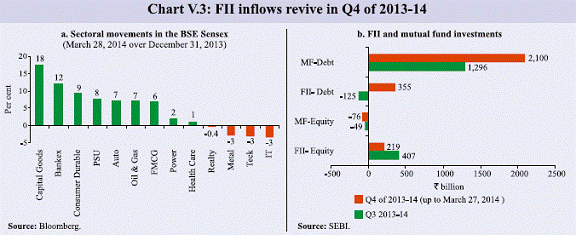
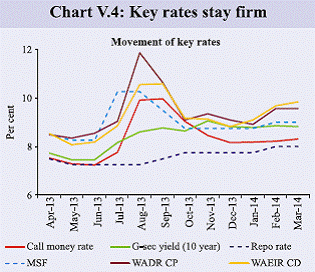
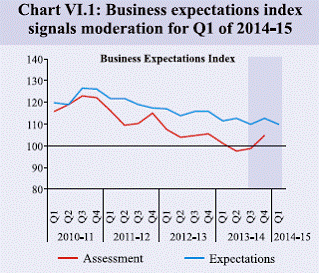
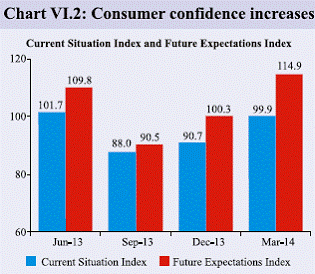
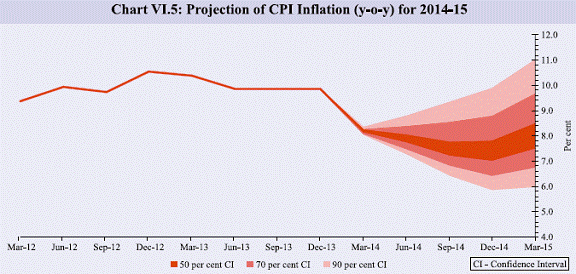
I.1 A detailed assessment of macroeconomic and monetary developments was released along with the monetary policy statement of January 28, 2014. This economic review provides an update taking into account the subsequent data releases. Global Economy Recovery is on track in 2014, though tightening financial conditions and the divergence in inflation pose risks I.2 Since the January 2014 monetary policy statement, global growth outlook remains broadly unchanged though weaker initial data to some extent cloud optimism. Global economic activity had strengthened in H2 of 2013. On the current reckoning, global growth is likely to be in the vicinity of 3½ per cent in 2014, about ½ a percentage point higher than in 2013. The expansion in global output is expected to be led by advanced economies (AEs), especially the US. However, downside risks to growth trajectory arise from ongoing tapering of quantitative easing (QE) in the US, continuing deflation concerns and weak balance sheets in the euro area and, inflationary pressures in the emerging market and developing economies (EMDEs). Weakening growth and financial fragilities in China that have arisen from rapid credit in recent years pose a large risk to global trade and growth. I.3 Growth also picked up in the EMDEs during H2 of 2013, but the momentum looks weaker than in the AEs and it faces new risks. Improved EMDE growth emanated largely from external demand on the back of currency depreciation in these countries. Going forward, drag on its sustainability may emerge from tightening monetary and financial conditions that can intensify further in case of a faster-than- anticipated withdrawal of monetary accommodation by the AEs. Recent sovereign rating downgrade for Brazil and downward revision in rating outlook for Russia has also added to the growth risks for EMDEs. I.4 Global inflation remains benign with activity levels staying below potential in the AEs as well as in some large EMDEs and a softer bias for global commodity prices continuing into 2014. However, inflation in many EMDEs remains high, though actions in tightening monetary policy and slack in output are expected to help generate some disinflationary momentum. The divergent trends in inflation between AEs and EMDEs pose an added risk to global growth. I.5 After the unexpected shock from the May 2013 tapering indication by the US Fed, global financial markets have weathered the initial dose of actual tapering of the quantitative easing (QE) quite well. However, the global interest rate cycle has just begun to turn. Moreover, a large part of the withdrawal of monetary accommodation by AEs remains to play out. Consequently, capital flows to EMDEs could remain volatile, even if they do not retrench. Also, with corporate leverage rising in many EMDEs, capital flow volatility could translate into liquidity shocks impacting asset prices. The Indian Economy The Indian economy is set on a disinflationary path, but more efforts may be needed to secure recovery I.6 While the global environment remains challenging, policy action in India has rebuilt buffers to cushion it against possible spillovers. These buffers effectively bulwarked the Indian economy against the two recent occasions of spillovers to EMDEs — the first, when the US Fed started the withdrawal of its large scale asset purchase programme and the second, which followed escalation of the Ukraine crisis. On both these occasions, Indian markets were less volatile than most of its emerging market peers. With the narrowing of the twin deficits – both current account and fiscal – as well as the replenishment of foreign exchange reserves, adjustment of the rupee exchange rate, and more importantly, setting in motion disinflationary impulses, the risks of near-term macro instability have diminished. However, this in itself constitutes only a necessary, but not a sufficient, condition for ensuring economic recovery. Much more efforts in terms of removing structural impediments, building business confidence and creating fiscal space to support investments will be needed to secure growth. I.7 Annual average CPI inflation has touched double digits or stayed just below for the last six years. This has had a debilitating effect on macro-financial stability through several channels and has resulted in a rise in inflation expectations and contributed to financial disintermediation, lower financial and overall savings, a wider current account gap and a weaker currency. A weaker currency was an inevitable outcome given the large inflation differential with not just the AEs, but also EMDEs. High inflation also had adverse consequences for growth. With the benefit of hindsight, it appears that the monetary policy tightening cycle started somewhat late in March 2010 and was blunted by a series of supply-side disruptions that raised inflation expectations and resulted in its persistence. Also, the withdrawal of the fiscal stimulus following the global financial crisis was delayed considerably longer than necessary and may have contributed to structural increases in wage inflation through inadequately targeted subsidies and safety net programmes. I.8 Since H2 of 2012-13, demand management through monetary and fiscal policies has been brought in better sync with each other with deficit targets being largely met. Monetary policy had effectively raised operational policy rates by 525 basis points (bps) during March 2010 to October 2011. Thereafter, pausing till April 2012, the Reserve Bank cut policy rates by 75 bps during April 2012 and May 2013 for supporting growth. Delayed fiscal adjustment materialised only in H2 of 2012-13, by which time the current account deficit (CAD) had widened considerably. The easing course of monetary policy was disrupted by ‘tapering’ fears in May 2013 that caused capital outflows and exchange rate pressures amid unsustainable CAD, as also renewed inflationary pressures on the back of the rupee depreciation and a vegetable price shock. The Reserve Bank resorted to exceptional policy measures for further tightening the monetary policy. As a first line of defence, short-term interest rates were raised by increasing the marginal standing facility (MSF) rate by 200 bps and curtailing liquidity available under the liquidity adjustment facility (LAF) since July 2013. As orderly conditions were restored in the currency market by September 2013, the Reserve Bank quickly moved to normalise the exceptional liquidity and monetary measures by lowering the MSF rate by 150 bps in three steps. However, with a view to containing inflation that was once again rising, the policy repo rate was hiked by 75 bps in three steps. I.9 Recent tightening, especially the last round of hike in January 2014, was aimed at containing the second round effects of the food price pressures felt during June-November 2013. Since then, inflation expectations have somewhat moderated and the temporary relative price shock from higher vegetable prices has substantially corrected along with a seasonal fall in these prices, without further escalation in ex-food and fuel CPI inflation. While headline CPI inflation receded over the last three months from 11.2 per cent in November 2013 to 8.1 per cent in February 2014, the persistence of ex-food and fuel CPI inflation at around 8 per cent for the last 20 months poses difficult challenges to monetary policy. I.10 Against this background there are three important considerations for the monetary policy ahead. First, the disinflationary process is already underway with the headline inflation trending down in line with the glide path envisaged by the Urjit Patel Committee, though inflation stays well above comfort levels. Second, growth concerns remain significant with GDP growth staying sub-5 per cent for seven successive quarters and index of industrial production (IIP) growth stagnating for two successive years. Third, though a negative output gap has prevailed for long, there is clear evidence that potential growth has fallen considerably with high inflation and low growth. This means that monetary policy needs to be conscious of the impact of supply-side constraints on long-run growth, recognising that the negative output gap may be minimal at this stage. Growth stays low, structural constraints affect potential output II.1 Growth in the Indian economy had been shifting down from 9.6 per cent in Q4 of 2010- 11. It troughed around 4.4 per cent for three quarters from Q3 of 2012-13 to Q1 of 2013-14. Since then there are signs of growth bottoming out with marginal improvement recorded during Q2 and Q3 of 2013-14 to 4.8 and 4.7 per cent respectively. However, this improvement has been feeble and clear signs of recovery are yet to emerge, even as the economy seems to be gearing for a modest recovery during 2014-15. II.2 The downward spiral in growth caused in large part by structural factors that impeded investment activity had a profound effect on India’s potential growth. On the basis of a simple Hodrick-Prescott (HP) filter on quarterly output levels, India’s potential growth appears to have dropped from 8-8.5 per cent during the period Q2:2005-06 to Q3:2008-09 to around 6 per cent during the period Q2:2012-13 to Q3:2013-14 (Chart II.1). The wide range of estimates using alternative techniques, on balance, suggests that currently the potential growth may be even somewhat lower than 6.0 per cent. Decline in financial savings, sluggish growth in fixed capital formation over successive quarters, persistently high inflation and low business confidence contributed to the decline in potential growth, particularly in the absence of adequate structural policy measures to lower inflation on a durable basis through improved supply responses and to facilitate implementation of large investment projects. Estimates of potential output are subject to considerable uncertainties given that they are sensitive to choice of methodologies, the time period used for estimation and end-period growth rates and have to be interpreted with judgment. On current reckoning, the economy seems to be running a negative output gap of about one percentage point, though the error bands around this estimate are wide . Agriculture sector witnessed record production II.3 The satisfactory monsoon and the absence of extreme climatic events until lately augur well for agricultural production and rural demand. Adequate replenishment of soil moisture and reservoirs significantly boosted crop production during 2013-14. As per the second advance estimates, the production of rice, wheat, pulses, oilseeds and cotton during 2013-14 have been estimated to be the highest ever. However, preliminary reports suggest that the unseasonal rains accompanied by hailstorm, and frost during early March 2014 in various parts of the country has adversely affected rabi crops like wheat, mustard seeds, onions and jowar. The possible effects of El Nino on the monsoon also add an additional element of uncertainty for future harvests. In this backdrop, the ability to meet increased food demand in the context of the implementation of the National Food Security Act, in the face of tightening farm labour markets and rising input costs remains a challenge. Industrial growth stagnating II.4 The Index of Industrial Production (IIP) showed no increase during April-January 2013-14, compared with 1.0 per cent growth in the corresponding period of the previous year. This stagnation in growth over two years reflects subdued investment and consumption demand. This has resulted in contraction in production of capital goods and consumer durables in the current year. Output of basic metals, fabricated metal products, machinery and equipment, motor vehicles, food products, gems and jewellery and communication equipment recorded a decline. Growth of core industries, which provide key inputs to the industrial sector, remained sluggish at 2.4 per cent during April-January 2013-14 compared to a growth of 6.9 per in the corresponding period a year ago. This sluggishness, in part, reflects contraction in natural gas and crude oil production and slow growth in all other infrastructure industries, except electricity. Capacity utilisation remained range bound II.5 Capacity utilisation (CU), as measured by the 24th round of the Order Books, Inventories and Capacity Utilisation Survey (OBICUS) of the Reserve Bank, remained largely flat in Q3 of 2013-14 (/en/web/rbi/-/publications/quarterly-order-books-inventories-and-capacity-utilisation-survey-obicus-october-december-2013-24th-round-15730). This is also reflected in the detrended IIP. Although the current level of CU is lower than that in the corresponding period of the previous year, new orders witnessed substantial growth on both q-o-q as well as y-o-y basis. Finished goods inventory to sales ratio also declined in Q3 of 2013-14 over the previous quarter. Lead indicators of services sector indicate an uptick II.6 The developments in lead indicators of the services sector activity signal improvement in most segments except cement production and in commercial vehicle sales. Weak consumer confidence has impacted the sale of passenger cars, commercial vehicles and three wheelers. The reduction in excise duty on passenger vehicles and two wheelers in the interim budget for 2014-15, is expected to provide some boost to this sector. Employment scenario showing signs of gradual recuperation II.7 As per the labour bureau survey, employment generation in eight key sectors that was moderating since January 2012 showed some improvement in July-September 2013 vis-a-vis the previous quarter. Some of the private data sources of employment in the organised sector have also registered uptick in hiring since Q2 of 2013-14. The IT-BPO sector contributed to this improvement along with other sectors such as textiles, telecom, pharmaceuticals as well as travel/tourism. Aggregate demand continued to moderate in Q3 of 2013-14, even as net exports remained buoyant1 II.8 In contrast to the pick-up in GDP growth at factor cost, the GDP growth at market prices during Q3 of 2013-14 moderated, reflecting lower mobilisation of net indirect taxes. Component-wise, both private and government final consumption expenditure continued to decelerate while fixed investment contracted in Q3. The weighted contribution of net exports to overall growth continued to remain the highest amongst all the components of GDP’s expenditure side. Efforts to address infrastructure bottlenecks have yielded modest revival so far II.9 By the end of January 2014, the Cabinet Committee on Investment (CCI) and the Project Monitoring Group (PMG) had together undertaken resolution of impediments for 296 projects with an estimated project cost of `6.6 trillion. As at end-March 2014 around 284 projects worth `15.6 trillion are under the consideration of PMG for which issues are yet to be resolved. Official data indicates that there has been a slight decline in the total number of delayed central sector infra-projects. However, 15-20 per cent of these projects, mostly in roads, power and petroleum, have reported additional delays, for which the dates of completion have been extended further. Also, there has been an increase in the number of projects without date of commissioning, mostly in roads reflecting the growing uncertainty about their completion. This suggests that it may take some more time before these clearances result in investment cycle turnaround. Corporate investment intentions improved in Q3 II.10 Corporate investment intentions improved in Q3 of 2013-14 compared to that in the previous quarter as 179 new large projects with an envisaged cost of `791 billion received financial assistance during the quarter, compared with 116 projects with an envisaged cost of ` 321 billion in Q2. This improvement was observed mainly in power and cement industries (Chart II.2). Aggregate sales growth (y-o-y) of large companies decelerated in Q3 II.11 Aggregate sales growth of a sample of 2,378 common companies decelerated to 5.1 per cent (y-o-y) in Q3 of 2013-14 after an upturn to 7.6 per cent in Q2 from 3.3 per cent in the preceding quarter. The deceleration was observed across the manufacturing and services sector, including the IT sector. However, due to lower growth in expenditure relative to sales, operating Profits turned around with a positive growth of 6.5 per cent in Q3 against contraction observed in the previous quarter. Profit margins have also improved. While fiscal targets were met in 2013-14 (RE), the quality of fiscal adjustment needs improvement II.12 All key deficits, with the exception of effective revenue deficit, have turned out to be lower in 2013-14 revised estimates (RE) than the budget estimates (BE) in absolute terms. In terms of GDP, while the revenue deficit of 3.3 per cent remained unchanged from the BE, gross fiscal deficit (GFD) and primary deficit (PD) were lower by 0.2 percentage points each, at 4.6 per cent and 1.3 per cent respectively. During 2014-15, the gross fiscal deficit-GDP ratio is budgeted to decline by 0.5 percentage points to 4.1 per cent, which will be in line with the stipulated minimum reduction under the amended FRBM rules. II.13 In 2013-14 (RE), gross tax revenues recorded a shortfall of around 6.2 per cent over the budgeted level, mainly on account of lower collections under indirect taxes which were affected by the industrial slowdown, deceleration in service sector growth and lower imports. Non-tax revenues, on the other hand, exceeded budgetary targets primarily on account of higher dividend receipts, some of them being ad hoc in nature, from various public sector enterprises and public sector banks. Non-debt capital receipts during 2013- 14 (RE) fell short of budgetary targets, reflecting lower than expected receipts from disinvestment. II.14 The shortfall in achieving the budgeted receipts under tax revenue and disinvestment proceeds was more than offset by a sharp cutback in plan expenditure, particularly on the revenue account. Non-plan expenditure stayed marginally higher than the BE, with the overshooting curtailed by a cut in non-plan spending under the fiscal austerity drive that offset a large part of the sharp increase in expenditure on major subsidies. However, while fiscal consolidation was evident in 2013- 14 (RE), improvement in its quality is needed. II.15 A more prudent fiscal regime based on accrual accounting may go a long way in improving fiscal transparency. Also, considering that one-off increases in non-tax revenues such as spectrum auctions are unlikely to sustain and the subsidy often tends to overshoot budgetary provisions, further curtailment of subsidies through appropriate price adjustments and better targeting of major subsidies is necessary to improve the quality of fiscal consolidation. There is also a need to cost out growing entitlements, since the full cost of a programme is rarely seen in the initial years. Food price corrections moderate inflationary pressures III.1 CPI inflation declined to 8.1 per cent in February 2014 (a 25-month low) from 11.2 per cent in November 2013, mainly due to declining vegetable prices during this three-month period (Chart III.1). Apart from vegetables, CPI inflation in ‘cereals and products’ posted a significant decline at 9.9 per cent in February 2014 from 12 per cent in November 2013. However, the pace of decline may come off as vegetable prices appear to have run their course of seasonal correction. III.2 Food and beverages group, which has an overall weight of 47.6 per cent in CPI Combined, had contributed significantly to overall CPI inflation during April 2012 to December 2013. Inflation in this segment stayed in double digits during this period before declining markedly from 14.7 per cent in November 2013 to 8.6 per cent in February 2014 mainly due to 34.2 per cent fall in the vegetable price index and 3.1 per cent decline in the price of sugar. The y-o-y inflation also eased marginally for transport and communication and housing sub-groups during February 2014, though the index increased on a month-over-month basis. The disinflation momentum was strong in the case of headline CPI while CPI excluding food and fuel remained sticky. This is evident from the trends in month-over-month seasonally adjusted annualised rates (M-o-M SAAR) (Chart III.2). III.3 Both the build-up of inflation during April to November 2013 and the subsequent fall in inflation during December 2013 to February 2014 was driven by food prices (Table III.1). Apart from vegetables, prices also moderated in the case of sugar and edible oils. Global sugar and edible oil prices have been declining in recent months, but for a marginal pick-up in February 2014, which provided some comfort. Wage price spiral pushed up inflation in the services segment III.4 CPI inflation, excluding food and fuel, remained high and persistent at 8.0 per cent in February 2014 as compared with 8.1 per cent in January 2014. The persistence was on account of pressures from housing, transport and communication and services led components such as medical care, education and stationery, household requisites and others (Chart III.3). High inflation with respect to CPI services reflected the role of wage pressures and other second round effects. The disaggregated CPI data also suggest that most of the items grew in a band of 6-8 per cent, while the ‘others’ subcategory, which includes charges paid to barbers, beauticians, washer-men, tailors and iron-men, grew at more than 10 per cent. inflation in the housing sub-group declined marginally below 10 per cent in February 2014 for the first time after the inflation numbers based on the new CPI became available from January 2012. WPI inflation moderates significantly, but fuel inflation remains high III.5 inflation as per the Wholesale Price Index (WPI) also recorded a significant fall to 4.7 per cent in February 2014 from 7.5 per cent in November 2013. While disinflationary impulses were led by food prices, non-food manufactured products inflation edged up a bit to 3.1 per cent in February 2014 after ranging between 2.2-2.6 per cent during May-September 2013. This was mainly due to cost push pressures from exchange rate pass-through during July-September and upward price revisions in paper and paper products, chemical and chemical products and basic metals and alloys. III.6 Suppressed inflation in the energy segment has been substantially passed through by now, though some more adjustment will be necessary in 2014-15 especially in diesel, gas and electricity that can still keep fuel inflation high. Despite moderate pressures from movements in global crude oil prices, WPI inflation in the fuel group continued to be high on account of staggered administered price revisions in the fuel segment (Chart III.4). In the longer run, however, the full pass through of the fuel price to the consumer may as well result in lower inflation as demand is not artificially supported. The release of suppressed inflation also provided some respite to the under-recoveries of oil marketing companies (OMCs). Despite this, the OMCs are currently (effective March 16, 2014) incurring a daily under-recovery of `4 billion on the sale of diesel, PDS kerosene and domestic LPG. Headline inflation has moderated in recent months, but upside risks remain in 2014-15 III.7 Pressures to CPI inflation in the recent past emanated from high and volatile food prices, which showed correction along with seasonal moderation in January-February 2014. The latest data from the Price Monitoring Cell of the Department of Consumer Affairs indicate that the seasonal correction has more or less played out. The Reserve Bank’s regional price monitoring information also suggests some uptick in prices of vegetable and fruits, especially in the wholesale market. Going forward, inflation may moderate in the context of relatively stable crude oil and range-bound global commodity prices next year. On the other hand, food inflation will depend on the onset and spatial and temporal distribution of the south-west monsoon. The timing and magnitude of revisions in administered prices, particularly electricity and coal, will also affect the trajectory of inflation in 2014-15. However, in the excluding food and fuel segment, retail inflation has been sticky at around 8 per cent. The course of the CPI inflation will hinge on the strength of disinflationary impulses from policy actions, extent of the negative output gap and movements in food prices. CAD improves, driven mainly by declining imports IV.1 External sector risks have been decidedly lowered, allowing monetary policy to focus on its core job of lowering inflation and supporting growth subject to disinflation. The narrowing of the CAD in 2013-14 followed a lower trade deficit due to higher exports as well as moderation in imports. IV.2 With a gradual recovery in key partner economies, India’s exports began to improve in July 2013; this was also helped by a depreciation of the rupee. However, export growth momentum recorded during July- October could not sustain thereafter. Export growth began to decelerate in November 2013 and eventually turned negative in February 2014. Slowdown in exports in recent months can be attributed to certain sector specific issues and global factors. For instance, 7.1 per cent decline in exports of gems and jewellery during 2013-14 (April-February) could be largely reflective of the price effect (estimated at (-) 4.2 per cent) mainly emanating from an 20.1 per cent y-o-y drop in gold prices. Fall in exports of petroleum products are largely attributed to lower gross refining margins in 2013-14 compared with previous year, even though refining margins improved somewhat in Q4 of 2013-14. Destination-wise, while export demand from economies like the US and China was broadly intact during November 2013 to January 2014, a significant decline was evident in exports to EU economies, Switzerland, the OPEC region, Singapore and Hong Kong SAR (Chart IV.1). Going forward, with a likely improvement in global growth prospects, export growth is likely to recover in 2014-15. IV.3 Imports continued to contract for the ninth successive month, with a sixth straight month of double digit decline. The decline in imports was primarily due to sharp moderation in gold imports since July 2013. India’s import bill for POL also remained largely contained reflecting broadly stable international crude oil prices (average Indian basket) and only a marginal increase in the quantum of oil imports. Although the decline in imports bodes well from the perspective of a CAD decline, the lowering of CAD on this account may not sustain with the expected revival of domestic aggregate demand. IV.4 Overall, India’s trade deficit at US$ 128 billion during April-February 2013-14 was about 29 per cent lower than that of US$ 180 billion during April-February 2012-13. The CAD-GDP ratio in Q3 of 2013-14 narrowed to 0.9 per cent from 6.5 per cent in Q3 of 2012-13 and 1.2 per cent of GDP in Q2 of 2013-14. CAD in 2013-14 is expected to be around 2 per cent of GDP. With revival of capital flows and lower CAD, concerns about the financing of latter have eased during H2 of 2013-14 (Chart IV.2). Surge in capital inflows led to accretion of reserves; the rupee has moved in a narrow range since end-November 2013 IV.5 Various measures undertaken by the Reserve Bank since September 2013 augured well for the resumption of capital inflows in subsequent months. The Reserve Bank’s swap windows for banks’ mobilisation of fresh FCNR(B) deposits and overseas borrowing helped to build up reserves during September- November 2013. With the revival of portfolio flows since December 2013, India’s forex reserves reached US$ 298.6 billion as on March 21, 2014, an accretion of US$ 23.1 billion over end-August 2013. IV.6 With a lower CAD and build-up of foreign exchange reserves, the downward pressure on the currency and the volatility in the Indian rupee began to subside. The rupee has also moved in a narrow range of `60.10 to `62.99 per US dollar since end-November 2013 (up to March 28, 2014). In fact, during this period the rupee fared better than most of other emerging market currencies. With higher reserves and lower imports, the import cover as at end-December 2013 improved to 7.3 months from 6.6 months as at end-September 2013. IV.7 In terms of real exchange rates, the 6-currency and 36-currency trade weighted REER as on March 21, 2014 showed a depreciation of 8.2 per cent and 5.9 per cent, respectively over March 2013. However, the 6-currency and 36-currency trade weighted REER, computed on the basis of new CPI index, show a lower depreciation of 7.3 per cent and 3.6 per cent, respectively. External sector risks mitigated, but structural adjustments needed for export competitiveness IV.8 India’s external sector at this juncture is more resilient compared to the post – May 22, 2013 period. A sharp decline in CAD in Q2 and Q3 helped in mitigating external sector vulnerabilities. Further, the increase in foreign exchange reserves has enhanced India’s capacity to withstand spillovers from the global economy. In order to ensure that the CAD stays within sustainable level over the medium term, policy efforts should continue to focus on addressing sector specific issues affecting export performance, reducing the savings investment imbalance by lowering inflation expectations to support private savings in financial assets rather than gold, and structural reforms including fiscal consolidation. Notwithstanding the favourable developments so far, the unanticipated pace of tapering and the political risk surrounding the April-May 2014 general elections call for careful monitoring and appropriate policy measures. V. MONETARY AND FINANCIAL CONDITIONS A 25 bps hike in policy rate undertaken in January to secure economy on disinflationary path V.1 The Reserve Bank in its Third Quarter Review of Monetary Policy on January 28, 2014, hiked the repo rate by 25 bps to 8 per cent on account of upside risks to inflation, to anchor inflation expectation and to contain second round effects (Chart V.1). The move was intended to set the economy securely on the disinflationary path as recommended by the Urjit Patel Committee. End-March pressures keep liquidity tight; RBI announces additional term repos V.2 Frictional pressures arising from elevated central government cash balances with the Reserve Bank and a rise in currency in circulation contributed to tight liquidity conditions in the first half of February 2014. However, on the back of significant drawdown in the government’s cash balances post the ‘Vote on Account’ presentation on February 17, 2014, and the injection of additional liquidity through term repos, the strains on liquidity eased. V.3 This was reflected in the under utilisation of the limit under the overnight LAF and reduced borrowings under MSF. The daily recourse to LAF (including term repo and MSF) declined from around `1.3 trillion in mid- February to `0.9 trillion in early March 2014. Narrowing of the wedge between credit and deposit growth also contributed to a reduction in the liquidity deficit. To manage evolving liquidity pressures, the Reserve Bank injected liquidity of about `95 billion through OMO outright purchase auction during Q4 of 2013-14, in addition to providing liquidity through overnight repo, MSF and term repos. V.4 However, liquidity conditions tightened from mid-March 2014 on the back of advance tax outflows. In order to address the anticipated tightening in liquidity conditions and with a view to providing flexibility to the banking system in its liquidity management towards end-March, the Reserve Bank announced term repos of various tenors in March 2014. Besides, it extended the MSF facility on March 29 and 31, 2014, both being holidays, to facilitate annual closing of accounts. V.5 During 2013-14, net liquidity to the tune of about `520 billion has been injected through outright OMOs, besides an average daily net liquidity injection of `906 billion through LAF, MSF and term repos and `294 billion through export credit refinance (ECR). During Q4, an average `1.1 trillion has been injected on a daily basis via LAF, MSF and term repos and `397 billion through ECR. Pick-up in currency and domestic assets support growth in monetary indicators V.6 In line with the domestic liquidity situation, reserve money increased by `313 billion in Q4 of 2013-14 driven by currency in circulation on the components side and net domestic assets, in particular net credit to the centre, on the sources side. Money supply growth (M3) has averaged 14.5 per cent (y-o-y) in Q4 (up to March 7, 2014), the same as in Q3. The pick-up in deposit mobilisation, led by a spike in FCNR(B) deposits in Q3, has since moderated to average 15 per cent (y-o-y). On the sources side, the credit off-take decelerated to average 14 per cent (y-o-y), thereby narrowing the wedge between credit and deposit growth. Credit off-take to industries moderates V.7 Deployment of credit to industries moderated in 2013-14, even as credit to agriculture and allied activities, services and personal loans picked up. Within industries, sectors such as food processing, construction, leather, rubber, glass and paper witnessed a pick-up during April-February 2014. Deposit and lending rates remain sticky V.8 Due to exchange market pressures, the Reserve Bank took exceptional measures in Q2 of 2013-14. Consequently, both deposit and lending rates firmed up by September 2013. With the ebbing of pressures on exchange rate, the Reserve Bank rolled back exceptional measures in a calibrated manner and, therefore, lending rates softened a bit in H2 of 2013-14. On balance, while lending rates were by and large sticky during the year, the median deposit rate of SCBs rose by 35 bps over the year, although it remained almost unchanged in the second half (Table V.1). V.9 The factors impeding the pace of smooth monetary policy transmission to the credit market include rigidities in repricing for fixed deposits, size of government borrowings, level of NPAs, high inflation and the significant presence of informal finance. In the presence of such structural rigidities in the credit market, the transmission of policy measures, particularly to the deposit and lending rates of banks, was relatively less pronounced as compared to money market rates. Volatility contained in domestic financial markets amid renewed global spillovers V.10 Following a period of relative calm, the start of calendar year 2014 witnessed a brief spell of moderate global financial market stress due to the escalation of conflict in Ukraine in February 2014. The announcement by the Fed of tapering by US$10 billion in January 2014 over and above a similar announcement in December witnessed renewed financial volatilities in most EMDEs. The US Fed again decided to taper its asset purchases by US$ 10 billion beginning April 2014 and signalled an earlier-than-expected start of the policy rate hike cycle, leading to bond yields hardening in the US. In the current environment, equities have become the preferred investment choice, as the low global rates have promoted a renewed search for yields (Chart V.2). V.11 India was able to withstand the bouts of spillovers much better than its peers in 2014 so far, having utilised the interim period to build buffers. Large debt inflows have occurred in 2014 so far with FII net investments in debt segment aggregating US$5.8 billion (till March 27). In recent weeks, equity flows have also picked up. Net FII investments in the equity segment aggregated US$3.2 billion during March so far, taking the total in 2014 so far to US$3.6 billion (till March 27). Equity market stages a recovery, yields stay firm V.12 Driven by expectations of a stable electoral outcome and a multitude of positives, including lower trade deficit numbers, lower inflation, an enthusiastic response to the telecom auction, incentives to certain sectors in the interim budget and a lower reported CAD, equity markets witnessed a modest rally with the BSE Sensex and NSE recording increases of about 6 per cent each during Q4 of 2013-14. Large equity inflows into India in recent weeks provided a boost to the rally (Chart V.3). However, primary capital markets continue to remain subdued. V.13 During Q4, G-sec yields witnessed two-way movements. The yields remained soft at the beginning of the quarter in anticipation of lower inflation numbers for December 2013. The policy rate hike in January 2014 resulted in hardening of yields. The yields remained capped after the primary auction deferred earlier was cancelled. The softer inflation numbers for January and February also supported the softening bias. The 10-year benchmark G-sec yield closed at 8.80 per cent at end-March 2014, marginally lower than at end-December 2013 (Chart V.4). Industrial Outlook Survey, after indicating improved confidence for Q4 of 2013-14, signal moderation for Q1 of 2014-15 VI.1 Various surveys conducted around January 2014 had indicated that business confidence improved significantly for Q4 of 2013-14. The Reserve Bank’s 65th round of Industrial Outlook Survey (/en/web/rbi/-/publications/industrial-outlook-survey-q4-2013-14-round-65-15731) conducted during February-March 2014 reaffirmed that in terms of assessment, the Business Expectations Index improved in Q4 of 2013-14 as compared to the previous quarter. However, based on expectations, it moderated marginally for Q1 of 2014-15 (Chart VI.1). Consumer confidence Index shows sign of improvement VI.2 The Reserve Bank’s 16th round of the Consumer confidence Survey (/en/web/rbi/-/publications/consumer-confidence-survey-march-2014-round-16-15732) conducted in February–March 2014 showed an improvement in consumer confidence as indicated by the Current Situation Index (CSI) and Future Expectations Index (FEI) (Chart VI.2). Professional forecasters anticipate modest recovery in 2014-15, inflation expected to go down2 VI.3 The Reserve Bank’s 27th round of the Survey of Professional Forecasters outside the Reserve Bank (/en/web/rbi/-/publications/results-of-the-survey-of-professional-forecasters-on-macroeconomic-indicators-27th-round-q4-2013-14-15729) showed that a modest recovery in 2014-15 is expected with growth at around 5.5 per cent. The expected CPI inflation for 2014-15 has been revised downwards to 8.0 per cent from 8.5 per cent in the previous round of the survey. Their forecast for CAD in 2014-15 is also now significantly lower at 2.4 per cent of GDP (Table VI.1).
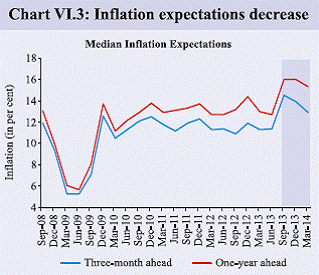
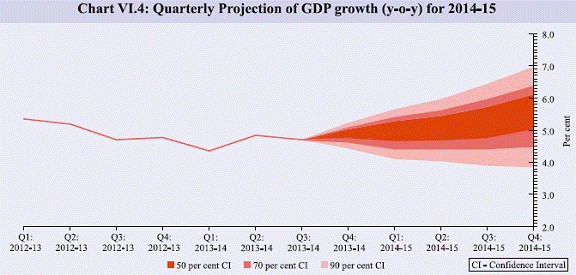
Perceptible decline in households’ inflation expectations VI.4 The latest round (i.e. January-March 2014) of Inflation Expectations Survey of Households (IESH Round 35) (/en/web/rbi/-/publications/inflation-expectations-survey-of-households-march-2014-round-35-15733) indicates that the perception of three-month ahead and one-year ahead median inflation expectations of households moved down as compared with the previous quarter. The qualitative responses indicate that the proportion of respondents expecting price rise by ‘more than current rate’ has also decreased for both three-month ahead and one-year ahead period as compared with the previous quarter (Chart VI.3). Modest recovery likely to shape in 2014-15 VI.5 The outlook for the Indian economy has improved over the past two months with cautiously positive business sentiments, improved consumer confidence, expectations of a modest recovery in growth and decline in inflation expectations. The challenge for maintaining disinflationary momentum over the medium term, however, remains. GDP growth at 4.7 per cent in Q3 of 2013-14, was slightly higher than that in the corresponding quarter of the previous year, but it has not been enough to suggest that the advanced estimates of 4.9 per cent during 2013-14 could be realised. The economy will now have to record a 5.5 per cent growth in Q4 to realise that growth, which on current assessment looks difficult. VI.6 A moderate recovery is likely to set in 2014-15 broadly in line with the Reserve Bank’s indicated projections in January 2014. However, data revisions for previous quarters and the consequent changes in base effects impart uncertainty to the growth trajectory ahead. The pace of recovery, nevertheless, is likely to be modest (Chart VI.4). The recovery is likely to be supported by investment activity picking up due to part resolution of stalled projects and improved business and consumer confidence. Manufacturing PMI, for the month of February 2014, touched a year’s high on the back of higher output and new orders. The rural demand base is likely to shore up demand following record agricultural output. In addition, external demand is expected to improve further during 2014-15 stemming from encouraging prospects for global growth, notwithstanding some recent loss in export growth momentum. VI.7 Downside risks to growth have increased marginally since January 2014 taking into account the continued weak performance of industry and increase in risks to agriculture from the El Nino phenomenon, though the actual outcome on the monsoon depends on several other weather parameters. Tighter global financial and monetary conditions, in addition to continued fiscal adjustment in some countries can also drag recovery. More importantly, if electoral outcomes fail to provide a stable government, the downside risks to growth could accentuate. To a large part, the recovery remains contingent on improvements in the investment climate. Disinflation proceeding on anticipated trajectory VI.8 Weak demand conditions kept global commodity price indices, for most of the primary commodities, well contained during 2013. In the baseline scenario, commodity prices are unlikely to increase significantly during 2014. The demand pressures are expected to remain muted against the backdrop of an expected gradual recovery in the advanced and emerging market economies and improved supplies. In the current scenario, global food and metal prices are likely to moderate. Brent crude oil spot prices averaged around US$ 108/ barrel (bbl) during Q4 of 2013-14. As per the US Energy Information Administration (EIA), the Brent crude oil price is projected to average at US$ 105/bbl and US$ 101/bbl in 2014 and 2015 respectively, thus imparting a mild softening bias. VI.9 Going forward, while the global commodity price scenario provides some comfort, the pace of deceleration in inflation may decline from what has been witnessed in recent months. This is because of the seasonal correction in vegetable prices likely having played itself out and supply-side responses remaining weak. In addition, significant month-to-month changes in base effect have a propensity to distort the underlying inflationary trajectory ahead. After some rise in the near months, headline inflation is expected to trend down aided by favourable base effects. It may bottom out in Q3 of 2014-15 before large adverse base effects and expected improved activity take inflation back to around the current levels (Chart VI.5). VI.10 Risks to inflation are more on the upside. They largely emanate from any adverse outcome on the monsoon, resurfacing of geopolitical risks that could lift commodity prices, sharper-than-anticipated tapering that could lead to exchange rate pass-through pressures and return of pricing power as the output gap narrows. 1Despite the well known limitations, expenditure-side GDP data are being used as proxies for components of aggregate demand. 2 The forecasts reflect the views of professional forecasters and not that of the Reserve Bank. |
||||||||||||||||||||||||||||||||||||||||||||||||||||||||||||||||||||||||||||||||||||||||||||||||||||||||||||||||||||||||||||||||||||||||||||||||||||||||||||||||||||||||||||||||||||||||||||||||||||||||||||||||||||||||||||||||||||||||||||||||||||||||||||||||||||||||||||||||||||||||||||||||||||
صفحے پر آخری اپ ڈیٹ:


