
4. All Scheduled Commercial Banks - Business in India - ربی - Reserve Bank of India


4. All Scheduled Commercial Banks - Business in India
(` Billion) |
|||||||||||
Last Reporting Friday (in case of March)/ Last Friday |
1990-91 |
2010-11 |
2011-12 |
2011 |
2012 |
||||||
Mar. |
Sep. |
Oct. |
Nov. |
Dec. |
Jan. |
Feb. |
Mar.(P) |
||||
1 |
2 |
3 |
4 |
5 |
6 |
7 |
8 |
9 |
10 |
11 |
|
Number of Reporting Banks |
271 |
163 |
166 |
163 |
166 |
166 |
166 |
166 |
166 |
167 |
167 |
Liabilities to the Banking System (1) |
64.9 |
1,105.9 |
1,246.7 |
1,105.9 |
1,078.7 |
1,068.1 |
1,008.6 |
1,189.9 |
1,176.2 |
1,176.5 |
1,246.7 |
Demand and Time Deposits from Banks (2), (12) |
54.4 |
737.4 |
838.7 |
737.4 |
758.5 |
697.4 |
687.3 |
744.9 |
739.7 |
777.9 |
838.7 |
Borrowings from Banks (3) |
9.7 |
297.2 |
347.5 |
297.2 |
220.0 |
271.2 |
221.1 |
325.4 |
334.6 |
272.4 |
347.5 |
Other Demand and Time Liabilities (4) |
0.8 |
71.2 |
60.4 |
71.2 |
100.3 |
99.5 |
100.2 |
119.5 |
101.9 |
126.2 |
60.4 |
Liabilities to Others (1) |
2,056.0 |
56,811.1 |
64,786.3 |
56,811.1 |
62,530.3 |
61,902.5 |
61,943.8 |
63,610.8 |
63,051.3 |
63,442.6 |
64,786.3 |
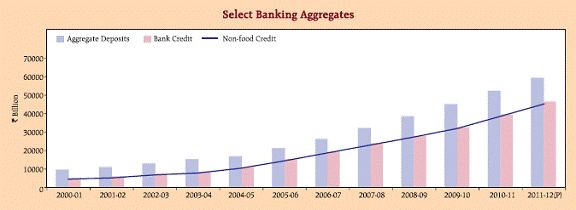
Aggregate Deposits (5) |
1,925.4 |
52,079.7 |
59,036.6 |
52,079.7 |
57,130.2 |
56,429.8 |
56,622.3 |
58,325.1 |
57,719.5 |
58,199.2 |
59,036.6 |
Demand |
331.9 |
6,417.1 |
6,228.0 |
6,417.1 |
6,478.7 |
5,823.0 |
5,730.1 |
6,410.0 |
5,955.6 |
5,970.7 |
6,228.0 |
Time (5) |
1,593.5 |
45,662.6 |
52,808.6 |
45,662.6 |
50,651.5 |
50,606.8 |
50,892.2 |
51,915.1 |
51,763.9 |
52,228.5 |
52,808.6 |
Borrowings (6) |
4.7 |
1,313.4 |
2,064.6 |
1,313.4 |
1,829.9 |
1,929.6 |
1,789.1 |
1,576.4 |
1,833.9 |
1,812.5 |
2,064.6 |
Other Demand and Time Liabilities (4), (13) |
125.9 |
3,418.0 |
3,685.2 |
3,418.0 |
3,570.3 |
3,543.1 |
3,532.3 |
3,709.3 |
3,498.0 |
3,431.0 |
3,685.2 |
Borrowings from Reserve Bank (7) |
34.7 |
50.3 |
87.5 |
50.3 |
39.5 |
37.5 |
58.3 |
58.8 |
92.6 |
55.2 |
87.5 |
Against Usance Bills/ Promissory Notes |
– |
– |
– |
– |
– |
– |
– |
– |
– |
– |
– |
Others |
34.7 |
50.3 |
87.5 |
50.3 |
39.5 |
37.5 |
58.3 |
58.8 |
92.6 |
55.2 |
87.5 |
See ‘Notes on Tables’. |
|||||||||||
 |
No. 4: All Scheduled Commercial Banks – Business in India (Concld.) |
|||||||||||
(` Billion) |
|||||||||||
Last Reporting Friday (in case of March)/ Last Friday |
1990-91 |
2010-11 |
2011-12 |
2011 |
2012 |
||||||
Mar. |
Sep. |
Oct. |
Nov. |
Dec. |
Jan. |
Feb. |
Mar.(P) |
||||
1 |
2 |
3 |
4 |
5 |
6 |
7 |
8 |
9 |
10 |
11 |
|
Cash in Hand and Balances with Reserve Bank |
256.7 |
3,495.1 |
3,592.9 |
3,495.1 |
4,395.2 |
3,914.2 |
4,095.0 |
3,884.7 |
4,054.5 |
3,484.1 |
3,592.9 |
Cash in Hand |
18.0 |
303.5 |
360.2 |
303.5 |
370.0 |
405.5 |
381.2 |
378.6 |
370.8 |
366.9 |
360.2 |
Balances with Reserve Bank (9) |
238.6 |
3,191.6 |
3,232.7 |
3,191.6 |
4,025.2 |
3,508.7 |
3,713.8 |
3,506.1 |
3,683.6 |
3,117.2 |
3,232.7 |
Assets with the Banking System |
55.8 |
1,543.9 |
1,743.4 |
1,543.9 |
1,730.1 |
1,547.0 |
1,453.5 |
1,886.5 |
1,753.1 |
1,740.8 |
1,743.4 |
Balances with Other Banks |
28.5 |
561.4 |
701.3 |
561.4 |
615.6 |
577.2 |
546.4 |
656.5 |
643.2 |
633.3 |
701.3 |
In Current Account |
17.9 |
101.0 |
101.2 |
101.0 |
124.4 |
95.2 |
82.3 |
99.1 |
86.0 |
89.7 |
101.2 |
In Other Accounts |
10.5 |
460.4 |
600.1 |
460.4 |
491.2 |
482.0 |
464.1 |
557.4 |
557.2 |
543.6 |
600.1 |
Money at Call and Short Notice |
14.5 |
166.1 |
210.8 |
166.1 |
152.1 |
193.9 |
137.3 |
248.6 |
230.8 |
210.5 |
210.8 |
Advances to Banks (10) |
9.0 |
125.7 |
134.8 |
125.7 |
121.5 |
58.6 |
68.8 |
94.2 |
72.9 |
68.9 |
134.8 |
Other Assets |
3.9 |
690.7 |
696.5 |
690.7 |
840.8 |
717.2 |
701.1 |
887.2 |
806.2 |
828.0 |
696.5 |
Investment |
750.7 |
15,016.2 |
17,366.4 |
15,016.2 |
16,858.1 |
17,063.5 |
17,106.5 |
16,948.1 |
6,914.4 |
17,456.9 |
17,366.4 |
Government Securities (11) |
500.0 |
14,971.5 |
17,337.0 |
14,971.5 |
16,818.7 |
17,023.9 |
17,067.4 |
16,914.8 |
16,883.1 |
17,427.9 |
17,337.0 |
Other Approved Securities |
250.7 |
44.7 |
29.4 |
44.7 |
39.4 |
39.6 |
39.1 |
33.2 |
31.3 |
29.0 |
29.4 |
Bank credit (14) |
1,163.0 |
39,420.8 |
46,116.3 |
39,420.8 |
42,232.8 |
41,574.5 |
42,060.8 |
43,668.8 |
43,527.3 |
44,091.0 |
46,116.3 |
|
(45.1) |
(642.8) |
(813.0) |
(642.8) |
(693.0) |
(726.8) |
(785.0) |
(845.5) |
(830.9) |
(832.1) |
(813.0) |
Loans, Cash-Credits and Overdrafts |
1,059.8 |
37,940.1 |
44,361.6 |
37,940.1 |
40,706.3 |
40,070.5 |
40,534.7 |
42,032.8 |
41,963.0 |
42,504.3 |
44,361.6 |
Inland Bills – Purchased |
33.7 |
134.4 |
163.2 |
134.4 |
142.0 |
132.6 |
139.5 |
159.6 |
155.7 |
156.9 |
163.2 |
Inland Bills – Discounted |
23.4 |
798.7 |
979.1 |
798.7 |
807.7 |
805.5 |
814.3 |
850.8 |
824.6 |
861.6 |
979.1 |
Foreign Bills – Purchased |
27.6 |
185.8 |
211.5 |
185.8 |
195.1 |
186.0 |
188.3 |
215.5 |
191.1 |
180.0 |
211.5 |
Foreign Bills – Discounted |
18.5 |
361.8 |
400.9 |
361.8 |
381.7 |
379.8 |
384.0 |
410.0 |
393.0 |
388.2 |
400.9 |
Cash-Deposit Ratio |
13.3 |
6.7 |
6.1 |
6.7 |
7.7 |
6.9 |
7.2 |
6.7 |
7.0 |
6.0 |
6.1 |
Investment- Deposit Ratio |
39.0 |
28.8 |
29.4 |
28.8 |
29.5 |
30.2 |
30.2 |
29.1 |
29.3 |
30.0 |
29.4 |
Credit-Deposit Ratio |
60.4 |
75.7 |
78.1 |
75.7 |
73.9 |
73.7 |
74.3 |
74.9 |
75.4 |
75.8 |
78.1 |

Share this page:


بھارت موبائل ایپلی کیشن کے ریزرو بینک کو انسٹال کریں اور تازہ ترین خبروں تک فوری رسائی حاصل کریں!


