India's Foreign Trade: 2007-08 (April-December)* The Directorate General for Commercial Intelligence and Statistics (DGCI & S) has recently released the provisional trade data for the period April-December, 2007 and commodity-wise details for April-October, 2007. On the basis of these data, this review has been prepared.
Highlights
- India's merchandise exports during December, 2007 increased by 16.0 per cent, marginally higher than 14.9 per cent during December 2006. During April-December, 2007 exports at US $ 111.0 billion increased by 21.6 per cent (24.8 per cent during April-December, 2006), thus maintaining the growth momentum.
- Imports during December 2007 showed a lower growth of 18.1 per cent (20.9 per cent during December 2006). During April-December, 2007, imports increased by 25.9 per cent, a moderation from 27.3 per cent increase during corresponding period of the previous year.
- Non-oil imports during April-December, 2007 continued to register accelerated growth at 32.5 per cent (22.1 per cent a year ago) and contributed to 85 per cent of growth in total imports.
- POL imports growth sharply decelerated to 12.2 per cent during the first nine months of 2007-08, as compared with 39.4 per cent during the corresponding period of the previous year.
- The average price of the Indian basket of crude oil at US $ 74.7 per barrel during April-December, 2007 was higher by 16.0 per cent than a year ago (US $ 64.4 per barrel).
- During April-December, 2007, trade deficit amounted to US $ 57.8 billion, higher by US $ 15.0 billion than a year ago (US $ 42.8 billion).
Exports
During December 2007 merchandise exports at US $ 12.3 billion recorded a growth of 16.0 per cent, marginally higher than 14.9 per cent a year back (Statement 1). The trends in exports during the current financial year reveal volatility in export growth. The export growth, after remaining subdued in the early part of the year began to pick up since July 2007 and recorded the highest monthly growth of 45.9 per cent in October 2007. Since then, the growth has shown deceleration (Chart 1). The overall exports during first nine months 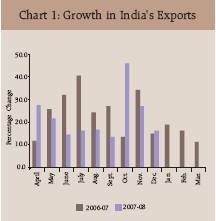
Table 1: India’s Merchandise Trade : |
April-December |
(US $ million) |
Item |
2006-07 R |
2007-08P |
Exports |
91,249 |
1,10,964 |
|
(24.8) |
(21.6) |
Oil exports* |
11,467 |
15,192 |
|
(87.4) |
(32.5) |
Non-Oil exports* |
59,484 |
70,925 |
|
(17.7) |
(19.2) |
Imports |
1,34,080 |
1,68,803 |
|
(27.3) |
(25.9) |
Oil Imports |
43,871 |
49,232 |
|
(39.4) |
(12.2) |
Non-Oil Imports |
90,209 |
1,19,571 |
|
(22.1) |
(32.5) |
Trade Balance |
-42.831 |
-57,839 |
Note : * Figures pertain to April-October.
Figures in parentheses show percentage change over the previous year.
P: Provisional; R: Revised Source : DGCI & S |
of 2007-08 (April-December, 2007), however, maintained the growth momentum (21.6 per cent), though it showed a moderation from the corresponding period of the previous year (24.8 per cent) [Table 1, Statement 2].
Commodity-wise data available for the period April-October, 2007 show that, barring gems and jewellery, the deceleration in growth continued across major commodity groups (Chart 2). Nevertheless, petroleum products, engineering goods and gems and jewellery continued to remain as the main drivers, as these product groups together contributed to about 63 per cent of the overall export growth during April-October, 2007.
Among primary products, agricultural and allied products decelerated to 20.9 per cent during April-October, 2007 (23.0 per cent), while ores and minerals picked up substantially (from 10.2 per cent to 
19.6 per cent). The deceleration in agricultural and allied products stemmed from the decline in exports of tea, coffee, wheat, cotton, cashew and marine products, and also moderation in sugar and molasses. Exports of agricultural and allied products to major markets, such as the UK, Russia, the US, Italy, Germany and China declined. Exports of ores and minerals, accounting for 34 per cent of the primary products exports, accelerated due to a sharp turnaround in iron ore exports (29.8 per cent).
Manufactured goods maintained the export growth, but with slight moderation, as most of its principal components such as engineering goods, chemicals and related products, textiles and textile products, leather and manufactures exhibited lower growth rates.
Engineering goods exhibited substantial deceleration from 37.9 per cent to 21.5 per cent due to moderation in the growth of machinery and instruments, iron and steel and electronic goods, while manufactures of metals and transport equipments showed sharp acceleration. Exports to major markets, such as the US, Singapore and Egypt showed decline.
Chemicals and related products showed sharp moderation in export growth (from 22.2 per cent to 11.8 per cent) due to decline in exports of plastic and linoleum and moderation in basic chemicals, pharmaceuticals, rubber, glass paints and enamels.
Textiles and textile products continued its deceleration with growth dipping to 3.0 per cent during April-October, 2007 (9.2 per cent a year ago). Exports of natural silk yarn and woolen yarn, fabrics, madeups, readymade garments and carpets showed decline, while cotton yarn, fabrics, madeups and man-made staple fibre moderated. Exports to the US, Bangladesh, Italy, Korea, Germany, the UK, France, the UAE and Saudi Arabia recorded decline. It may, however, be noted that growth in textiles exports showed persistent decline till April 2007, and thereafter staged marked recovery (Chart 3).
The exports of gems and jewellery during April-October, 2007 attained a growth of 24.5 per cent compared with a negative growth a year ago (-3.0 per cent). According to the latest data from the Gem and Jewellery Export Promotion Council (GJEPC), during April-January, 2007-08, exports of gems and jewellery registered a growth of 21.0 per cent. 
Exports of petroleum products during April-October, 2007 exhibited a sharp moderation in growth at 32.5 per cent as against 87.4 per cent recorded a year ago. Exports to principal markets, viz., Singapore, the UK, Sri Lanka and Yemen Republic suffered decline during the period under review. Destination-wise, the US continued to be the single largest market for India's exports, but its share declined to 13.8 per cent during April-October, 2007 from 15.5 per cent a year ago. The decline in the share of the US may be traced to the recent change in commodities composition in India's trade with the US (Box).
The other important destinations for exports were the UAE (10.3 per cent), China (5.3 per cent), Singapore (4.4 per cent), the UK (4.2 per cent), Hong Kong (4.1 per cent) and Germany (3.1 per cent). Of these, the shares of the UAE and Hong Kong in the overall exports during April-October, 2007 increased over corresponding period during previous year, while the shares of China, Singapore and the UK declined, and the share of Germany remained the same. Region-wise, exports to the EU, Eastern Europe and Asian developing countries showed accelerated growth, while those to North America, Asia and Oceania, OPEC, African developing countries and Latin American countries moderated. Box: India's Trade with the US: Changing Commodity Composition The India-US bilateral trade relations assume critical importance in the fast growing global economic integration, with India emerging as one of the fastest growing economies in the world and the US being the world's largest economy. The US trade (exports and imports) at US $ 2,956 billion in 2006 accounted for 12.1 per cent of the global merchandise trade. The major trading partners of the US are Canada, Mexico, China, Japan, Korea and European Union (EU) countries. India accounted for 1.1 per cent of total trade of the US in 2006. The US has been the largest trading partner for India and its share in India's total trade (exports plus imports) during 2006-07 stood at 9.8 per cent - 14.9 per cent in India's exports and 6.3 per cent in India's imports. Since India's exports to the US consistently exceeded imports, India has been maintaining a trade surplus with the US (Chart 1); India's trade surplus with the US increased from US $ 5.4 billion in 2001-02 to US $ 7.1 billion in 2006-07. From the perspective of the US, the share of India in the imports of the US has progressively increased from 0.9 per cent in 2001 to 1.2 per cent in 2006. 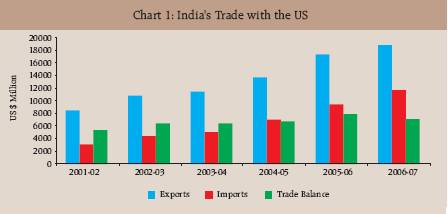
A striking feature of India's trade with the US in recent years is a steady deterioration in the share of the US in India's overall exports as also changes in commodity composition. Gems and jewellery, engineering goods, readymade garments and chemicals and related products account for about 75 per cent of the India's exports to the US. Incidentally, these commodity groups are currently the main drivers of India's export growth. However, India's exports to the US have undergone structural change during the last five years (2001-07). The shares of engineering goods and chemicals and related products in exports to the US increased during this period, while the shares of gems and jewellery and readymade garments drastically declined (Chart 2-A and Chart 2-B). Thus, the deterioration in gems and jewellery and textile products mainly contributed to the decline in the share of the US in India's overall exports.
The structural shift has occurred on import front as well. India's major imports from the US are transport equipments, electronic goods, machinery, chemicals, fertilizers and professional instruments which together account for about 67 per cent of India's imports 
from the US. However, between 2001-02 and 2006-07 the shares of transport equipments and fertilisers in imports from the US increased, whereas the shares of electronic goods, machinery, chemicals and professional instruments suffered decline.
Since 2000, the two countries have been making efforts to strengthen the bilateral economic relations by means of the "India-US Economic Dialogue". The US-India Trade Policy Forum, launched in November, 2005, was designed to expand bilateral trade and investment relations between India and the US. The bilateral trade between India and the US is expected to double in the next three years with both the nations endorsing several co-operative steps, including cutting down barriers to trade and investment. [References: (i) Ministry of Commerce, Government of India, (ii) Indian Embassy, Washington (http://www.indianembassy.org/ newsite/economyrelations.asp)] Imports
During April-December, 2007, India's imports stood at US $ 168.8 billion, recording a moderation in growth at 25.9 per cent as against 27.3 per cent a year ago. Non-oil imports (US $ 119.6 billion) continued its accelerated growth (32.5 per cent as against 22.1 per cent a year ago) and contributed about 85 per cent to the growth in overall imports.
Imports of petroleum, oil and lubricants (POL) during April-December, 2007 (US $ 49.2 billion) substantially decelerated to 12.2 per cent from 39.4 per cent a year ago. The average price of Indian basket of crude oil, which stood at US $ 74.7 per barrel during April-December, 2007, was higher by 16.0 per cent than US $ 64.4 per barrel during the corresponding period of the previous year (18.7 per cent) [Table 2].
The consumption of petroleum products, according to Ministry of Petroleum and Natural Gas, Government of India, during April-December, 2007 was higher by 5.5 per cent than that during a year ago. In case of non-oil imports, capital goods and gold and silver continued to be the main contributors of import growth (Chart 4). During April-October, 2007, capital goods imports increased by 32.0 per cent (36.9 per cent), while gold and silver grew by 40.7 per cent (20.8 per cent). Among other non-oil products, imports of pearls, precious and semiprecious stones, chemicals, electrical machinery, iron and steel showed accelerated growth during the period (Statement 5). Source-wise, China was the major source of imports accounting for 11.5 per 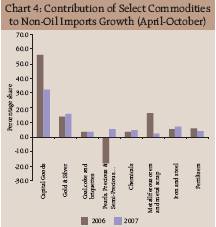
Table 2: Trends in Crude Oil Prices |
(US $/barrel) |
|
Dubai |
UK Brent |
US- WTI |
Indian basket* |
1995-96 |
16.2 |
17.5 |
18.8 |
16.7 |
2000-01 |
25.9 |
28.1 |
30.3 |
26.8 |
2001-02 |
21.8 |
23.2 |
24.1 |
22.4 |
2002-03 |
25.9 |
27.6 |
29.2 |
26.6 |
2003-04 |
26.9 |
29.0 |
31.4 |
27.8 |
2004-05 |
36.4 |
42.2 |
45.0 |
39.2 |
2005-06 |
53.4 |
58.0 |
59.9 |
55.7 |
2006-07 |
60.9 |
64.4 |
64.7 |
62.4 |
2006-07 |
|
|
|
|
(April- December) 2007-08 |
62.6 |
66.5 |
66.9 |
64.4 |
(April- December) |
72.6 |
77.6 |
77.0 |
74.7 |
December 2006 |
58.7 |
62.3 |
62.0 |
60.4 |
December 2007 |
85.8 |
91.5 |
91.4 |
87.9 |
Note:* The composition of Indian Basket represents average of Oman and Dubai for sour grades and Brent (dated) for sweet grade in the ratio of 61.4:38.6 for 2007-08.
Sources: (1) International Monetary Fund, International Financial Statistics, World Bank's Commodity Price Pink sheet January 2007,
(2) Ministry of Petroleum and Natural Gas, Government of India. |
cent of total imports during April-October, 2007. The other major sources of imports were Saudi Arabia (7.3 per cent), the US (5.9 per cent), the UAE (5.5 per cent), Switzerland (5.1 per cent), Iran (4.2 per cent), Germany (3.9 per cent) and Australia (3.8 per cent) [Statement 6].
Trade Deficit
The merchandise trade deficit during April-December, 2007 at US $ 57.8 billion was higher by US $ 15.0 billion than the deficit of US $ 42.8 billion during the corresponding period of the previous year. The trade deficit on oil account during April-October, 2007 amounted to US $ 25.9 billion, which was higher by US $ 2.2 billion than a year ago (US $ 23.7 billion).
Table 3: Global Merchandise Trade Growth |
(Per Cent) |
Country/ Region |
Exports |
Imports |
|
(January- November) |
(January- November) |
|
2006 |
2007 |
2006 |
2007 |
|
|
|
|
|
World* |
14.9 |
14.6 |
14.8 |
13.7 |
Industrial |
|
|
|
|
Countries* |
11.6 |
13.8 |
12.9 |
11.0 |
Developing |
|
|
|
|
Countries |
19.3 |
16.3 |
18.1 |
18.2 |
USA |
15.6 |
12.0 |
11.5 |
4.8 |
EU |
21.9 |
17.7 |
28.5 |
14.6 |
Japan |
9.1 |
8.7 |
12.7 |
7.2 |
China |
27.5 |
26.1 |
20.6 |
20.3 |
Singapore |
19.9 |
9.9 |
19.6 |
10.1 |
Korea |
14.6 |
14.1 |
15.8 |
14.5 |
Hong Kong |
9.1 |
8.9 |
11.3 |
10.0 |
Malaysia |
14.1 |
9.6 |
15.0 |
11.6 |
* January-October
Sources :
(1) International Financial Statistics, International Monetary fund,
(2) Eurostat |
Global Trade
According to the IMF, International Financial Statistics data, world exports during January-October, 2007 at 14.6 per cent almost maintained the growth recorded a year ago (14.9 per cent) [Table 3]. Exports from the industrialized countries registered a higher growth of 13.8 per cent (11.6 per cent a year ago) with the countries such as France, Germany, Italy and Switzerland showing acceleration in export growth. Developing countries showed a moderation in growth during January-November, 2007 (16.3 per cent as against 19.3 per cent) with countries like China, Singapore and Malaysia showing deceleration in export growth.
Statement 1 : India's Foreign Trade - December 2007 |
Year |
Export |
Import |
Trade Balance |
|
Total |
Oil |
Non-Oil |
Total |
Oil |
Non-Oil |
Total |
Oil |
Non-Oil |
1 |
2 |
3 |
4 |
5 |
6 |
7 |
8 |
9 |
10 |
Rupees crore |
2005-06 |
42,151 |
4,778 |
37,373 |
56,547 |
16,967 |
39,580 |
-14,396 |
-12,189 |
-2,208 |
|
(30.3) |
(93.2) |
(25.1) |
(23.0) |
(88.2) |
(7.0) |
|
|
|
2006-07 R |
47,368 |
6,666 |
40,702 |
66,848 |
19,828 |
47,020 |
-19,479 |
-13,162 |
-6,318 |
|
(12.4) |
(39.5) |
(8.9) |
(18.2) |
(16.9) |
(18.8) |
|
|
|
2007-08 P |
48,570 |
.. |
.. |
69,732 |
23,516 |
46,215 |
-21,162 |
|
|
|
(2.5) |
|
|
(4.3) |
(18.6) |
(-1.7) |
|
|
|
US dollar million |
2005-06 |
9,235 |
1,047 |
8,188 |
12,390 |
3,717 |
8,672 |
-3,154 |
-2,671 |
-484 |
|
(25.5) |
(86.1) |
(20.5) |
(18.5) |
(81.4) |
(3.1) |
|
|
|
2006-07 R |
10,612 |
1,494 |
9,119 |
14,977 |
4,442 |
10,534 |
-4,364 |
-2,949 |
-1,415 |
|
(14.9) |
(42.7) |
(11.4) |
(20.9) |
(19.5) |
(21.5) |
|
|
|
2007-08 P |
12,315 |
.. |
.. |
17,681 |
5,963 |
11,718 |
-5,366 |
|
|
|
(16.0) |
|
|
(18.1) |
(34.2) |
(11.2) |
|
|
|
SDR million |
2005-06 |
6,453 |
732 |
5,721 |
8,657 |
2,597 |
6,059 |
-2,204 |
-1,866 |
-338 |
|
(35.1) |
(100.3) |
(29.7) |
(27.5) |
(95.2) |
(11.0) |
|
|
|
2006-07 R |
7,038 |
990 |
6,048 |
9,932 |
2,946 |
6,986 |
-2,894 |
-1,956 |
-939 |
|
(9.1) |
(35.4) |
(5.7) |
(14.7) |
(13.4) |
(15.3) |
|
|
|
2007-08P |
7,808 |
.. |
.. |
11,210 |
3,781 |
7,430 |
-3,402 |
|
|
|
(10.9) |
|
|
(12.9) |
(28.3) |
(6.3) |
|
|
|
P : Provisional. R : Revised. .. : Not available.
Note : Figures in brackets relate to percentage variation over the corresponding previous period.
Source : DGCI & S. |
Statement 2 : India's Foreign Trade |
Year |
Exports |
Imports |
Trade Balance |
|
Total |
Oil |
Non-Oil |
Total |
Oil |
Non-Oil |
Total |
Oil |
Non-Oil |
1 |
2 |
3 |
4 |
5 |
6 |
7 |
8 |
9 |
10 |
April-March |
Rupees crore |
2004-2005 |
375,340 |
31,404 |
343,935 |
501,065 |
134,094 |
366,971 |
-125,725 |
-102,690 |
-23,035 |
|
(27.9) |
(91.5) |
(24.2) |
(39.5) |
(41.9) |
(38.7) |
|
|
|
2005-2006 R |
456,418 |
51,533 |
404,885 |
660,409 |
194,640 |
465,769 |
-203,991 |
-143,107 |
-60,884 |
|
(21.6) |
(64.1) |
(17.7) |
(31.8) |
(45.2) |
(26.9) |
|
|
|
2007 P |
571,779 |
84,520 |
487,259 |
840,506 |
258,572 |
581,935 |
-268,727 |
-174,052 |
-94,675 |
|
(25.3) |
(64.0) |
(20.3) |
(27.3) |
(32.8) |
(24.9) |
|
|
|
US dollar million |
2004-2005 |
83,536 |
6,989 |
76,547 |
111,517 |
29,844 |
81,673 |
-27,981 |
-22,855 |
-5,127 |
|
(30.8) |
(95.9) |
(27.0) |
(42.7) |
(45.1) |
(41.8) |
|
|
|
2005-2006 R |
103,091 |
11,640 |
91,451 |
149,166 |
43,963 |
105,203 |
-46,075 |
-32,323 |
-13,752 |
|
(23.4) |
(66.5) |
(19.5) |
(33.8) |
(47.3) |
(28.8) |
|
|
|
2007 P |
126,361 |
18,679 |
107,683 |
185,749 |
57,144 |
128,606 |
-59,388 |
-38,465 |
-20,923 |
|
(22.6) |
(60.5) |
(17.7) |
(24.5) |
(30.0) |
(22.2) |
|
|
|
SDR million |
2004-2005 |
56,081 |
4,692 |
51,389 |
74,866 |
20,036 |
54,830 |
-18,785 |
-15,343 |
-3,442 |
|
(25.6) |
(88.0) |
(21.9) |
(36.9) |
(39.2) |
(36.1) |
|
|
|
2005-2006 R |
70,774 |
7,991 |
62,783 |
102,405 |
30,182 |
72,224 |
-31,632 |
-22,191 |
-9,441 |
|
(26.2) |
(70.3) |
(22.2) |
(36.8) |
(50.6) |
(31.7) |
|
|
|
2007 P |
85,018 |
12,567 |
72,451 |
124,975 |
38,447 |
86,528 |
-39,957 |
-25,880 |
-14,077 |
|
(20.1) |
(57.3) |
(15.4) |
(22.0) |
(27.4) |
(19.8) |
|
|
|
April-December |
Rupees crore |
2005-2006 |
323,373 |
36,278 |
287,095 |
465,966 |
139,224 |
326,742 |
-142,592 |
-102,946 |
-39,647 |
|
(26.3) |
(61.5) |
(22.9) |
(34.8) |
(43.3) |
(31.4) |
|
|
|
2006-2007 R |
416,176 |
65,328 |
350,847 |
611,522 |
200,090 |
411,432 |
-195,346 |
-134,762 |
-60,584 |
|
(28.7) |
(80.1) |
(22.2) |
(31.2) |
(43.7) |
(25.9) |
|
|
|
2008 P |
448,377 |
.. |
.. |
682,088 |
198,934 |
483,154 |
-233,711 |
|
|
|
(7.7) |
|
|
(11.5) |
(-0.6) |
(17.4) |
|
|
|
US dollar million |
2005-2006 |
73,111 |
8,202 |
64,909 |
105,349 |
31,477 |
73,872 |
-32,238 |
-23,275 |
-8,964 |
|
(29.5) |
(65.6) |
(26.0) |
(38.1) |
(46.9) |
(34.7) |
|
|
|
2006-2007 R |
91,249 |
14,324 |
76,926 |
134,080 |
43,871 |
90,209 |
-42,831 |
-29,548 |
-13,284 |
|
(24.8) |
(74.6) |
(18.5) |
(27.3) |
(39.4) |
(22.1) |
|
|
|
2008 P |
110,964 |
15192* |
70925* |
168,803 |
49,232 |
119,571 |
-57,839 |
|
|
|
(21.6) |
(32.5) |
(19.2) |
(25.9) |
(12.2) |
(32.5) |
|
|
|
SDR million |
2005-2006 |
50,005 |
5,610 |
44,395 |
72,054 |
21,529 |
50,526 |
-22,050 |
-15,919 |
-6,131 |
|
(30.9) |
(67.5) |
(27.4) |
(39.7) |
(48.6) |
(36.3) |
|
|
|
2006-2007 R |
61,578 |
9,666 |
51,912 |
90,481 |
29,605 |
60,876 |
-28,904 |
-19,939 |
-8,964 |
|
(23.1) |
(72.3) |
(16.9) |
(25.6) |
(37.5) |
(20.5) |
|
|
|
2008 P |
71,992 |
.. |
.. |
109,517 |
31,941 |
77,576 |
-37,525 |
|
|
|
(16.9) |
|
|
(21.0) |
(7.9) |
(27.4) |
|
|
|
P : Provisional. R : Revised. .. : Not available. * : Figures pertain to the month of April-October.
Note :
1. Figures in brackets relate to percentage variation over the corresponding period of the previous year.
2. Data conversion has been done using period average exchange rates.
Source : DGCI & S. |
Statement 3 : India's Exports of Principal Commodities |
(US $ million) |
Commodity Group |
April-October |
Percentage Variation |
|
2005-06 |
2006-07 |
2007-08 P |
(3)/(2) |
(4)/(3) |
(1) |
(2) |
(3) |
(4) |
(5) |
(6) |
I. |
Primary Products |
8,355.5 |
9,878.5 |
11,901.5 |
18.2 |
20.5 |
|
|
|
(14.7) |
(13.9) |
(13.8) |
|
|
|
A. |
Agricultural & Allied Products |
5,247.7 |
6,454.1 |
7,804.9 |
23.0 |
20.9 |
|
|
of which : |
(9.3) |
(9.1) |
(9.1) |
|
|
|
|
1. |
Tea |
233.6 |
274.4 |
267.7 |
17.5 |
-2.5 |
|
|
2. |
Coffee |
203.8 |
261.9 |
239.6 |
28.5 |
-8.5 |
|
|
3. |
Rice |
799.7 |
831.6 |
1,339.0 |
4.0 |
61.0 |
|
|
4. |
Wheat |
120.2 |
7.0 |
0.0 |
-94.2 |
-99.4 |
|
|
5. |
Cotton Raw incl. Waste |
151.4 |
372.4 |
276.0 |
145.9 |
-25.9 |
|
|
6. |
Tobacco |
171.7 |
219.3 |
273.0 |
27.7 |
24.5 |
|
|
7. |
Cashew incl. CNSL |
358.7 |
319.7 |
298.1 |
-10.9 |
-6.7 |
|
|
8. |
Spices |
272.5 |
363.4 |
578.3 |
33.4 |
59.1 |
|
|
9. |
Oil Meal |
361.4 |
441.9 |
539.0 |
22.3 |
22.0 |
|
|
10. |
Marine Products |
882.1 |
958.1 |
927.1 |
8.6 |
-3.2 |
|
|
11. |
Sugar & Mollases |
19.2 |
525.2 |
717.7 |
2637.7 |
36.7 |
|
B. |
Ores & Minerals |
3,107.8 |
3,424.4 |
4,096.7 |
10.2 |
19.6 |
|
|
of which : |
(5.5) |
(4.8) |
(4.8) |
|
|
|
|
1. |
Iron Ore |
1,928.7 |
1,779.9 |
2,309.6 |
-7.7 |
29.8 |
|
|
2. |
Processed Minerals |
591.3 |
775.4 |
714.0 |
31.1 |
-7.9 |
II. |
Manufactured Goods |
40,692.6 |
47,673.5 |
55,139.4 |
17.2 |
15.7 |
|
|
of which : |
(71.8) |
(67.2) |
(64.0) |
|
|
|
A. |
Leather & Manufactures |
1,559.5 |
1,719.9 |
1,882.5 |
10.3 |
9.5 |
|
B. |
Chemicals & Related Products |
7,926.3 |
9,686.1 |
10,833.1 |
22.2 |
11.8 |
|
|
1. |
Basic Chemicals, Pharmaceuticals & Cosmetics |
4,780.8 |
6,072.9 |
6,976.5 |
27.0 |
14.9 |
|
|
2. |
Plastic & Linoleum |
1,620.1 |
1,855.3 |
1,783.6 |
14.5 |
-3.9 |
|
|
3. |
Rubber, Glass, Paints & Enamels etc., |
1,149.1 |
1,344.0 |
1,568.2 |
17.0 |
16.7 |
|
|
4. |
Residual Chemicals & Allied Products |
376.3 |
413.9 |
504.7 |
10.0 |
21.9 |
|
C. |
Engineering Goods |
11,761.5 |
16,213.4 |
19,698.6 |
37.9 |
21.5 |
|
|
of which : |
|
|
|
|
|
|
|
1. |
Manufactures of metals |
2,320.1 |
2,813.2 |
3,706.2 |
21.3 |
31.7 |
|
|
2. |
Machinery & Instruments |
2,739.2 |
3,784.6 |
4,727.0 |
38.2 |
24.9 |
|
|
3. |
Transport equipments |
2,407.2 |
2,634.1 |
3,615.7 |
9.4 |
37.3 |
|
|
4. |
Iron & steel |
1,981.8 |
2,932.9 |
2,943.5 |
48.0 |
0.4 |
|
|
5. |
Electronic goods |
1,153.6 |
1,604.3 |
1,789.8 |
39.1 |
11.6 |
|
D. |
Textiles and Textile Products |
9,037.6 |
9,868.5 |
10,162.8 |
9.2 |
3.0 |
|
|
1. |
Cotton Yarn, Fabrics, Made-ups, etc., |
2,197.9 |
2,444.5 |
2,540.2 |
11.2 |
3.9 |
|
|
2. |
Natural Silk Yarn, Fabrics Madeups etc.(incl.silk waste) |
257.4 |
254.7 |
217.2 |
-1.1 |
-14.7 |
|
|
3. |
Manmade Yarn, Fabrics, Made-ups, etc., |
1,101.2 |
1,233.7 |
1,553.2 |
12.0 |
25.9 |
|
|
4. |
Manmade Staple Fibre |
43.5 |
94.8 |
136.7 |
118.2 |
44.2 |
|
|
5. |
Woolen Yarn, Fabrics, Madeups etc. |
50.8 |
49.7 |
48.3 |
-2.0 |
-3.0 |
|
|
6. |
Readymade Garments |
4,667.5 |
5,005.9 |
4,910.6 |
7.2 |
-1.9 |
|
|
7. |
Jute & Jute Manufactures |
173.7 |
176.4 |
179.0 |
1.6 |
1.5 |
|
|
8. |
Coir & Coir Manufactures |
78.6 |
80.5 |
92.2 |
2.4 |
14.6 |
|
|
9. |
Carpets |
467.0 |
528.2 |
485.2 |
13.1 |
-8.1 |
|
|
|
(a) Carpet Handmade |
456.0 |
514.2 |
479.5 |
12.8 |
-6.8 |
|
|
|
(b) Carpet Millmade |
0.0 |
0.0 |
0.0 |
|
|
|
|
|
(c) Silk Carpets |
11.1 |
14.1 |
5.8 |
26.7 |
-59.0 |
|
E. |
Gems & Jewellery |
9,547.8 |
9,259.2 |
11,524.6 |
-3.0 |
24.5 |
|
F. |
Handicrafts |
288.9 |
275.6 |
234.0 |
-4.6 |
-15.1 |
III. |
Petroleum Products |
6,119.0 |
11,467.1 |
15,192.3 |
87.4 |
32.5 |
|
|
|
(10.8) |
(16.2) |
(17.6) |
|
|
IV. |
Others |
1,502.1 |
1,932.3 |
3,884.2 |
28.6 |
101.0 |
|
|
(2.7) |
(2.7) |
(4.5) |
|
|
Total Exports |
56,669.2 |
70,951.4 |
86,117.4 |
25.2 |
21.4 |
P - Provisional.
Note 1 - Figures in brackets relate to percentage to total exports for the period.
Source - DGCI & S. |
Statement 4 : Direction of India’s Foreign Trade-Exports |
(US $ million) |
Group / Country |
April-October |
Percentage Variation |
|
2005-06 |
2006-07 |
2007-08 P |
(3)/(2) |
(4)/(3) |
(1) |
(2) |
(3) |
(4) |
(5) |
(6) |
I. |
O E C D
Countries |
25,330.5 |
29,318.6 |
33,808.1 |
15.7 |
15.3 |
|
|
A. |
E U |
12,183.5 |
14,224.0 |
17,260.6 |
16.7 |
21.3 |
|
|
|
Of which: |
|
|
|
|
|
|
|
|
1. |
Belgium |
1,610.3 |
1,889.0 |
2,364.3 |
17.3 |
25.2 |
|
|
|
2. |
France |
1,170.5 |
1,200.3 |
1,339.0 |
2.5 |
11.6 |
|
|
|
3. |
Germany |
1,914.3 |
2,199.4 |
2,680.5 |
14.9 |
21.9 |
|
|
|
4. |
Italy |
1,324.1 |
1,963.0 |
2,155.0 |
48.2 |
9.8 |
|
|
|
5. |
Netherland |
1,314.5 |
1,395.3 |
2,448.9 |
6.1 |
75.5 |
|
|
|
6. |
U K |
2,816.8 |
3,099.9 |
3,652.3 |
10.1 |
17.8 |
|
|
B. |
North America |
10,329.6 |
11,650.1 |
12,617.5 |
12.8 |
8.3 |
|
|
|
1. |
Canada |
571.0 |
654.0 |
702.6 |
14.5 |
7.4 |
|
|
|
2. |
U S A |
9,758.6 |
10,996.2 |
11,914.8 |
12.7 |
8.4 |
|
|
C. |
Asia and Oceania |
1,928.8 |
2,481.4 |
2,613.7 |
28.7 |
5.3 |
|
|
|
Of which: |
|
|
|
|
|
|
|
|
1. |
Australia |
488.0 |
524.6 |
665.6 |
7.5 |
26.9 |
|
|
|
2. |
Japan |
1,343.4 |
1,507.4 |
1,867.7 |
12.2 |
23.9 |
|
|
D. |
Other O E C D Countries |
888.6 |
963.1 |
1,316.3 |
8.4 |
36.7 |
|
|
|
Of which: |
|
|
|
|
|
|
|
|
1. |
Switzerland |
275.9 |
241.7 |
333.6 |
-12.4 |
38.0 |
II. |
O P E C |
8,024.7 |
12,032.2 |
14,859.8 |
49.9 |
23.5 |
|
Of which: |
|
|
|
|
|
|
1. |
Indonesia |
733.8 |
1,013.6 |
930.9 |
38.1 |
-8.2 |
|
2. |
Iran |
580.7 |
977.7 |
1,400.9 |
68.4 |
43.3 |
|
3. |
Iraq |
53.0 |
111.5 |
113.4 |
110.5 |
1.6 |
|
4. |
Kuwait |
294.0 |
351.8 |
361.5 |
19.6 |
2.8 |
|
5. |
Saudi Arabia |
1,025.1 |
1,394.1 |
1,931.2 |
36.0 |
38.5 |
|
6. |
U A E |
4,513.0 |
7,144.5 |
8,853.2 |
58.3 |
23.9 |
III. |
Eastern Europe |
1,109.0 |
1,347.2 |
1,822.5 |
21.5 |
35.3 |
|
Of which: |
|
|
|
|
|
|
1. |
Romania |
46.6 |
70.5 |
160.4 |
51.4 |
127.6 |
|
2. |
Russia |
417.1 |
489.1 |
490.9 |
17.3 |
0.4 |
IV. |
Developing Countries |
22,051.9 |
28,122.6 |
35,330.1 |
27.5 |
25.6 |
|
Of which: |
|
|
|
|
|
|
A. |
Asia |
17,221.1 |
20,754.2 |
25,375.2 |
20.5 |
22.3 |
|
|
a) |
S A A R C |
3,138.8 |
3,678.5 |
4,489.2 |
17.2 |
22.0 |
|
|
|
1. |
Bangladesh |
901.5 |
919.8 |
1,221.4 |
2.0 |
32.8 |
|
|
|
2. |
Bhutan |
58.7 |
27.7 |
45.8 |
- |
65.0 |
|
|
|
3. |
Maldives |
41.8 |
39.4 |
46.7 |
-5.6 |
18.5 |
|
|
|
4. |
Nepal |
482.7 |
546.9 |
668.0 |
13.3 |
22.2 |
|
|
|
5. |
Pakistan |
327.0 |
789.3 |
980.9 |
141.4 |
24.3 |
|
|
|
6. |
Sri Lanka |
1,251.3 |
1,263.4 |
1,390.2 |
1.0 |
10.0 |
|
|
|
7. |
Afghanistan |
75.9 |
91.9 |
136.1 |
21.1 |
48.1 |
|
|
b) |
Other Asian Developing Countries |
14,082.3 |
17,075.7 |
20,886.1 |
21.3 |
22.3 |
|
|
|
Of which: |
|
|
|
|
|
|
|
|
1. |
People's Rep of China |
3,382.3 |
4,015.5 |
4,577.7 |
18.7 |
14.0 |
|
|
|
2. |
Hong Kong |
2,722.6 |
2,633.3 |
3,519.8 |
-3.3 |
33.7 |
|
|
|
3. |
South Korea |
899.8 |
1,267.1 |
1,266.1 |
40.8 |
-0.1 |
|
|
|
4. |
Malaysia |
606.7 |
688.1 |
1,225.5 |
13.4 |
78.1 |
|
|
|
5. |
Singapore |
3,284.2 |
3,846.5 |
3,801.5 |
17.1 |
-1.2 |
|
|
|
6. |
Thailand |
584.5 |
795.4 |
987.1 |
36.1 |
24.1 |
|
B. |
Africa |
3,048.2 |
4,975.0 |
6,885.3 |
63.2 |
38.4 |
|
|
Of which: |
|
|
|
|
|
|
|
1. |
Benin |
56.3 |
82.7 |
129.9 |
46.9 |
57.1 |
|
|
2. |
Egypt Arab Republic |
341.3 |
379.6 |
751.8 |
11.2 |
98.1 |
|
|
3. |
Kenya |
269.9 |
877.1 |
641.5 |
225.0 |
-26.9 |
|
|
4. |
South Africa |
872.2 |
1,365.0 |
1,453.3 |
56.5 |
6.5 |
|
|
5. |
Sudan |
177.4 |
234.8 |
211.0 |
32.4 |
-10.2 |
|
|
6. |
Tanzania |
138.0 |
169.7 |
321.0 |
23.0 |
89.1 |
|
|
7. |
Zambia |
38.5 |
68.0 |
90.0 |
76.8 |
32.3 |
|
C. |
Latin American Countries |
1,782.6 |
2,393.4 |
3,069.6 |
34.3 |
28.3 |
V. |
Others |
57.4 |
61.1 |
75.6 |
6.4 |
23.9 |
VI. |
Unspecified |
95.6 |
69.8 |
221.3 |
-27.0 |
217.2 |
Total Exports |
56,669.2 |
70,951.4 |
86,117.4 |
25.2 |
21.4 |
P - Provisional.
Source- DGCI & S. |
Statement 5 : India's Imports of Principal Commodities |
(US $ million) |
Commodity Group |
April-October |
Percentage Variation |
|
2005-06 |
2006-07 |
2007-08 P |
(3)/(2) |
(4)/(3) |
(1) |
(2) |
(3) |
(4) |
(5) |
(6) |
I. |
Bulk Imports |
34,700.6 |
49,405.1 |
59,937.4 |
42.4 |
21.3 |
|
|
|
(42.1) |
(47.4) |
(45.2) |
|
|
|
A. |
Petroleum, Petroleum Products |
24,392.1 |
35,135.5 |
41,054.3 |
44.0 |
16.8 |
|
|
& Related Material |
(29.6) |
(33.7) |
(30.9) |
|
|
|
B. |
Bulk Consumption Goods |
1,881.5 |
1,964.6 |
2,501.6 |
4.4 |
27.3 |
|
|
1. |
Wheat |
0.0 |
189.3 |
117.3 |
- |
- |
|
|
2. |
Cereals & Cereal Preparations |
16.3 |
21.2 |
21.1 |
29.9 |
-0.2 |
|
|
3. |
Edible Oil |
1,374.5 |
1,359.4 |
1,669.9 |
-1.1 |
22.8 |
|
|
4. |
Pulses |
344.1 |
394.1 |
692.8 |
14.5 |
75.8 |
|
|
5. |
Sugar |
146.6 |
0.6 |
0.5 |
- |
- |
|
C. |
Other Bulk Items |
8,426.9 |
12,304.9 |
16,381.6 |
46.0 |
33.1 |
|
|
1. |
Fertilisers |
1,214.5 |
1,897.7 |
2,940.6 |
56.3 |
55.0 |
|
|
|
a) Crude |
191.7 |
213.6 |
241.8 |
11.4 |
13.2 |
|
|
|
b) Sulphur & Unroasted Iron Pyrites |
85.7 |
61.3 |
126.0 |
-28.5 |
105.5 |
|
|
|
c) Manufactured |
937.1 |
1,622.8 |
2,572.8 |
73.2 |
58.5 |
|
|
2. |
Non-Ferrous Metals |
1,024.7 |
1,473.3 |
1,941.5 |
43.8 |
31.8 |
|
|
3. |
Paper, Paperboard & Mgfd. incl. Newsprint |
555.3 |
750.5 |
827.4 |
35.2 |
10.2 |
|
|
4. |
Crude Rubber, incl. Synthetic & Reclaimed |
265.7 |
337.8 |
430.9 |
27.1 |
27.6 |
|
|
5. |
Pulp & Waste Paper |
345.9 |
362.7 |
436.5 |
4.9 |
20.3 |
|
|
6. |
Metalliferrous Ores & Metal Scrap |
2,183.0 |
4,049.5 |
4,647.8 |
85.5 |
14.8 |
|
|
7. |
Iron & Steel |
2,837.9 |
3,433.3 |
5,156.8 |
21.0 |
50.2 |
II. |
Non-Bulk Imports |
47,670.5 |
54,725.0 |
72,798.0 |
14.8 |
33.0 |
|
|
|
(57.9) |
(52.6) |
(54.8) |
|
|
|
A. |
Capital Goods |
16,928.1 |
23,167.3 |
30,572.3 |
36.9 |
32.0 |
|
|
1. |
Manufactures of Metals |
691.6 |
829.3 |
1,242.0 |
19.9 |
49.8 |
|
|
2. |
Machine Tools |
569.6 |
800.7 |
1,134.5 |
40.6 |
41.7 |
|
|
3. |
Machinery except Electrical & Electronics |
5,380.4 |
7,468.1 |
9,960.8 |
38.8 |
33.4 |
|
|
4. |
Electrical Machinery except Electronics |
811.1 |
1,119.2 |
1,615.3 |
38.0 |
44.3 |
|
|
5. |
Electronic Goods incl. Computer Software |
7,536.2 |
9,732.2 |
12,525.3 |
29.1 |
28.7 |
|
|
6. |
Transport Equipments |
1,479.0 |
2,219.0 |
3,379.1 |
50.0 |
52.3 |
|
|
7. |
Project Goods |
460.1 |
998.8 |
715.4 |
117.1 |
-28.4 |
|
B. |
Mainly Export Related Items |
11,857.5 |
10,390.9 |
12,808.3 |
-12.4 |
23.3 |
|
|
1. |
Pearls, Precious & Semi-Precious Stones |
6,197.0 |
4,254.5 |
5,493.9 |
-31.3 |
29.1 |
|
|
2. |
Chemicals, Organic & Inorganic |
4,120.0 |
4,544.8 |
5,626.1 |
10.3 |
23.8 |
|
|
3. |
Textile Yarn, Fabric, etc. |
1,227.1 |
1,308.7 |
1,427.9 |
6.7 |
9.1 |
|
|
4. |
Cashew Nuts, raw |
313.5 |
282.9 |
260.5 |
-9.8 |
-7.9 |
|
C. |
Others |
18,884.9 |
21,166.9 |
29,417.3 |
12.1 |
39.0 |
|
|
of which : |
|
|
|
|
|
|
|
1. |
Gold & Silver |
7,396.2 |
8,936.2 |
12,572.9 |
20.8 |
40.7 |
|
|
2. |
Artificial Resins & Plastic Materials |
1,374.9 |
1,522.5 |
2,084.5 |
10.7 |
36.9 |
|
|
3. |
Professional Instruments etc. except electrical |
1,114.0 |
1,317.9 |
1,693.3 |
18.3 |
28.5 |
|
|
4. |
Coal, Coke & Briquittes etc. |
2,101.0 |
2,543.4 |
3,455.3 |
21.1 |
35.9 |
|
|
5. |
Medicinal & Pharmaceutical Products |
564.0 |
662.8 |
962.1 |
17.5 |
45.2 |
|
|
6. |
Chemical Materials & Products |
635.4 |
798.8 |
922.0 |
25.7 |
15.4 |
|
|
7. |
Non-Metallic Mineral Manufactures |
359.9 |
444.4 |
572.3 |
23.5 |
28.8 |
Total Imports |
82,371.1 |
104,130.1 |
132,735.4 |
26.4 |
27.5 |
Memo Items |
|
|
|
|
|
|
Non-Oil Imports |
57,979.0 |
68,994.6 |
91,681.1 |
19.0 |
32.9 |
|
Non-Oil Imports excl. Gold & Silver |
50,582.8 |
60,058.5 |
79,108.2 |
18.7 |
31.7 |
|
Mainly Industrial Inputs* |
46,650.2 |
55,153.1 |
72,340.6 |
18.2 |
31.2 |
P : Provisional.
Note 1 : Figures in brackets relate to percentage to total imports for the period
* : Non oil imports net of gold and silver,bulk consumption goods, manufactured fertilizers and professional instruments.
Source : DGCI & S. |
Statement 6 : Direction of India’s Foreign Trade-Imports |
(US $ million) |
Group / Country |
April-October |
Percentage Variation |
|
2005-06 |
2006-07 |
2007-08 P |
(3)/(2) |
(4)/(3) |
1 |
2 |
3 |
4 |
5 |
6 |
I. |
O E C D Countries |
27,569.6 |
33,615.4 |
44,596.3 |
21.9 |
32.7 |
|
|
A. |
|
E U |
12,912.3 |
14,559.6 |
18,678.4 |
12.8 |
28.3 |
|
|
|
|
Of which: |
|
|
|
|
|
|
|
|
|
1. |
Belgium |
2,976.5 |
2,285.8 |
3,065.2 |
-23.2 |
34.1 |
|
|
|
|
2. |
France |
886.1 |
1,198.4 |
1,366.6 |
35.2 |
14.0 |
|
|
|
|
3. |
Germany |
3,286.3 |
4,150.5 |
5,163.3 |
26.3 |
24.4 |
|
|
|
|
4. |
Italy |
1,020.7 |
1,460.7 |
2,070.5 |
43.1 |
41.7 |
|
|
|
|
5. |
Netherland |
620.9 |
624.5 |
922.8 |
0.6 |
47.8 |
|
|
|
|
6. |
U K |
2,387.6 |
2,292.5 |
3,003.5 |
-4.0 |
31.0 |
|
|
B. |
|
North America |
5,118.8 |
6,666.9 |
8,845.7 |
30.2 |
32.7 |
|
|
|
|
1. |
Canada |
559.2 |
731.8 |
1,020.6 |
30.9 |
39.5 |
|
|
|
|
2. |
U S A |
4,559.6 |
5,935.2 |
7,825.0 |
30.2 |
31.8 |
|
|
C. |
|
Asia and Oceania |
5,007.4 |
6,792.3 |
8,769.4 |
35.6 |
29.1 |
|
|
|
|
Of which: |
|
|
|
|
|
|
|
|
|
1. |
Australia |
2,891.9 |
4,099.7 |
5,037.8 |
41.8 |
22.9 |
|
|
|
|
2. |
Japan |
2,016.8 |
2,534.7 |
3,532.0 |
25.7 |
39.3 |
|
|
D. |
|
Other O E C D Countries |
4,531.1 |
5,596.5 |
8,302.8 |
23.5 |
48.4 |
|
|
|
|
Of which: |
|
|
|
|
|
|
|
|
|
1. |
Switzerland |
4,309.5 |
5,274.7 |
6,817.1 |
22.4 |
29.2 |
II. |
O P E C |
6,669.3 |
33,608.2 |
39,784.4 |
403.9 |
18.4 |
|
Of which: |
|
|
|
|
|
|
1. |
Indonesia |
1,733.1 |
2,092.5 |
2,725.3 |
20.7 |
30.2 |
|
2. |
Iran |
430.9 |
4,491.5 |
5,587.9 |
942.4 |
24.4 |
|
3. |
Iraq |
1.2 |
3,517.8 |
3,319.8 |
- |
- |
|
4. |
Kuwait |
231.2 |
3,472.0 |
3,610.8 |
1,401.7 |
4.0 |
|
5. |
Saudi Arabia |
870.8 |
8,491.6 |
9,669.6 |
875.2 |
13.9 |
|
6. |
U A E |
2,864.6 |
4,997.0 |
7,273.3 |
74.4 |
45.6 |
III. |
Eastern Europe |
2,341.3 |
2,405.6 |
2,950.9 |
2.7 |
22.7 |
|
Of which: |
|
|
|
|
|
|
1. |
Romania |
192.6 |
121.3 |
256.9 |
-37.0 |
111.8 |
|
2. |
Russia |
1,260.1 |
1,059.9 |
1,332.2 |
-15.9 |
25.7 |
IV. |
Developing Countries |
21,225.6 |
34,196.1 |
44,987.3 |
61.1 |
31.6 |
|
Of which: |
|
|
|
|
|
|
A. |
Asia |
16,963.9 |
27,151.5 |
35,669.1 |
60.1 |
31.4 |
|
|
a) |
S A A R C |
778.9 |
889.5 |
960.4 |
14.2 |
8.0 |
|
|
|
|
1. |
Bangladesh |
59.3 |
139.4 |
148.0 |
135.1 |
6.1 |
|
|
|
|
2. |
Bhutan |
39.2 |
67.7 |
116.9 |
72.8 |
72.6 |
|
|
|
|
3. |
Maldives |
1.0 |
1.9 |
2.3 |
- |
- |
|
|
|
|
4. |
Nepal |
221.5 |
162.1 |
220.3 |
-26.8 |
35.9 |
|
|
|
|
5. |
Pakistan |
100.6 |
192.5 |
149.4 |
91.4 |
-22.4 |
|
|
|
|
6. |
Sri Lanka |
327.3 |
297.7 |
277.2 |
-9.1 |
-6.9 |
|
|
|
|
7. |
Afghanistan |
30.0 |
28.1 |
46.4 |
-6.3 |
64.8 |
|
|
b) |
|
Other Asian Developing Countries |
16,185.0 |
26,262.0 |
34,708.7 |
62.3 |
32.2 |
|
|
|
|
Of which: |
|
|
|
|
|
|
|
|
|
1. |
People's Rep of China |
5,990.3 |
9,471.6 |
15,309.5 |
58.1 |
61.6 |
|
|
|
|
2. |
Hong Kong |
1,296.2 |
1,425.9 |
1,608.8 |
10.0 |
12.8 |
|
|
|
|
3. |
South Korea |
2,483.2 |
2,816.9 |
3,227.7 |
13.4 |
14.6 |
|
|
|
|
4. |
Malaysia |
1,388.8 |
3,186.0 |
3,430.7 |
129.4 |
7.7 |
|
|
|
|
5. |
Singapore |
1,789.8 |
3,208.1 |
4,179.8 |
79.3 |
30.3 |
|
|
|
|
6. |
Thailand |
711.3 |
953.6 |
1,390.1 |
34.1 |
45.8 |
|
B. |
Africa |
2,806.1 |
4,280.3 |
6,090.2 |
52.5 |
42.3 |
|
|
Of which: |
|
|
|
|
|
|
|
1. |
|
Benin |
65.9 |
64.5 |
57.3 |
-2.1 |
-11.1 |
|
|
2. |
|
Egypt Arab Republic |
163.2 |
1,106.9 |
1,135.6 |
578.2 |
2.6 |
|
|
3. |
|
Kenya |
29.0 |
33.3 |
50.4 |
14.8 |
51.5 |
|
|
4. |
|
South Africa |
1,501.5 |
1,638.9 |
2,349.3 |
9.2 |
43.3 |
|
|
5. |
|
Sudan |
19.3 |
48.9 |
150.3 |
152.6 |
207.4 |
|
|
6. |
|
Tanzania |
32.4 |
24.6 |
38.9 |
-24.1 |
58.1 |
|
|
7. |
|
Zambia |
21.7 |
71.4 |
60.8 |
- |
-14.8 |
|
C. |
Latin American Countries |
1,455.6 |
2,764.3 |
3,228.0 |
89.9 |
16.8 |
V. |
Others |
17.8 |
35.3 |
45.4 |
98.2 |
28.6 |
VI. |
Unspecified |
24,547.4 |
269.5 |
371.2 |
-98.9 |
37.7 |
Total Imports |
82,371.1 |
104,130.1 |
132,735.4 |
26.4 |
27.5 |
P : Provisional.
Source : DGCI & S.
Note :
1. The figures for 2006-07, which include country-wise distribution of petroleum imports, are not strictly comparable with the data for previous years. |
* Prepared in the Division of International Trade, Department of Economic Analysis and Policy, Reserve Bank of India. Previous issue of the article was published in RBI Bulletin, February 2008. |


