The article presents analysis of international liabilities and assets of banks in India, classified under Locational Banking Statistics (LBS) and consolidated international/foreign claims under Consolidated Banking Statistics (CBS), collected as per the reporting system of the Bank for International Settlements (BIS), for the quarters ended March and June 2008. These data are compared with those as at the end of the previous quarters and a year ago. The analysis of international liabilities/ assets, based on LBS, has been undertaken by instrument, country and sector of customer/borrower, currency and country of incorporation of reporting bank; and the consolidated international claims, based on CBS, according to country and sector of borrower and residual maturity. Further, a broad comparison of international/foreign claims of BIS reporting banks vis-à-vis Indian Banks at the end of March and June 2007 has also been covered. Besides, the article details international/foreign claims derived from on- balance sheet items, viz., loans and deposits, holdings of securities as well as off- balance sheet items, viz., derivatives, guarantees and credit commitments on ultimate risk basis. * Prepared in the Banking Statistics Division of the Department of Statistics and Information Management. The previous article on the subject as at end-December 2007 was published in October 2008 issue of the Bulletin. Highlights
International Liabilities •The annual growth in the international liabilities, of banks in India (in Rupees), as at end-June 2008 was 9.5 per cent compared to a growth rate of 12.1 per cent a year ago.
• The international liabilities of banks in India (in Rupees), as at end-June 2008 increased by 0.8 per cent over the previous quarter •The components contributing to the annual growth of the international liabilities are Foreign Currency Borrowings, VOSTRO, NRO, FIIs and capital / remittable profits of foreign banks in India
• The relative significance of ‘Deposits and Loans’, in terms of share in international liabilities, was at 77.3 per cent as at end-June 2008 as compared to 74.0 per cent as at end-March 2008 and 73.4 per cent a year ago.
• The share of international liabilities towards non-bank sector as at end-June 2008 declined to 69.1 per cent from 76.2 per cent as at end-June 2007.
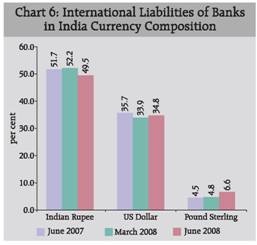
• Composition of currency revealed that international liabilities, as at end of June 2008 in Indian Rupee had the major share (49.5 per cent), followed by the US dollar (34.8 per cent) and Pound Sterling (6.6 per cent).
• The share of international liabilities of Indian banks denominated in Indian Rupees, as at end of June 2008, declined to 49.5 per cent from 52.2 per cent as at end of March 2008.
• 51.1 per cent of FCNR(B) deposits emanated from three countries, viz., the USA, the UK and UAE and 71.6 per cent of total foreign currency borrowings were from the UK, the USA, Singapore and India.
• The share of international liabilities towards the USA declined to 24.7 percent as at end of June 2008 from 27.5 per cent as at end of March 2008. International Assets
• The year-on-year growth rate of international assets (measured in Rupees) of banks in India was low at 5.8 per cent as at end-June 2008 as compared to 27.8 per cent recorded during the same period in the previous year.
• The international assets, as at the end of June 2008, however, registered a decline of 6.4 per cent over its position in the previous quarter.
• On annual basis, the major component ‘Loans and Deposits’ registered an increase of 7.1 per cent, as at the end-June 2008 while other major components viz. ‘Holding of Debt Securities’ and ‘Other International Assets’ declined by 81.2 per cent and 3.3 per cent, respectively, during the same period.
• The share of the non-bank sector in the international assets increased to 72.3 per cent as at end-June 2008 from 56.4 per cent a year ago.
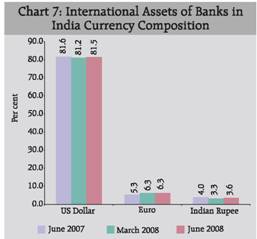
• The US dollar denominated assets continued to account for the maximum share (81.5 per cent), followed by Euro (6.3 per cent), Indian Rupee (3.6 per cent), and Pound Sterling (2.9 per cent).
• The share of international assets in terms of foreign currency loans in India was 51.3 per cent as at end of June 2008. The 99.5 per cent claims on India comprise of the Foreign Currency Loans to Residents. Consolidated Banking Statistics
• The consolidated international claims (measured in Rupees) of banks as at end-June 2008 based on immediate risk, year-on-year basis, showed a growth of 8.4 per cent as compared to 59.5 per cent during the same period in the previous year.
• Consolidated international claims of Indian banks on immediate risk basis were mostly of short-term nature (less than one year) and accounted for 66.4 per cent of total claims as at end-June 2008 compared to 71.6 per cent a year ago.
• International claims of banks in the BIS reporting countries on India stood at US $ 147 billion as at end-June 2008, showing an increase of 38.3 per cent over the position a year ago, whereas the international claims of Indian Banks on other countries (i.e., India’s asset) stood at US $ 39.9 billion as at end-June 2008, which were higher by US $ 3.3 billion over the position a year ago. I. Introduction
International Banking Statistics (IBS) is defined as banks’ on-balance sheet liabilities and assets vis-à-vis non-residents in any currency or unit of account along with such liabilities and assets vis-à-vis residents in foreign currencies or units of account. IBS comprises of Locational Banking Statistics (LBS) and Consolidated Banking Statistics (CBS). The LBS are designed to provide comprehensive and consistent quarterly data on international banking business conducted in the Bank for International Settlements (BIS) reporting area. The purpose of CBS is to provide comprehensive and consistent quarterly data on banks’ financial claims on other countries, on immediate borrower basis for providing a measure of country transfer risk and on an ultimate risk basis for assessing country risk exposures of national banking system. LBS provides the assets and liabilities by instrument/ components, currency, sector, country of residence of counter-party / transacting unit and nationality of reporting banks, while CBS provides data on international claims as per residual maturity and sector of borrower along with the exposures by country of immediate borrower and on the reallocation of claims (i.e. risk transfers) to the country of ultimate risk. The BIS reporting system of IBS was revised since March 2005, inter alia, covering the claims of domestic reporting banks arising from derivatives, guarantees and credit commitments.
Other than India, central banks from 40 other countries report aggregate LBS to BIS while central banks from 30 countries report aggregate CBS under the BIS reporting system of IBS. The data are published as part of the BIS Quarterly Review. This article presents brief analysis of the LBS as well as CBS for India for the two quarters ending March and June 2008. It also includes a section on comparative position of CBS of India vis-à-vis other countries based on data published by BIS1. 1A brief outline of the BIS reporting system of IBS comprising LBS and CBS, purpose of IBS, BIS reporting area for IBS, the distinction / relation between IBS vis-à-vis external debt of India has been provided in the article published in October 2008 issue of the RBI Bulletin. II. Data Coverage and Methodology2
The analysis is based on the data as on March 31 and June 30, 2008 reported by 86 banks. These banks are authorized to conduct business in foreign exchange through their branches, designated as authorized dealers. These banks include 58 Indian banks and 28 foreign banks (incorporated in 20 countries). Out of the 58 Indian banks, 28 are public sector banks (including IDBI Ltd.), 20 are private sector banks and 10 are co-operative banks. The banks received data from the branches, which in turn are consolidated at bank level and submitted to the RBI. The details such as asset / liability, actual currency (24 major currencies and domestic currency), country of transacting unit, sector of the transacting unit, country of ultimate risk, sector of ultimate risk, etc., are reported.
III. Comparison of External Debt Statistics and International Liabilities
The international liabilities of banks covered in IBS (as per BIS definition) and external debt accounted for by banking sector in India are not strictly comparable, since certain items of liabilities, like, American Depositary Receipts (ADRs), Global Depositary Receipts (GDRs), equity of banks held by non-residents, included in IBS, are not a part of the external debt statistics. It may be broadly construed that International Liabilities of banking sector in India (under IBS reporting) are the sum of External Debt Statistics (for banking system in India), Liabilities of banks in foreign currency towards residents (EEFC, RFC, Intra-bank FC Deposits), Equities of banks held by NRIs, non-debt credit flows on account of ADRs/ GDRs, Capital supplied by head offices of foreign banks in India, Rupee and ACU Dollar balance in VOSTRO and Outstanding amounts of NRNR deposits.
Table 1 presents a classification of the international liabilities as at end of March and June 2008 covered under IBS, in US dollar terms, into items included and not included under external debt statistics.
IV. Results
IV.1 Locational Banking Statistics
The LBS provides component/ instrument wise, country-wise (residence of transacting unit and the country of incorporation of reporting bank), sector-wise, major currency-wise classification of liabilities and claims of banks in India. Data presented in this section are based on data reported by branches of banks, which are conducting business in India, viz. the branches of Indian banks and branches of foreign banks in India.
IV.1 A International Liabilities and Assets –Aggregate Level
As at end-June 2008, the international liabilities of the banks in India registered a marginal increase over the previous quarter while the international assets declined from the previous quarter, and the international liabilities of banks continued 2The methodology of compilation of LBS/CBS and explanation to various terms used in IBS has been provided in the article on the subject published in October 2008.
Table 1 : International Liabilities of Banks in India |
(US $ million) |
Categories /Items |
Amount Outstanding as at end |
March 2007 |
June 2007 |
September 2007 |
December 2007 |
March 2008 |
June 2008 |
I. Items included under External Debt Statistics + |
59719 |
61,610 |
65,380 |
65,110 |
67,873 |
66,847 |
| |
1. |
Foreign Currency Non-Resident Bank [FCNR(B)] Schemes |
15663 |
16,173 |
16,238 |
15,522 |
15,040 |
14,577 |
| |
2. |
Non-Resident External (NRE) Rupee A/Cs |
25974 |
27,017 |
27,719 |
27,756 |
27,742 |
26,563 |
| |
3. |
Foreign Currency Borrowings (includes Inter-bank borrowings and external commercial borrowings of banks) other than through ADRs, GDRs, Bonds, etc. |
14141 |
14,657 |
15,865 |
15,927 |
19,256 |
21,097 |
| |
4. |
Bonds |
2003 |
2,067 |
1,997 |
1,971 |
1,989 |
1,934 |
| |
5. |
Floating Rate Notes (FRNs) |
|
- |
|
|
- |
- |
| |
6. |
Foreign Institutional Investors’ (FII) A/Cs |
1633 |
1,391 |
3,255 |
3,630 |
3,562 |
2,441 |
| |
7. |
Other Own issues of Intl. Debt Securities |
306 |
304 |
306 |
304 |
284 |
235 |
II. |
Items not included under External Debt Statistics |
1626 |
2,019 |
2,222 |
2,429 |
2,865 |
2,456 |
| |
1. |
Embassy A/Cs |
48 |
54 |
39 |
24 |
24 |
53 |
| |
2. |
ESCROW A/Cs |
1 |
0 |
0 |
3 |
3 |
1 |
| |
3. |
Non-Resident Ordinary(NRO) Rupee Deposits |
1577 |
1,964 |
2,182 |
2,402 |
2,838 |
2,402 |
III. |
Non-Debt Liabilities (not included in External Debt due to definitional aspects) |
18233 |
21,107 |
27,330 |
30,764 |
23,013 |
18,561 |
| |
1. |
American Depository Receipts (ADRs) and Global Depository Receipts (GDRs) |
5409 |
5,744 |
8,708 |
10,588 |
6,259 |
4,615 |
| |
2. |
Equities of banks held by NRIs |
9277 |
11,444 |
14,301 |
15,530 |
11,367 |
7,991 |
| |
3. |
Capital of foreign banks/branches in India and certain other items in transition |
3546 |
3,919 |
4,321 |
4,646 |
5,388 |
5,955 |
IV. |
FC Liabilities to Residents (not included in External Debt due to definitional aspects) + |
3086 |
3,257 |
3,322 |
3,383 |
3,288 |
3,208 |
| |
1. |
Exchange Earners’ Foreign Currency (EEFC) A/Cs |
2163 |
2,314 |
2,402 |
2,422 |
2,501 |
2,532 |
| |
2. |
Resident Foreign Currency (RFC) Deposits |
376 |
355 |
322 |
398 |
354 |
278 |
| |
3. |
Inter-Bank Foreign Currency Deposits and other Foreign Currency Deposits of Residents |
548 |
589 |
598 |
563 |
433 |
398 |
V. |
Other Items of International Liabilities (not included in External Debt due to definitional aspects) |
313 |
365 |
333 |
368 |
370 |
434 |
| |
1. |
Balances in VOSTRO A/Cs of non-resident banks and exchange houses (including term deposits) |
313 |
365 |
333 |
368 |
370 |
434 |
VI. |
Total International Liabilities (I+II+III+IV+V) |
82,976 |
88,358 |
98,587 |
102,067 |
97,422 |
91,514 |
+: Data as reported under IBS do not cover all branches and are not comparable with data reported by all bank branches under a different set of data.
Notes : 1 . All figures are inclusive of accrued interest.
2. The FEDAI revaluation rate for Rupee-US Dollar exchange as at end-March 2007, June 2007, September 2007, December 2007, March 2008 and June 2008 were Rs. 43.47, Rs.40.705, Rs.39.61, Rs.39.415, Rs. 40.12 and Rs.43.035 per US Dollar, respectively.
3 . Data have been revised for previous quarters. |
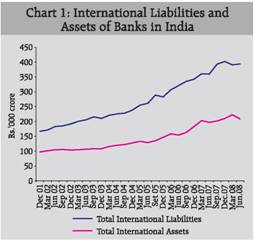
to be at a level almost double than the international assets (Chart 1). The international liabilities of banks increased by Rs. 2,975 crore (0.8 per cent) as at the end-June 2008 over the position in the previous quarter and increased by Rs. 34,169 crore (9.5 per cent) over a year ago (Statement I). As end June 2008, the international assets declined by Rs. 14,195 crore (-6.4 per cent) over the position in the previous quarter while the international assets grew by 5.8 per cent, over the previous year. IV. 1. B Components and composition of International Liabilities
The increase in the international liabilities during the period under reference can be attributed to the rise in its major component ‘deposits and loans’. The ‘deposit and loans’ recorded a growth of 15.3 per cent over end-June 2007 level while the other components viz. ‘other international liabilities’ and ‘own issues of international securities’ experienced a decline of 2.9 per cent and 7.0 per cent, respectively. On the annual basis, as at end-June 2008, the components, Foreign Currency borrowings, VOSTRO balances, NRO, FIIs, ESCROW and capital/ remittable profits of foreign banks in India showed a substantial growth whereas other components such as equities of banks held by non-residents, ADRs/GDRs, RFCs, Other FC deposits, etc. declined.
Major component-wise international liabilities of banks in India as at end-June 2008 are presented in Chart 2. The percentage share of ‘deposits and loans’ to the total international liabilities increased
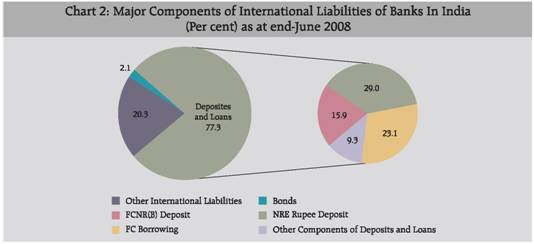
to 77.3 per cent as end-June 2008 from 67.6 per cent as end-December 2007. Correspondingly, the share of ‘Other International Liabilities’ decreased to 20.3 per cent as at end-June 2008 from 30.1 per cent as at end December 2007.
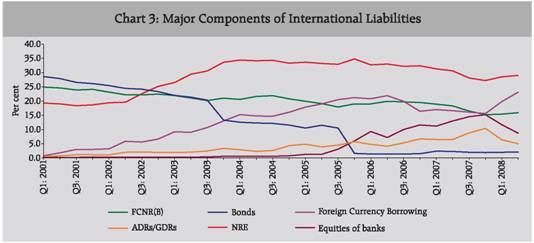
The share of FCNR(B) to the total international liabilities is seen to be declining since quarter ending June 2007 while that of equities has declined sharply during the last two quarters. The share of foreign currency borrowings, which includes inter-bank deposits, has gone up to 23.1 per cent as at end-June 2008 from 15.6 per cent as at end-December 2007.
IV.1.C Components and composition of International Assets
The decline in the international assets over the previous quarter was spread over the three major components. The three major components viz. ‘Loans and Deposits’, ‘Holdings of Debt Securities’ and ‘Other International Assets’ registered a decline of 6.5 per cent, 14.1 per cent and 2.9 per cent, respectively. Each of the components Loans to Non-residents, FC loans to Residents and Outstanding Export Bills declined in the quarter ended June 2008 over the previous quarter as against an increase in the quarter ended March 2008. On the other hand, the Investment in Foreign Government Securities increased as at end-June 2008 over the previous quarter whereas it was declining for last 4 quarters since the quarter ended June 2007. On the annual basis, the ‘Loans and Deposits’ only had positive growth rate of 7.1 per cent while other two components registered a decline.
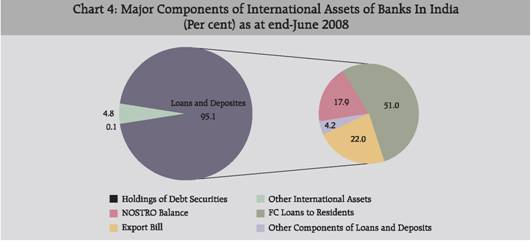
The composition of the international assets in terms of the shares by the three major components in the total international assets remained more or less same as on end-March 2008 and end-June 2008 [Statement I] as compared to the position in the previous year. The share of the component ‘FC Loans to Residents’ increased to 51.0 per cent as at end-June 2008 from 36.9 per cent a year ago while the share of NOSTRO balances declined to 17.9 per cent from 33.8 per cent during the period. IV.1.D Composition of Liabilities and Assets by Sector and Currency
The share of the international liabilities towards non-bank sector as end-June 2008 declined to 69.1 per cent from 73.0 per cent as at end-March 2008 as compared with the share of 76.2 per cent as at end-March and June 2007 [Statement II]. In terms of the currency composition of the international liabilities, as at end-June 2008, the share of liabilities denominated in Indian Rupee accounted for the maximum share (49.5 per cent) followed by US Dollar (34.8 per cent) and Pound Sterling (6.6 per cent). The share denominated in the Indian Rupee witnessed a decline from the previous quarter while the share denominated in Pound Sterling increased over the previous quarter.
The sector and currency wise composition of total international liabilities as at end of June 2008 showed that 86.3 per cent of liabilities denominated in Indian Rupees are towards non-bank sector, while 76.6 per cent and 65.9 per cent liabilities denominated in Euro and Pound Sterling are towards non-bank sector, respectively.
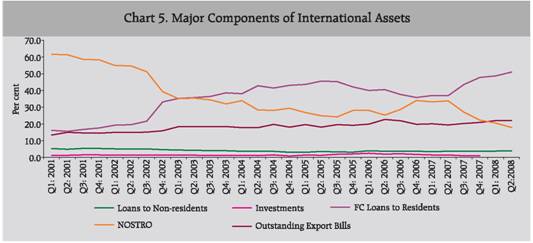
Table 2: International Liabilities and Assets of Banks in India (branches of Indian and Foreign Banks in India) |
(in Rs. crore) |
Items |
Amount Outstanding # as at end |
March 2007 |
June 2007 |
September 2007 |
December 2007 |
March 2008 |
June 2008 |
International Liabilities |
|
|
|
|
|
|
Liabilities to residents and non-residents denominated in foreign currencies |
178,700 |
173,580 |
186,763 |
190,137 |
187,007 |
198,767 |
(49.5) |
(48.3) |
(47.5) |
(47.3) |
(47.8) |
(50.5) |
Liabilities to non-residents denominated in Indian Rupees |
181,998 |
186,083 |
206,058 |
212,160 |
203,850 |
195,065 |
(50.5) |
(51.7) |
(52.5) |
(52.7) |
(52.2) |
(49.5) |
Total International Liabilities + |
360,698 |
359,663 |
392,821 |
402,297 |
390,857 |
393,832 |
(100.0) |
(100.0) |
(100.0) |
(100.0) |
(100.0) |
(100.0) |
International Assets |
|
|
|
|
|
|
Foreign Currency(FC) Assets (includes FC loans to residents and non-residents, Outstanding Export Bills, FC lending to banks in India, FC deposits with banks in India, Overseas FC Assets, Remittable profits of foreign branches of Indian banks, etc.) |
194,965 |
189,187 |
193,320 |
202,469 |
215,357 |
200,975 |
(96.1) |
(96.0) |
(95.9) |
(96.4) |
(96.7) |
(96.4) |
Assets in Indian Rupees with Non-residents (includes Rupee loans to non-residents out of non-resident deposits) |
8,008 |
7,835 |
8,229 |
7,468 |
7,354 |
7,541 |
(3.9) |
(4.0) |
(4.1) |
(3.6) |
(3.3) |
(3.6) |
Total International Assets |
202,973 |
197,022 |
201,549 |
209,937 |
222,711 |
208,516 |
| |
(100.0) |
(100.0) |
(100.0) |
(100.0) |
(100.0) |
(100.0) |
# : Data pertain to only reporting branches. As such, these data provide broad dimensions of international assets and liabilities,
Notes: 1. All figures are inclusive of accrued interest.
2. Figures in brackets represent percentages to total international assets
3. Sum of the components may not tally with total due to rounding off .
4. Data have been revised for previous quarters. |
The share of non-bank sector in the international assets increased to 72.3 per cent as end-June 2008 from 70.2 per cent in the previous quarter and 56.4 per cent a year ago (Statement II). With regard to currency composition of international assets for all sectors as at end-June 2008, the assets denominated in US Dollar continued to account for the highest share (81.5 per cent), followed distantly by Euro (6.3 per cent), Indian Rupee (3.6 per cent) and Pound Sterling (2.9 per cent) (Chart 7).
Sector-wise classification of total assets showed that as at end of June 2008 the non-bank sector accounted for 72.3 per cent of total assets, while this sector accounted for 99.7 per cent of the assets denominated in Indian Rupees.
IV.1.E Composition by Country of Residence of Transaction Units
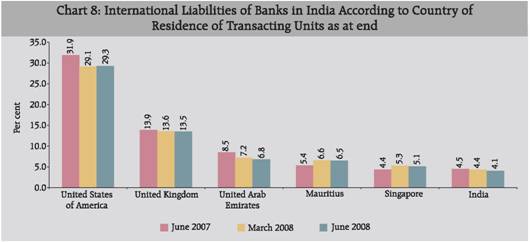
Statement III presents the classification of liabilities and assets according to country of residence of transacting unit denominated in all and foreign currencies. About 62.4 per cent of total international liabilities of banks were towards the transacting units (bank and non-bank sectors) of six countries, viz., the USA (24.7 per cent), the UK (16.5 per cent), UAE (7.0 per cent), India (5.5 per cent), Singapore (4.8 per cent) and Mauritius (3.9 per cent) as at end-June 2008 [Chart 8]. The share of international liabilities towards the USA had a decreasing trend since March 2007. As at the end of June 2008, the share towards India and UAE increased while the share towards Mauritius declined as compared with the quarter ending March 2008.
It is observed that 51.1 per cent of FCNR(B) deposits, as at end-June 2008, emanated from residents of the three countries, viz., the USA (16.6 per cent), the UK (23.9 per cent) and Germany (10.6 per cent); 71.6 per cent of total foreign currency borrowings originated from the entities in the four countries, viz., the UK (29.7 per cent), the USA (22.1 per cent), Singapore (10.3 per cent) and India (9.5 per cent) (Statement IV).
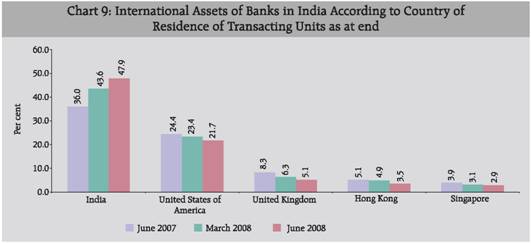
As regards international assets of banks as at end-June 2008, 82.7 per cent of total international assets were concentrated in the five countries, viz., India (51.3 per cent), the USA (19.9 per cent), the UK (5.3 per cent), Hong Kong (3.5 per cent) and UAE (2.7 per cent) (Chart 9, Statement III and IV).
IV.1.F Composition by Country of Incorporation of Reporting Bank
The classification of international liabilities of banks according to their country of incorporation is presented in Statement VI. Among the banks incorporated in countries other than India, Hong Kong had the highest share in international liabilities at 6.0 per cent while those from Netherlands, the USA and the UK had shares ranging between 3.2 per cent to 5.9 per cent. The Indian Banks accounted for the highest share at 74.4 per cent as at end-June 2008 as against a share of 81.5 per cent as at end-June 2007.
The share of the Indian banks in the international assets declined to 72.2 per cent as at end-June 2008 from 79.6 per cent registered a year ago. The shares of the banks incorporated in the UK registered an increase to 7.9 per cent from 3.5 per cent during same the period. [Statement VI].
IV.2 Consolidated Banking Statistics (CBS)
The CBS provides country-wise (immediate country risk exposure), residual-maturity-wise and sector-wise classification of international claims (on-balance-sheet) of banks on countries other than India. It also provides consolidated country risk exposure on an ultimate risk basis and international claims arising from derivatives, guarantees and credit commitments. The consolidated banking statistics is generated in three reports viz. (b) for domestic banks, (c) for inside (reporting) area foreign banks and (d) for outside (reporting) area foreign banks and the report (a) as the sum of the three reports viz. (b), (c) and (d). The data presented in this section and Statement VII is based on data reported by all branches functioning in India as well as foreign branches of Indian banks viz. based on report (a) mentioned before and no separate discussion is done on other three reports.
IV.2. A Overall Exposure/Claims on Immediate Risk Basis
Consolidated international claims of banks, based on immediate risk basis, on countries other than India as at end-June 2008, recorded an increase of Rs. 2,249 crore (1.3 per cent) to Rs.1,71,730 crore over the previous quarter and an increase of Rs. 13,348 crore (8.4 per cent) over the position a year ago (Statement VII). IV.2.B Composition by Country of Residence of Transacting Unit – Immediate Risk
Consolidated international claims of banks, classified according to country of immediate risk revealed that as at end of June 2008 reporting banks’ claims on the USA accounted for the largest share (21.8 per cent), followed by the UK (13.2 per cent), Singapore (6.8 per cent) and Germany (6.0 per cent) as at end-June 2008 (Chart 10 and Table 3).
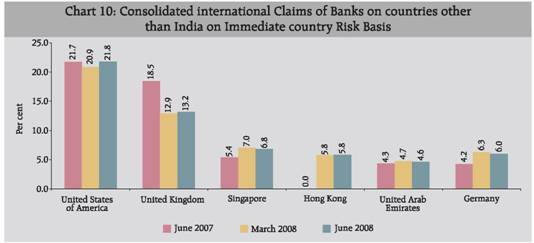
Table 3: Consolidated International Claims of Indian Banks on Countries other than India on Immediate Country Risk Basis |
Country |
Amount (Rs. Crore) Outstanding as at end |
March 2007 |
June 2007 |
September 2007 |
December 2007 |
March 2008 |
June 2008 |
Total Consolidated International Claims (excluding claims on India) |
149,258 |
158,382 |
157,201 |
153,353 |
169,481 |
171,730 |
(100.0) |
(100.0) |
(100.0) |
(100.0) |
(100.0) |
(100.0) |
of which: |
|
|
|
|
|
|
United States of America # |
32,875 |
34,396 |
33,147 |
33,114 |
35,374 |
37,447 |
| |
(22.0) |
(21.7) |
(21.1) |
(21.6) |
(20.9) |
(21.8) |
United Kingdom@ |
22,598 |
29,257 |
30,584 |
24,987 |
21,899 |
22,662 |
| |
(15.1) |
(18.5) |
(19.5) |
(16.3) |
(12.9) |
(13.2) |
Singapore |
8,921 |
8,514 |
10,561 |
11,749 |
11,918 |
11714 |
| |
(6.0) |
(5.4) |
(6.7) |
(7.7) |
(7.0) |
(6.8) |
Hong Kong |
8,977 |
11,066 |
11,477 |
10,487 |
9,792 |
9,978 |
| |
(6.0) |
(7.0) |
(7.3) |
(6.8) |
(5.8) |
(5.8) |
United Arab Emirates |
6,686 |
6,889 |
6,773 |
7,467 |
7,990 |
7,977 |
| |
(4.5) |
(4.3) |
(4.3) |
(4.9) |
(4.7) |
(4.6) |
Germany |
7,234 |
6,721 |
6,886 |
6,896 |
10,607 |
10,300 |
| |
(4.8) |
(4.2) |
(4.4) |
(4.5) |
(6.3) |
(6.0) |
@ : excluding Guernsey, Isle of Man and Jersey, #: includes Miday Island and Wake Islands.
Note: 1. Figures in brackets represent percentages to the total international claims.
2. Data have been revised for previous quarters. |
IV.2.C Composition by Sector -Immediate Risk Basis
Sectoral classification of consolidated international claims of banks on other countries, on immediate country risk basis is presented in Statement VII. The share of banking sector declined by 9.6 percentage points as at end-June 2008 to 37.9 per cent from 47.5 per cent witnessed a year ago with a corresponding increase in the share of ‘non-bank private’ sector. The sector-wise composition of consolidated international claims on the countries the UK and the USA has undergone a shift since June 2007. The shares of the banking sector against the two countries at 51.2 per cent and 42.9 per cent, respectively, as at end-June 2007 declined to 44.5 per cent and 34.6 per cent, respectively, as at end-June 2008 while corresponding share of non-bank private sector increased to 55.4 per cent and 64.6 per cent, respectively, as at end-June 2008 from 48.7 per cent and 55.4 per cent, respectively, a year ago. The other countries witnessing similar movements are Australia, Canada, France, Germany, and Hong Kong which together accounted for 18.1 per cent of total consolidated claims as at end-June 2008.
IV.2.D Composition by Residual Maturity- Immediate risk basis
The reporting banks continued to prefer short-term lending/investment as evidenced from the data as at end-June 2008. However, the share of the long-term claims to the total international claims has increased to 32.3 per cent from 28.4 per cent a year ago. The details of consolidated international claims of banks according to residual maturity and country of immediate risk are provided in Statement VII.
IV.2.E Exposure/Claims on Ultimate Risk Basis
Consolidated foreign claims (international claims of Indian banks plus local claims in local currency of foreign offices of Indian banks) of domestic banks on ultimate risk basis declined from Rs. 1,65,181 crore as at end-March 2008 to Rs. 1,63,958 crore as at end-June 2008 (Table 4). Consolidated foreign claims of Indian banks against the USA and the UK declined since March 2007 till end-June 2008 while those against Canada increased marginally during the period (Table 4).
The consolidated claims/exposure of Indian banks, on countries other than India, arising out of derivatives declined to Rs. 16,926 crore as at end-June 2008 from Rs. 21,311 crore in the previous quarter. The share of claims, arising from derivatives against the USA and Germany to the total, registered an increase since March 2007. The claims, arising out of guarantees registered an increase as at end-June 2008 over the previous quarter. The exposure against the USA has seen a decline over a period since March 2007.The consolidated claims of India, on countries other than India, arising out of credit commitments has witnessed a huge increase as at end-March 2008 over the previous quarter. The increase can be attributed to the exposure towards the USA.
Table 4 : Consolidated Foreign Claims and Contingent Claims/Exposures arising from Derivatives, Guarantees and Credit Commitments of Domestic Banks on Ultimate Risk Basis |
(Rs. crore) |
Total Foreign Claims |
Contingent Claims/Exposures Arising from Guarantees |
Country of Ultimate Risk |
Consolidated Claims as at end |
Country of Ultimate Risk |
Consolidated Claims as at end |
Mar. 2007 |
Jun. 2007 |
Dec. Mar. 2007 2008 |
Jun. 2008 |
Mar. 2007 |
Jun. 2007 |
Dec. 2007 |
Mar. 2008 |
Jun. 2008 |
Total |
146,986 |
149,167 |
146,733 |
165,181 |
163,958 |
Total |
14,097 |
16,988 |
27,191 |
26,818 |
37607 |
of which: |
(100.0) |
(100.0) |
(100.0) |
(100.0) |
(100.0) |
of which: |
(100.0) |
(100.0) |
(100.0) |
(100.0) |
(100.0) |
United States of |
32,447 |
33,686 |
30570 |
31951 |
30128 |
United States of |
3,527 |
5,118 |
6994 |
3982 |
3665 |
America # |
(22.1) |
(22.6) |
(20.8) |
(19.3) |
(18.4) |
America # |
(25.0) |
(30.1) |
(25.7) |
(14.8) |
(9.7) |
United Kingdom @ |
19,203 |
23,954 |
18768 |
18170 |
19538 |
France |
448 |
224 |
2565 |
1985 |
2242 |
| |
(13.1) |
(16.1) |
(12.8) |
(11.0) |
(11.9) |
|
(3.2) |
(1.3) |
(9.4) |
(7.4) |
(6.0) |
Singapore |
9,457 |
9,061 |
12071 |
12340 |
12177 |
China |
1715 |
1642 |
2041 |
2041 |
2317 |
| |
(6.4) |
(6.1) |
(8.2) |
(7.5) |
(7.4) |
|
(12.2) |
(9.7) |
(7.5) |
(7.6) |
(6.2) |
Canada |
6,842 |
5137 |
8155 |
8984 |
10972 |
Singapore |
566 |
456 |
1848 |
2517 |
1895 |
| |
(4.7) |
(3.4) |
(5.6) |
(5.4) |
(6.7) |
|
(4.0) |
(2.7) |
(6.8) |
(9.4) |
(5.0) |
Hong Kong |
4,577 |
4404 |
7482 |
8341 |
6416 |
Germany |
906 |
1482 |
1834 |
2559 |
3009 |
| |
(3.1) |
(3.0) |
(5.1) |
(5.0) |
(3.9) |
|
(6.4) |
(8.7) |
(6.7) |
(9.5) |
(8.0) |
Contingent Claims/Exposures Arising from Derivatives |
Contingent Claims/Exposures Arising from Credit Commitments |
Country of Ultimate Risk |
Consolidated Claims as at end |
Country of Ultimate Risk |
Consolidated Claims as at end |
Mar. 2007 |
Jun. 2007 |
Dec. 2007 |
Mar. 2008 |
Jun. 2008 |
Mar. 2007 |
Jun. 2007 |
Dec. 2007 |
Mar. 2008 |
Jun. 2008 |
Total |
12,787 |
13,999 |
14,595 |
21,311 |
16,926 |
Total |
1,282 |
1,468 |
2083 |
7333 |
7155 |
of which: |
(100.0) |
(100.0) |
(100.0) |
(100.0) |
(100.0) |
of which: |
(100.0) |
(100.0) |
(100.0) |
(100.0) |
(100.0) |
United Kingdom @ |
2,301 |
3,080 |
3411 |
4830 |
3921 |
Bangladesh |
0 |
15 |
863 |
943 |
652 |
| |
(18.0) |
(22.0) |
(23.4) |
(22.7) |
(23.2) |
|
(0.0) |
(1.0) |
(41.4) |
(12.9) |
(9.1) |
United States of |
1634 |
2,116 |
2967 |
3452 |
2716 |
United Arab Emirates |
3 |
57 |
256 |
230 |
11 |
America # |
(12.8) |
(15.1) |
(20.3) |
(16.2) |
(16.0) |
|
(0.2) |
(3.9) |
(12.3) |
(3.1) |
(0.2) |
Germany |
679 |
959 |
2296 |
2316 |
1482 |
United States of |
680 |
774 |
248 |
2975 |
4870 |
| |
(5.3) |
(6.9) |
(15.7) |
(10.9) |
(8.8) |
America # |
(53.0) |
(52.7) |
(11.9) |
(40.6) |
(68.1) |
France |
4,146 |
3,636 |
1606 |
2269 |
2063 |
United Kingdom@ |
32 |
36 |
179 |
225 |
17 |
| |
(32.4) |
(26.0) |
(11.0) |
(10.6) |
(12.2) |
|
(2.5) |
(2.5) |
(8.6) |
(3.1) |
(0.2) |
Switzerland |
658 |
497 |
954 |
1623 |
1112 |
Ireland |
9 |
0 |
100 |
23 |
0 |
| |
(5.1) |
(3.6) |
(6.5) |
(7.6) |
(6.6) |
|
(0.7) |
(0.0) |
(4.8) |
(0.3) |
(0.0) |
@ : excluding Guernsey, Isle of Man and Jersey. # : includes Miday Island and Wake Islands.
Note: Figures in brackets represent percentages to total. |
V. Comparison of CBS of the Countries Reporting Data to BIS vis-à-vis CBS of India
A comparative position of CBS of India and the CBS of BIS reporting countries as at end-June 2008 and end-June 2007 has been presented in this section covering three aspects, viz., (i) consolidated international/ foreign claims of banks in the BIS reporting countries on all other countries, (ii) consolidated international/foreign claims of banks in the BIS reporting countries on India and (iii) international/foreign claims of Indian Banks on countries other than India. It may be mentioned that the data published by the BIS relate to the consolidated total international/foreign claims of all BIS reporting countries on other countries. Further, the claims of India denote claims of Indian banks’ branches/offices, operating in India and abroad, on countries other than India.
V.A Total International/Foreign Claims-Immediate Risk Basis
Total foreign claims of banks in the BIS reporting countries on all other countries recorded a growth of 15.8 per cent as at end-June 2008 over end-June 2007 (Table 5). Also, total foreign claims of Indian banks on other countries increased by US $3.4 billion (8.0 per cent) during the same period. As regards the components of ‘total foreign claims’, viz., ‘local claims in local currencies’ and ‘international claims’, their shares for the BIS reporting countries to total foreign claims as at end-June 2008 remained unchanged as compared to their respective shares a year ago. In respect of claims of Indian banks, the share of international claims increased marginally by 0.8 percentage points and, correspondingly the share of local claims in local currencies declined.
International claims of banks in the BIS reporting countries on India (i.e., India’s liability) increased to US $ 147.4 billion as at end-June 2008 from US $ 106.6 billion (38.3 per cent) a year ago, whereas the international claims of Indian banks on other countries (i.e., India’s assets) stood at US $ 39.9 billion as at end-June 2008, which was higher by US $ 3.3 billion over the position a year ago.
V. B International Claims-by Residual Maturity and Sector
Maturity-wise classification of international claims of banks in the BIS reporting countries on all other countries revealed that the share of ‘short-term’ claims declined marginally while the ‘long term’ claims increased as at end-June 2008 compared to their respective shares a year ago. The Indian banks showed preference to ‘short-term’ lending/investment as at end-June 2008.
The short-term claims of banks in the BIS reporting countries on India increased by US $ 27.2 billion as at end-June 2008 over the position a year ago compared to a decline of US $ 0.3 billion in short-term claims of Indian banks on countries other than India during the corresponding period.
Table 5 : Claims of BIS Reporting Banks on India & other Countries and Indian Banks’ claim on other Countries - Immediate Country Risk basis |
(US $ billion) |
Claims |
Claims of BIS Reporting Countries’ Banks on all Countries including India |
Claims of BIS Reporting Countries’ Banks on India |
Claims of Indian Banks on countries other than India # |
March 2007 |
June 2007 |
March 2008 |
June 2008 |
March 2007 |
June 2007 |
March 2008 |
June 2008 |
March 2007 |
June 2007 |
March 2008 |
June 2008 |
(a) Total International Claims |
20,095.8 |
21,130.1 |
25,177.0 |
24,429.9 |
92.6 |
106.6 |
145.5 |
147.4 |
32.3 |
36.6 |
42.2 |
39.9 |
(67.5) |
(67.6) |
(68.2) |
(67.5) |
(62.3) |
(62.9) |
(63.6) |
(65.5) |
(86.6) |
(86.7) |
(88.2) |
(87.5) |
(b) Local Claims in Local Currencies |
9,686.0 |
10,141.3 |
11,719.6 |
11,782.3 |
56.1 |
62.9 |
83.2 |
77.8 |
5.0 |
5.6 |
5.7 |
5.7 |
(32.5) |
(32.4) |
(31.8) |
(32.5) |
(37.7) |
(37.1) |
(36.4) |
(34.5) |
(13.4) |
(13.3) |
(11.8) |
(12.5) |
(c) Total Foreign Claims (a+b) |
29,781.0 |
31,271.3 |
36,897.1 |
36,212.2 |
148.6 |
169.5 |
228.7 |
225.2 |
37.3 |
42.2 |
47.9 |
45.6 |
(100.0) |
(100.0) |
(100.0) |
(100.0) |
(100.0) |
(100.0) |
(100.0) |
(100.0) |
(100.0) |
(100.0) |
(100.0) |
(100.0) |
# : Claims of Indian Banks’ branches/offices operating in India and abroad, on countries other than India; these data are taken from the data supplied to the BIS.
Note : Figures in brackets represent percentages to total foreign claims.
Source : BIS International Consolidated Banking Statistics (www.bis.org) |
Table 6 : International Claims of BIS Reporting Banks vis-à-vis Indian Banks - by Maturity and Sector |
(US $ billion) |
Maturity/Sector |
Claims of BIS Reporting Countries’ Banks on all Countries including India |
Claims of BIS Reporting Countries’ Banks on India |
Claims of Indian Banks on countries other than India # |
March 2007 |
June 2007 |
March 2008 |
June 2008 |
March 2007 |
June 2007 |
March 2008 |
June 2008 |
March 2007 |
June 2007 |
March 2008 |
June 2008 |
Total InternationalClaim |
20,095.8 |
21,130.1 |
25,177.5 |
24,429.9 |
92.6 |
106.6 |
145.5 |
147.4 |
32.3 |
36.6 |
42.2 |
39.9 |
(100.0) |
(100.0) |
(100.0) |
(100.0) |
(100.0) |
(100.0) |
(100.0) |
(100.0) |
(100.0) |
(100.0) |
(100.0) |
(100.0) |
of which: |
|
|
|
|
|
|
|
|
|
|
|
|
Maturity |
Short Term* |
10,916.9 |
11,491.9 |
13,647.7 |
12,992.0 |
47.8 |
55.2 |
79.7 |
82.4 |
23.2 |
26.8 |
29.2 |
26.5 |
(54.3) |
(54.4) |
(54.2) |
(53.2) |
(51.6) |
(51.8) |
(54.8) |
(55.9) |
(71.8) |
(73.2) |
(69.2) |
(66.4) |
Long Term ** |
5,959.6 |
6,231.1 |
7,618.8 |
7,629.2 |
28.8 |
33.1 |
43.8 |
43.1 |
9.1 |
9.8 |
12.5 |
12.9 |
(29.7) |
(29.5) |
(30.3) |
(31.2) |
(31.1) |
(31.1) |
(30.1) |
(29.3) |
(28.2) |
(26.8) |
(29.6) |
(32.3) |
Sector $ |
Bank |
9,350.3 |
9,765.9 |
11,831.9 |
11,270.0 |
28.6 |
31.2 |
48.5 |
51.2 |
14.3 |
16.7 |
15.6 |
15.1 |
(46.5) |
(46.2) |
(47.0) |
(46.1) |
(30.9) |
(29.3) |
(33.3) |
(34.7) |
(44.3) |
(45.6) |
(36.8) |
(37.9) |
Non-BankPublic |
2,245.3 |
2,275.0 |
2,528.8 |
2,508.3 |
4.7 |
4.8 |
7.8 |
7.4 |
0.2 |
0.2 |
0.2 |
0.2 |
(11.2) |
(10.8) |
(10.0) |
(10.3) |
(5.1) |
(4.5) |
(5.3) |
(5.0) |
(0.6) |
(0.5) |
(0.4) |
(0.5) |
Non-BankPrivate |
8,276.6 |
8,856.9 |
10,554.7 |
10,377.3 |
56.9 |
67.5 |
85.5 |
84.6 |
17.7 |
19.7 |
26.5 |
24.6 |
(41.2) |
(41.9) |
(41.9) |
(42.5) |
(61.4) |
(63.4) |
(58.7) |
(57.4) |
(54.8) |
(53.8) |
(62.7) |
(61.7) |
# : Claims of Indian Banks’ branches/offices operating in India and abroad, on countries other than India; these data are taken from the data supplied to the BIS.
* : Claims with a residual maturity of up to and including one year
** : Claims with a maturity of over one year (excluding unallocated maturity)
$ : Excluding unallocated sector
Note : Figures in brackets represent percentages to total international claims.
Source : BIS International Consolidated Banking Statistics (www.bis.org) updated till April 25, 2007. |
Sector-wise composition of international claims of banks in the BIS reporting countries on all other countries as at end-June 2008 was almost unchanged from the composition a year ago (Table 6). In respect of Indian banks’ international claims on countries other than India, the share of ‘non-bank public’ sector increased, while the share of banking sector declined.
Comparative position of sector-wise classification showed that the share of claims of banks in the BIS reporting countries on India in the ‘non-bank private’ sector declined while the share registered an increase for banking sector as at end-June 2008 over end-June 2007.
V. C International Claims-by Country of Incorporation of Reporting Banks
International claims of banks in the BIS reporting countries on all other countries classified according to the country of incorporation of the bank as at end-June 2008 and 2007 are presented in Table 7. The banks incorporated in Germany accounted for the maximum share at 19.4 per cent, followed by banks incorporated in France (12.2 per cent), Japan (10.7 per cent), the UK (10.5 per cent), Switzerland (7.6 per cent)
Table 7: International Claims of BIS Reporting
Banks on all other Countries - by Country of Incorporation |
(US $ billion) |
Country of Incorporation |
International Claims on all other Countries |
Mar-07 |
Jun-07 |
Mar-08 |
Jun-08 |
Total International |
16,238.2 |
17,109.0 |
19,920.0 |
19,393.2 |
Claims |
(100.0) |
(100.0) |
(100.0) |
(100.0) |
of which : |
|
|
|
|
Germany |
3,170.3 |
3,404.5 |
3,915.7 |
3,770.9 |
| |
(19.5) |
(19.9) |
(19.7) |
(19.4) |
France |
1,845.3 |
2,015.9 |
2,511.0 |
2,373.2 |
| |
(11.4) |
(11.8) |
(12.6) |
(12.2) |
Japan |
1,631.3 |
1,733.2 |
2,069.0 |
2,066.6 |
| |
(10.0) |
(10.1) |
(10.4) |
(10.7) |
United Kingdom |
1,674.6 |
1,694.4 |
2,120.8 |
2,032.1 |
| |
(10.3) |
(9.9) |
(10.6) |
(10.5) |
Switzerland |
1,363.9 |
1,396.1 |
1,500.3 |
1,465.5 |
| |
(8.4) |
(8.2) |
(7.5) |
(7.6) |
Netherlands |
1,185.6 |
1,233.0 |
1,371.2 |
1,189.6 |
| |
(7.3) |
(7.2) |
(6.9) |
(6.1) |
United States |
954.7 |
1,038.2 |
1,069.3 |
1,021.2 |
| |
(5.9) |
(6.1) |
(5.4) |
(5.3) |
India # |
32.3 |
36.6 |
42.2 |
39.9 |
| |
(0.2) |
(0.2) |
(0.2) |
(0.2) |
# : Claims of Indian Banks’ branches/offices operating in India and abroad, on countries other than India; these data are taken from the data supplied to the BIS.
Note : Figures in brackets represent percentages to total
international claims.
Source : BIS International Consolidated Banking Statistics (www.bis.org). |
and Netherlands (6.1 per cent). However, the shares of banks incorporated in France, UK and Japan declined slightly as at end-June 2008 compared to their respective shares a year ago. The Indian banks’ share in total international claims remained at 0.2 per cent as at end-June 2008.
Such claims of banks on India according to their country of incorporation (Table 8) revealed that the banks incorporated in six countries, viz., the USA (17.0 per cent), the UK (17.4 per cent), Germany (12.3 per cent),
Table 8 : International Claims of BIS Reporting Banks on India - by Country of Incorporation |
(US $ billion) |
Country of Incorporation |
International Claims on India |
Mar-07 |
Jun-07 |
Mar-08 |
Jun-08 |
Total International |
76.2 |
88.3 |
121.7 |
121 |
Claim |
(100.0) |
(100.0) |
(100.0) |
(100.0) |
of which: |
|
|
|
|
United States |
17.7 |
23.5 |
24.9 |
20.6 |
| |
(23.2) |
(26.6) |
(20.5) |
(17.0) |
United Kingdom |
10.5 |
11.6 |
19.7 |
21.1 |
| |
(13.8) |
(13.1) |
(16.2) |
(17.4) |
Germany |
10.6 |
11.3 |
14.8 |
14.9 |
| |
(13.9) |
(12.8) |
(12.2) |
(12.3) |
Netherlands |
6.8 |
7.6 |
12.7 |
12.5 |
| |
(8.9) |
(8.6) |
(10.4) |
(10.3) |
Japan |
8.0 |
8.5 |
12.7 |
12.4 |
| |
(10.5) |
(9.6) |
(10.4) |
(10.2) |
Switzerland |
4.6 |
5.9 |
4.5 |
5.6 |
| |
(6.0) |
(6.7) |
(3.7) |
(4.6) |
Note: 1. The data on international claims on India of banks incorporated in Canada and Ireland are masked by the BIS.
2. Figures in brackets represent percentages to total international claims.
Source : BIS International Consolidated Banking Statistics (www.bis.org). |
Netherlands (10.3 per cent), Japan (10.2 per cent) and Switzerland (4.6 per cent) accounted for 72.0 per cent share in aggregate as at end-June 2008. While the shares of claims of banks incorporated in the UK, Netherlands and Japan increased, the shares of banks incorporated in the USA and Switzerland declined in June 2008 over June 2007.
V.D Foreign Claims: Ultimate Risk Basis
Total foreign claims, on ultimate risk basis, of banks in the BIS reporting countries on all other countries stood at US $ 30,127 billion as at end-June 2008, of which 56.5 per cent claims were on ‘non-bank private’ sector (Table 9). The foreign claims of banks in the BIS reporting countries on India stood at US $ 207 billion as at end-June 2008. About 68.2 per cent claims of banks in the BIS reporting countries on India related to ‘non-bank private’ sector.
Table 9 : Consolidated Foreign Claims of BIS Reporting Banks on India & other Countries and Indian Banks’ claim on other Countries: Ultimate Risk Basis |
(US $ billion) |
Claims |
Claims of BIS Reporting Countries’ Banks on all Countries including India## |
Claims of BIS Reporting Countries’ Banks on India |
Claims of Indian Banks on countries other than India # |
March 2007 |
June 2007 |
March 2008 |
June 2008 |
March 2007 |
June 2007 |
March 2008 |
June 2008 |
March 2007 |
June 2007 |
March 2008 |
June 2008 |
(a) Total Foreign |
24,926.3 |
26,196.8 |
30,679.2 |
30,126.6 |
133.1 |
154.0 |
207.6 |
207.0 |
33.8 |
36.6 |
41.2 |
38.1 |
Claims |
(100.0) |
(100.0) |
(100.0) |
(100.0) |
(100.0) |
(100.0) |
(100.0) |
(100.0) |
(100.0) |
(100.0) |
(100.0) |
(100.0) |
of which : |
|
|
|
|
|
|
|
|
|
|
|
|
| |
Banks |
7,146.2 |
7,535.7 |
8,879.9 |
8,581.1 |
29.0 |
30.6 |
48.4 |
49.6 |
19.6 |
19.9 |
19.3 |
16.6 |
Sector |
|
(28.7) |
(28.8) |
(28.9) |
(28.5) |
(21.8) |
(19.9) |
(23.3) |
(24.0) |
(58.0) |
(54.3) |
(46.8) |
(43.5) |
| |
Non-Bank |
3,854.1 |
3,795.5 |
4,355.2 |
4,307.7 |
10.3 |
11.7 |
16.7 |
15.5 |
0.3 |
0.3 |
0.4 |
0.3 |
| |
Public |
(15.5) |
(14.5) |
(14.2) |
(14.3) |
(7.7) |
(7.6) |
(8.0) |
(7.5) |
(1.0) |
(0.7) |
(0.9) |
(0.8) |
| |
Non-Bank |
13,724.0 |
14,679.5 |
17,243.9 |
17,028.4 |
93.5 |
111.4 |
142.1 |
141.1 |
13.7 |
16.4 |
21.5 |
21.2 |
| |
Private |
(55.1) |
(56.0) |
(56.2) |
(56.5) |
(70.2) |
(72.3) |
(68.4) |
(68.2) |
(40.6) |
(44.7) |
(52.3) |
(55.7) |
(b) Other Exposures |
Derivatives |
2,296.8 |
2,657.5 |
4,744.1 |
4,872.3 |
8.3 |
11.5 |
16.3 |
28.8 |
2.9 |
3.4 |
5.3 |
3.9 |
Guarantees |
5,162.9 |
5,711.4 |
8,254.0 |
8,698.0 |
14.4 |
16.0 |
21.1 |
27.0 |
3.2 |
4.2 |
6.7 |
8.7 |
Credit Commitments |
4,335.6 |
4,659.9 |
4,970.6 |
4,854.5 |
17.9 |
12.1 |
16.0 |
15.1 |
0.3 |
0.4 |
1.8 |
1.7 |
# : Claims of Indian Banks’ branches/offices operating in India and abroad, on countries other than India; these data are taken from the data supplied to the BIS.
## : Out of thirty countries submitting CBS on immediate risk basis, twenty four countries submitted CBS on ultimate risk basis to the BIS
Note : Figures in brackets represent percentages to total foreign claims.
Source: BIS International Consolidated Banking Statistics (www.bis.org) |
Statement I : International Liabilities/Assets of Banks Classified According to Type
(Based on LBS Statements) |
(Rs. crore) |
Liability/Asset Category |
International Liabilities |
| |
Amount Outstanding as at end of |
| |
Q1: 2007 |
Q2: 2007 |
Q3: 2007 |
Q4: 2007 |
Q1: 2008 |
Q2:2008 |
1 |
2 |
3 |
4 |
5 |
6 |
7 |
1. |
Deposits and Loans |
271,403 |
264,097 |
274,747 |
272,024 |
289,362 |
304,586 |
| |
|
|
(75.2) |
(73.4) |
(69.9) |
(67.6) |
(74.0) |
(77.3) |
| |
(a) |
Foreign Currency Non-resident Bank |
68,086 |
65,834 |
64,701 |
61,181 |
60,340 |
62,730 |
| |
|
[FCNR(B)] scheme |
(18.9) |
(18.3) |
(16.5) |
(15.2) |
(15.4) |
(15.9) |
| |
(b) |
Resident Foreign Currency (RFC) A/Cs |
1,634 |
1,443 |
1,285 |
1,570 |
1,421 |
1,197 |
| |
|
|
(0.5) |
(0.4) |
(0.3) |
(0.4) |
(0.4) |
(0.3) |
| |
(c) |
Exchange Earners Foreign Currency |
9,401 |
9,420 |
9,569 |
9,545 |
10,036 |
10,897 |
| |
|
(EEFC) A/Cs |
(2.6) |
(2.6) |
(2.4) |
(2.4) |
(2.6) |
(2.8) |
| |
(d) |
Other foreign currency deposits (including |
2,380 |
2,396 |
2,383 |
2,221 |
1,736 |
1,712 |
| |
|
Inter-bank Foreign Currency deposits) |
(0.7) |
(0.7) |
(0.6) |
(0.6) |
(0.4) |
(0.4) |
| |
(e) |
Foreign Currency Borrowing (Inter-bank borrowing in India and from abroad, |
61,470 |
59,662 |
63,213 |
62,776 |
77,257 |
90,791 |
| |
|
external commercial borrowings of banks) |
(17.0) |
(16.6) |
(16.1) |
(15.6) |
(19.8) |
(23.1) |
| |
(f) |
VOSTRO balances and balances in |
1,359 |
1,487 |
1,328 |
1,451 |
1,485 |
1,867 |
| |
|
exchange houses and in term deposits |
(0.4) |
(0.4) |
(0.3) |
(0.4) |
(0.4) |
(0.5) |
| |
(g) |
Non-Resident External Rupee |
112,907 |
109,974 |
110,445 |
109,400 |
111,301 |
114,316 |
| |
|
(NRE)Accounts |
(31.3) |
(30.6) |
(28.1) |
(27.2) |
(28.5) |
(29.0) |
| |
(h) |
Non-Resident Ordinary (NRO) Rupee |
6,855 |
7,996 |
8,696 |
9,469 |
11,387 |
10,339 |
| |
|
Accounts |
(1.9) |
(2.2) |
(2.2) |
(2.4) |
(2.9) |
(2.6) |
| |
(i) |
Embassy accounts |
207 |
221 |
155 |
93 |
95 |
227 |
| |
|
|
(0.1) |
(0.1) |
(0.0) |
(0.0) |
(0.0) |
(0.1) |
| |
(j) |
Foreign Institutional Investors’ (FII) |
7,099 |
5,662 |
12,971 |
14,308 |
14,290 |
10,505 |
| |
|
Accounts |
(2.0) |
(1.6) |
(3.3) |
(3.6) |
(3.7) |
(2.7) |
| |
(k) |
ESCROW A/Cs |
6 |
2 |
1 |
11 |
13 |
4 |
| |
|
|
(0.0) |
(0.0) |
(0.0) |
(0.0) |
(0.0) |
(0.0) |
2. |
Own Issues of International Securities |
10,036 |
9,651 |
9,176 |
9,016 |
9,166 |
9,369 |
| |
|
|
(2.8) |
(2.7) |
(2.3) |
(2.2) |
(2.3) |
(2.4) |
| |
(a) |
Bonds |
8,706 |
8,415 |
7,958 |
7,770 |
7,980 |
8,322 |
| |
|
|
(2.4) |
(2.3) |
(2.0) |
(1.9) |
(2.0) |
(2.1) |
| |
(b) |
Floating Rate Notes (FRNs) |
|
|
|
48 |
48 |
35 |
| |
|
|
|
|
|
(0.0) |
(0.0) |
(0.0) |
| |
(c) |
Other Own Issues of International |
1,330 |
1,236 |
1218 |
1,198 |
1,138 |
1,013 |
| |
|
Debt Securities |
(0.4) |
(0.3) |
(0.3) |
(0.3) |
(0.3) |
(0.3) |
3. |
Other International Liabilities |
79,258 |
85,916 |
108,897 |
121,257 |
92,329 |
79,877 |
| |
|
|
(22.0) |
(23.9) |
(27.7) |
(30.1) |
(23.6) |
(20.3) |
| |
(a) |
ADRs/GDRs |
23,515 |
23,382 |
34,696 |
41,733 |
25,111 |
19,861 |
| |
|
|
(6.5) |
(6.5) |
(8.8) |
(10.4) |
(6.4) |
(5.0) |
| |
(b) |
Equities of banks held by non-residents |
40,328 |
46,583 |
56,982 |
61,213 |
45,603 |
34,388 |
| |
|
|
(11.2) |
(13.0) |
(14.5) |
(15.2) |
(11.7) |
(8.7) |
| |
(c) |
Capital/remittable profits of foreign |
15,415 |
15,951 |
17,219 |
18,311 |
21,615 |
25,628 |
| |
|
banks in India and other unclassified international liabilities |
(4.3) |
(4.4) |
(4.4) |
(4.6) |
(5.5) |
(6.5) |
Total International Liabilities + |
360,698 |
359,663 |
392,821 |
402,297 |
390,857 |
393,832 |
| |
|
|
(100.0) |
(100.0) |
(100.0) |
(100.0) |
(100.0) |
(100.0) |
Statement I: International Liabilities/Assets of Banks Classified According to Type (Based on LBS Statements) (Concld.) |
(Rs. crore) |
Liability/Asset Category |
International Assets |
Amount Outstanding as at end of |
Q1: 2007 |
Q2: 2007 |
Q3: 2007 |
Q4: 2007 |
Q1: 2008 |
Q2:2008 |
1 |
2 |
3 |
4 |
5 |
6 |
7 |
1. |
Loans and Deposits |
190,888 |
185,204 |
190,753 |
199,464 |
212,126 |
198,278 |
| |
|
|
(94.0) |
(94.0) |
(94.6) |
(95.0) |
(95.2) |
(95.1) |
| |
(a) |
Loans to Non-residents (includes Rupee loans and Foreign Currency |
7,122 |
7,351 |
7,402 |
7,896 |
8,565 |
8,321 |
| |
|
(FC) loans out of non-resident deposits) |
(3.5) |
(3.7) |
(3.7) |
(3.8) |
(3.8) |
(4.0) |
| |
(b) |
FC Loans to Residents (incl. loans out of FCNR(B) deposits, PCFCs, FC lending |
75,000 |
72,645 |
87,789 |
100,423 |
108,440 |
106,393 |
| |
|
to & FC Deposits with banks in India, etc., |
(37.0) |
(36.9) |
(43.6) |
(47.8) |
(48.7) |
(51.0) |
| |
(c) |
Outstanding Export Bills drawn on |
40,846 |
38,257 |
40,852 |
43,899 |
49,011 |
45,951 |
| |
|
non-residents by residents |
(20.1) |
(19.4) |
(20.3) |
(20.9) |
(22.0) |
(22.0) |
| |
(d) |
Foreign Currency /TTs, etc., in hand |
432 |
388 |
293 |
382 |
358 |
361 |
| |
|
|
(0.2) |
(0.2) |
(0.1) |
(0.2) |
(0.2) |
(0.2) |
| |
(e) |
NOSTRO balances including balances in Term Deposits with non-resident |
67,487 |
66,564 |
54,417 |
46,863 |
45,752 |
37,252 |
| |
|
banks (includes FCNR funds held abroad) |
(33.2) |
(33.8) |
(27.0) |
(22.3) |
(20.5) |
(17.9) |
2. |
Holdings of Debt Securities |
1,761 |
1,529 |
670 |
609 |
334 |
287 |
| |
|
|
(0.9) |
(0.8) |
(0.3) |
(0.3) |
(0.1) |
(0.1) |
| |
(a) |
Investment in Foreign Government |
80 |
78 |
56 |
55 |
41 |
74 |
| |
|
Securities (including Treasury Bills) |
(0.0) |
(0.0) |
(0.0) |
(0.0) |
(0.0) |
(0.0) |
| |
(b) |
Investment in Other Debt Securities |
1,681 |
1,451 |
614 |
554 |
293 |
213 |
| |
|
|
(0.8) |
(0.7) |
(0.3) |
(0.3) |
(0.1) |
(0.1) |
3. |
Other International Assets |
10,324 |
10,288 |
10,126 |
9,864 |
10,250 |
9,951 |
| |
|
|
(5.1) |
(5.2) |
(5.0) |
(4.7) |
(4.6) |
(4.8) |
| |
(a) |
Investments in Equities Abroad |
1,466 |
1,501 |
1,425 |
1,421 |
1,432 |
1,480 |
| |
|
|
(0.7) |
(0.8) |
(0.7) |
(0.7) |
(0.6) |
(0.7) |
| |
(b) |
Capital supplied to and receivable profits from foreign branches of Indian banks and other unclassified |
8,858 |
8,787 |
8,701 |
8,443 |
8,818 |
8,471 |
| |
|
intl. assets |
(4.4) |
(4.5) |
(4.3) |
(4.0) |
(4.0) |
(4.1) |
Total International Assets + |
202,973 |
197,022 |
201,549 |
209,937 |
222,711 |
208,516 |
| |
|
|
(100.0) |
(100.0) |
(100.0) |
(100.0) |
(100.0) |
(100.0) |
+ : In view of the incomplete data coverage from all the branches, the data reported under the LBS are not strictly
comparable with those capturing data from all the branches.
‘—’ : Nil/Negligible.
Notes :1. Figures in brackets represent percentages to total international liabilities/assets.
2. Totals may not tally due to rounding off .
3. Data have been revised for previous quarters.
4. Q1, Q2, Q3 and Q4 denote quarters ended March, June, September and December, respectively. |
Statement II : Currency and Sector-wise Breakup of International Liabilities/Assets of Banks (Based on LBS Statements) |
(Rs. crore) |
Currency |
International Liabilities |
| |
All Sector |
Non-Bank Sector |
| |
Q1: 2007 |
Q2: 2007 |
Q3: 2007 |
Q4: 2007 |
Q1: 2008 |
Q2: 2008 |
Q1: 2007 |
Q2: 2007 |
Q3: 2007 |
Q4: 2007 |
Q1: 2008 |
Q2: 2008 |
1 |
2 |
3 |
4 |
5 |
6 |
7 |
8 |
9 |
10 |
11 |
12 |
13 |
Swiss Franc |
179 |
253 |
248 |
370 |
413 |
491 |
27 |
17 |
29 |
49 |
59 |
28 |
| |
(0.0) |
(0.1) |
(0.1) |
(0.1) |
(0.1) |
(0.1) |
(0.0) |
(0.0) |
(0.0) |
(0.0) |
(0.0) |
(0.0) |
EURO |
11,226 |
13,092 |
13,185 |
13,074 |
15,304 |
16,423 |
9,309 |
10,489 |
10,761 |
10,370 |
10,826 |
12,574 |
| |
(3.1) |
(3.6) |
(3.4) |
(3.2) |
(3.9) |
(4.2) |
(3.4) |
(3.8) |
(3.5) |
(3.3) |
(3.8) |
(4.6) |
Pound Sterling |
18,272 |
16,088 |
16,133 |
15,188 |
18,641 |
26,124 |
16,939 |
14,455 |
14,540 |
13,237 |
15,677 |
17,211 |
| |
(5.1) |
(4.5) |
(4.1) |
(3.8) |
(4.8) |
(6.6) |
(6.2) |
(5.3) |
(4.8) |
(4.2) |
(5.5) |
(6.3) |
Indian Rupee |
181,998 |
186,083 |
206,058 |
212,160 |
203,850 |
195,065 |
163,708 |
166,163 |
184,893 |
191,248 |
179,761 |
168,373 |
| |
(50.5) |
(51.7) |
(52.5) |
(52.7) |
(52.2) |
(49.5) |
(59.6) |
(60.6) |
(61.0) |
(61.0) |
(63.0) |
(61.9) |
Japanese Yen |
14,072 |
13,734 |
13,697 |
12,838 |
18,035 |
15,162 |
1,439 |
1,049 |
1,255 |
1,600 |
1,874 |
1,401 |
| |
(3.9) |
(3.8) |
(3.5) |
(3.2) |
(4.6) |
(3.8) |
(0.5) |
(0.4) |
(0.4) |
(0.5) |
(0.7) |
(0.5) |
Other Foreign |
1,526 |
2,079 |
2,085 |
2,372 |
2,288 |
3,367 |
354 |
575 |
510 |
561 |
658 |
1,041 |
Currencies |
(0.4) |
(0.6) |
(0.5) |
(0.6) |
(0.6) |
(0.9) |
(0.1) |
(0.2) |
(0.2) |
(0.2) |
(0.2) |
(0.4) |
US Dollar |
133,425 |
128,334 |
141,416 |
146,295 |
132,328 |
137,201 |
82,901 |
81,335 |
91,266 |
96,443 |
76,447 |
71,365 |
| |
(37.0) |
(35.7) |
(36.0) |
(36.4) |
(33.9) |
(34.8) |
(30.2) |
(29.7) |
(30.1) |
(30.8) |
(26.8) |
(26.2) |
Total |
360,698 |
359,663 |
392,821 |
402,297 |
390,857 |
393,832 |
274,675 |
274,082 |
303,255 |
313,507 |
285,303 |
271,993 |
| |
(100.0) |
(100.0) |
(100.0) |
(100.0) |
(100.0) |
(100.0) |
(100.0) |
(100.0) |
(100.0) |
(100.0) |
(100.0) |
(100.0) |
International Assets |
Swiss Franc |
1,728 |
1,442 |
1,074 |
3,199 |
2,466 |
1,861 |
505 |
486 |
545 |
2,475 |
1,836 |
1,387 |
| |
(0.9) |
(0.7) |
(0.5) |
(1.5) |
(1.1) |
(0.9) |
(0.4) |
(0.4) |
(0.4) |
(1.7) |
(1.2) |
(0.9) |
EURO |
10,987 |
10,419 |
10,309 |
10,855 |
13,972 |
13,218 |
7,490 |
6,968 |
7,138 |
7,718 |
9,915 |
9,715 |
| |
(5.4) |
(5.3) |
(5.1) |
(5.2) |
(6.3) |
(6.3) |
(6.5) |
(6.3) |
(5.6) |
(5.4) |
(6.3) |
(6.4) |
Pound Sterling |
6,967 |
6,444 |
6,495 |
6,512 |
6,018 |
6,082 |
1,839 |
1,664 |
2,435 |
2,772 |
2,216 |
1,784 |
| |
(3.4) |
(3.3) |
(3.2) |
(3.1) |
(2.7) |
(2.9) |
(1.6) |
(1.5) |
(1.9) |
(2.1) |
(1.5) |
(1.3) |
Indian Rupee |
8,008 |
7,835 |
8,229 |
7,468 |
7,354 |
7,541 |
7,851 |
7,822 |
8,134 |
7,413 |
7,300 |
7,518 |
| |
(3.9) |
(4.0) |
(4.1) |
(3.6) |
(3.3) |
(3.6) |
(6.9) |
(7.1) |
(6.4) |
(5.2) |
(4.7) |
(5.0) |
Japanese Yen |
3,009 |
3,103 |
3,869 |
3,253 |
4,180 |
3,091 |
1,926 |
1,917 |
2,514 |
2,149 |
2,895 |
1,969 |
| |
(1.5) |
(1.6) |
(1.9) |
(1.5) |
(1.9) |
(1.5) |
(1.7) |
(1.7) |
(2.0) |
(1.5) |
(1.9) |
(1.3) |
Other Foreign |
6,951 |
6,922 |
6,789 |
6,320 |
7,976 |
6,691 |
851 |
740 |
579 |
428 |
1,222 |
945 |
Currencies |
(3.4) |
(3.5) |
(3.4) |
(3.0) |
(3.6) |
(3.2) |
(0.7) |
(0.7) |
(0.5) |
(0.3) |
(0.8) |
(0.6) |
US Dollar |
165,322 |
160,856 |
164,784 |
172,330 |
180,743 |
170,032 |
93,945 |
91,237 |
106,703 |
119,360 |
130,926 |
127,366 |
| |
(81.5) |
(81.6) |
(81.8) |
(82.1) |
(81.2) |
(81.5) |
(82.1) |
(82.3) |
(83.3) |
(83.8) |
(83.7) |
(84.4) |
Total |
202,973 |
197,022 |
201,549 |
209,937 |
222,711 |
208,516 |
114,408 |
110,832 |
128,047 |
142,314 |
156,309 |
150,683 |
| |
(100.0) |
(100.0) |
(100.0) |
(100.0) |
(100.0) |
(100.0) |
(100.0) |
(100.0) |
(100.0) |
(100.0) |
(100.0) |
(100.0) |
@ : excluding Guernsey, Isle of Man and Jersey. # : includes Miday Island and Wake Islands.
‘—’ : nil/negligible.
Note: 1. Figures in brackets represent percentages to total in the respective group (column).
2. Totals may not tally due to rounding off.
3. Data have been revised for previous quarters.
4. Q1, Q2, Q3 and Q4 denote quarters ended March, June, September and December, respectively. |
Statement III : International Liabilities/Assets of Banks Classified According to Country of Residence of Transacting Units (Based on LBS Statements) - Amount outstanding as at end |
(Rs. crore) |
Country |
International Liabilities |
All Currencies |
Foreign Currencies |
|
Q1: 2007 |
Q2: 2007 |
Q3: 2007 |
Q4: 2007 |
Q1: 2008 |
Q2:2008 |
Q1: 2007 |
Q2: 2007 |
Q3: 2007 |
Q4: 2007 |
Q1: 2008 |
Q2:2008 |
Total |
360,698 |
359,663 |
392,821 |
402,297 |
390,857 |
393,832 |
178,699 |
173,581 |
186,763 |
190,137 |
187,008 |
198,767 |
of which: |
(100.0) |
(100.0) |
(100.0) |
(100.0) |
(100.0) |
(100.0) |
(100.0) |
(100.0) |
(100.0) |
(100.0) |
(100.0) |
(100.0) |
Bahrain |
5,207 |
5,585 |
8,291 |
7,476 |
7,451 |
8,027 |
3,514 |
3,975 |
6,022 |
5,687 |
5,602 |
6,024 |
| |
(1.4) |
(1.6) |
(2.1) |
(1.9) |
(1.9) |
(2.0) |
(2.0) |
(2.3) |
(3.2) |
(3.0) |
(3.0) |
(3.0) |
France |
4,010 |
4,582 |
4,636 |
4,447 |
5,769 |
6,581 |
635 |
1,085 |
1,202 |
2,101 |
3,335 |
3,901 |
| |
(1.1) |
(1.3) |
(1.2) |
(1.1) |
(1.5) |
(1.7) |
(0.4) |
(0.6) |
(0.6) |
(1.1) |
(1.8) |
(2.0) |
Germany |
9,858 |
11,746 |
12,992 |
13,360 |
14,296 |
15,225 |
7,349 |
8,476 |
9,818 |
9,345 |
9,421 |
10,491 |
(includes Ecb) |
(2.7) |
(3.3) |
(3.3) |
(3.3) |
(3.7) |
(3.9) |
(4.1) |
(4.9) |
(5.3) |
(4.9) |
(5.0) |
(5.3) |
Hong Kong |
9,486 |
9,414 |
9,714 |
9,455 |
9,738 |
10,264 |
5,449 |
5,018 |
5,043 |
4,973 |
5,145 |
5,714 |
| |
(2.6) |
(2.6) |
(2.5) |
(2.4) |
(2.5) |
(2.6) |
(3.0) |
(2.9) |
(2.7) |
(2.6) |
(2.8) |
(2.9) |
India |
15,855 |
16,753 |
17,212 |
16,386 |
16,929 |
21,583 |
15,855 |
16,753 |
17,212 |
16,386 |
16,929 |
21,583 |
| |
(4.4) |
(4.7) |
(4.4) |
(4.1) |
(4.3) |
(5.5) |
(8.9) |
(9.7) |
(9.2) |
(8.6) |
(9.1) |
(10.9) |
Japan |
4,653 |
4,625 |
4,965 |
5,945 |
4,784 |
5,518 |
2,583 |
2,657 |
2,525 |
2,364 |
1,706 |
2,000 |
| |
(1.3) |
(1.3) |
(1.3) |
(1.5) |
(1.2) |
(1.4) |
(1.4) |
(1.5) |
(1.4) |
(1.2) |
(0.9) |
(1.0) |
Kuwait |
5,459 |
5,821 |
6,067 |
7,078 |
6,708 |
6,966 |
1,606 |
1,367 |
1,661 |
1,964 |
1,525 |
1,708 |
| |
(1.5) |
(1.6) |
(1.5) |
(1.8) |
(1.7) |
(1.8) |
(0.9) |
(0.8) |
(0.9) |
(1.0) |
(0.8) |
(0.9) |
Mauritius |
17,254 |
17,932 |
26,070 |
26,075 |
21,040 |
15,336 |
648 |
918 |
1,055 |
1,170 |
1,560 |
1,453 |
| |
(4.8) |
(5.0) |
(6.6) |
(6.5) |
(5.4) |
(3.9) |
(0.4) |
(0.5) |
(0.6) |
(0.6) |
(0.8) |
(0.7) |
Netherlands |
6,313 |
7,057 |
7,004 |
8,175 |
11,641 |
12,250 |
2,429 |
3,271 |
3,396 |
4,544 |
6,330 |
7,196 |
| |
(1.8) |
(2.0) |
(1.8) |
(2.0) |
(3.0) |
(3.1) |
(1.4) |
(1.9) |
(1.8) |
(2.4) |
(3.4) |
(3.6) |
No Specific |
|
|
|
|
|
|
|
|
|
|
|
|
Country (country |
18,316 |
20,094 |
19,857 |
23,268 |
24,881 |
23,846 |
3,656 |
2,745 |
2,168 |
2,328 |
2,243 |
2,413 |
Unknown) |
(5.1) |
(5.6) |
(5.1) |
(5.8) |
(6.4) |
(6.1) |
(2.0) |
(1.6) |
(1.2) |
(1.2) |
(1.2) |
(1.2) |
Saudi Arabia |
9,413 |
8,126 |
9,392 |
9,902 |
9,481 |
9,640 |
1,456 |
1,047 |
1,286 |
1,513 |
1,550 |
1,626 |
| |
(2.6) |
(2.3) |
(2.4) |
(2.5) |
(2.4) |
(2.4) |
(0.8) |
(0.6) |
(0.7) |
(0.8) |
(0.8) |
(0.8) |
Singapore |
17,912 |
17,941 |
20,928 |
20,613 |
18,911 |
18,815 |
12,463 |
12,294 |
13,823 |
13,415 |
12,721 |
12,871 |
| |
(5.0) |
(5.0) |
(5.3) |
(5.1) |
(4.8) |
(4.8) |
(7.0) |
(7.1) |
(7.4) |
(7.1) |
(6.8) |
(6.5) |
United Arab |
28,846 |
25,721 |
28,346 |
27,497 |
24,664 |
27,374 |
9,390 |
7,523 |
7,746 |
7,033 |
4,270 |
4,485 |
Emirates |
(8.0) |
(7.2) |
(7.2) |
(6.8) |
(6.3) |
(7.0) |
(5.3) |
(4.3) |
(4.1) |
(3.7) |
(2.3) |
(2.3) |
United Kingdom@ |
56,734 |
49,384 |
53,605 |
54,350 |
56,417 |
64,851 |
32,318 |
27,841 |
30,576 |
32,039 |
38,287 |
44,827 |
| |
(15.7) |
(13.7) |
(13.6) |
(13.5) |
(14.4) |
(16.5) |
(18.1) |
(16.0) |
(16.4) |
(16.9) |
(20.5) |
(22.6) |
United States # |
109,684 |
109,310 |
114,471 |
117,783 |
107,453 |
97,205 |
60,088 |
58,406 |
61,225 |
64,344 |
53,595 |
48,913 |
(Incl. Midway Is., Wake Islands) |
(30.4) |
(30.4) |
(29.1) |
(29.3) |
(27.5) |
(24.7) |
(33.6) |
(33.6) |
(32.8) |
(33.8) |
(28.7) |
(24.6) |
Statement III: International Liabilities/Assets of Banks Classified According to Country of
Residence of Transacting Units (Based on LBS Statements) - Amount outstanding as at end (Concld.) |
(Rs. crore) |
Country |
International Assets |
All Currencies |
Foreign Currencies |
| |
Q1: 2007 |
Q2: 2007 |
Q3: 2007 |
Q4: 2007 |
Q1: 2008 |
Q2:2008 |
Q1: 2007 |
Q2: 2007 |
Q3: 2007 |
Q4: 2007 |
Q1: 2008 |
Q2:2008 |
Total |
202,973 |
197,022 |
201,549 |
209,937 |
222,711 |
208,516 |
194,965 |
189,187 |
193,321 |
202,469 |
215,356 |
200,975 |
of which: |
(100.0) |
(100.0) |
(100.0) |
(100.0) |
(100.0) |
(100.0) |
(100.0) |
(100.0) |
(100.0) |
(100.0) |
(100.0) |
(100.0) |
Bahrain |
3,579 |
3,602 |
2,290 |
988 |
1,141 |
1,091 |
3,500 |
3,516 |
2,208 |
900 |
1,047 |
996 |
| |
(1.8) |
(1.8) |
(1.1) |
(0.5) |
(0.5) |
(0.5) |
(1.8) |
(1.9) |
(1.1) |
(0.4) |
(0.5) |
(0.5) |
Belgium |
1,535 |
1,508 |
1,279 |
1,729 |
1,765 |
1,798 |
1,513 |
1,492 |
1,270 |
1,723 |
1,759 |
1,788 |
| |
(0.8) |
(0.8) |
(0.6) |
(0.8) |
(0.8) |
(0.9) |
(0.8) |
(0.8) |
(0.7) |
(0.9) |
(0.8) |
(0.9) |
Canada |
1,544 |
1,928 |
1,249 |
1,451 |
1,825 |
1,429 |
1,471 |
1,836 |
1,157 |
1,310 |
1,585 |
1,267 |
| |
(0.8) |
(1.0) |
(0.6) |
(0.7) |
(0.8) |
(0.7) |
(0.8) |
(1.0) |
(0.6) |
(0.6) |
(0.7) |
(0.6) |
China |
867 |
1,248 |
1,355 |
1,398 |
1,347 |
1,464 |
805 |
1,201 |
1,344 |
1,387 |
1,333 |
1,445 |
| |
(0.4) |
(0.6) |
(0.7) |
(0.7) |
(0.6) |
(0.7) |
(0.4) |
(0.6) |
(0.7) |
(0.7) |
(0.6) |
(0.7) |
France |
3,245 |
2,432 |
1,578 |
1,253 |
1,548 |
1,190 |
3,202 |
2,395 |
1,557 |
1,234 |
1,530 |
1,166 |
| |
(1.6) |
(1.2) |
(0.8) |
(0.6) |
(0.7) |
(0.6) |
(1.6) |
(1.3) |
(0.8) |
(0.6) |
(0.7) |
(0.6) |
Germany |
6,110 |
5,051 |
3,591 |
3,424 |
4,160 |
3,261 |
5,931 |
5,000 |
3,467 |
3,340 |
4,074 |
3,170 |
(includes Ecb) |
(3.0) |
(2.6) |
(1.8) |
(1.6) |
(1.9) |
(1.6) |
(3.0) |
(2.6) |
(1.8) |
(1.6) |
(1.9) |
(1.6) |
Hong Kong |
7,915 |
10,532 |
9,857 |
7,444 |
6,784 |
7,305 |
7,820 |
10,443 |
9,775 |
7,360 |
6,720 |
7,228 |
| |
(3.9) |
(5.3) |
(4.9) |
(3.5) |
(3.0) |
(3.5) |
(4.0) |
(5.5) |
(5.1) |
(3.6) |
(3.1) |
(3.6) |
India |
75,339 |
73,043 |
87,930 |
100,572 |
108,614 |
106,894 |
75,339 |
73,043 |
87,930 |
100,572 |
108,614 |
106,894 |
| |
(37.1) |
(37.1) |
(43.6) |
(47.9) |
(48.8) |
(51.3) |
(38.6) |
(38.6) |
(45.5) |
(49.7) |
(50.4) |
(53.2) |
Italy |
1,884 |
1,499 |
1,519 |
1,459 |
1,577 |
1,426 |
1,867 |
1,485 |
1,505 |
1,449 |
1,568 |
1,412 |
| |
(0.9) |
(0.8) |
(0.8) |
(0.7) |
(0.7) |
(0.7) |
(1.0) |
(0.8) |
(0.8) |
(0.7) |
(0.7) |
(0.7) |
Japan |
2,717 |
2,168 |
2,238 |
1,675 |
1,837 |
1,634 |
2,621 |
2,092 |
2,200 |
1,641 |
1,805 |
1,599 |
| |
(1.3) |
(1.1) |
(1.1) |
(0.8) |
(0.8) |
(0.8) |
(1.3) |
(1.1) |
(1.1) |
(0.8) |
(0.8) |
(0.8) |
No Specific |
2,417 |
2,277 |
2,118 |
1,859 |
1,814 |
1,648 |
1,189 |
1,209 |
1,105 |
921 |
949 |
863 |
Country (country Unknown) |
(1.2) |
(1.2) |
(1.1) |
(0.9) |
(0.8) |
(0.8) |
(0.6) |
(0.6) |
(0.6) |
(0.5) |
(0.4) |
(0.4) |
Singapore |
6,341 |
6,308 |
6,269 |
6,055 |
5,689 |
4,785 |
5,963 |
6,037 |
6,004 |
5,791 |
5,421 |
4,469 |
| |
(3.1) |
(3.2) |
(3.1) |
(2.9) |
(2.6) |
(2.3) |
(3.1) |
(3.2) |
(3.1) |
(2.9) |
(2.5) |
(2.2) |
United Arab |
4,540 |
4,502 |
4,627 |
6,898 |
6,458 |
5,733 |
3,811 |
3,682 |
3,868 |
6,096 |
5,641 |
4,918 |
Emirates |
(2.2) |
(2.3) |
(2.3) |
(3.3) |
(2.9) |
(2.7) |
(2.0) |
(1.9) |
(2.0) |
(3.0) |
(2.6) |
(2.4) |
United Kingdom@ |
15,535 |
15,605 |
12,686 |
10,632 |
12,399 |
10,988 |
14,956 |
14,979 |
12,061 |
10,076 |
11,854 |
10,295 |
| |
(7.7) |
(7.9) |
(6.3) |
(5.1) |
(5.6) |
(5.3) |
(7.7) |
(7.9) |
(6.2) |
(5.0) |
(5.5) |
(5.1) |
United States # (Incl. Midway Is., |
48,151 |
47,022 |
47,168 |
45,635 |
46,615 |
41,412 |
45,092 |
43,708 |
43,016 |
42,149 |
43,267 |
37,984 |
Wake Islands) |
(23.7) |
(23.9) |
(23.4) |
(21.7) |
(20.9) |
(19.9) |
(23.1) |
(23.1) |
(22.3) |
(20.8) |
(20.1) |
(18.9) |
@ : excluding Guernsey, Isle of Man and Jersey. # : includes Miday Island and Wake Islands.
‘—’ : nil/negligible.
Note: 1. Figures in brackets represent percentages to total in the respective group (column).
2. Totals may not tally due to rounding off.
3. Data have been revised for previous quarters.
4. Q1, Q2, Q3 and Q4 denote quarters ended March, June, September and December, respectively. |
Statement IV : Country - wise Breakup of Major Component of International Liabilities of Banks (Based on LBS Statements) |
(Rs. crore) |
Country |
Major Components |
Q1: 2007 |
Q2: 2007 |
Q3: 2007 |
Q4: 2007 |
Q1: 2008 |
Q2:2008 |
Bahrain |
FCNR(B) |
1,158 |
(1.7) |
1,870 |
(2.8) |
4,590 |
(7.1) |
4,644 |
(7.6) |
4,742 |
(7.9) |
5,194 |
(8.3) |
| |
Borrowings |
2,346 |
(3.8) |
2,094 |
(3.5) |
1,424 |
(2.3) |
1,034 |
(1.6) |
853 |
(1.1) |
820 |
(0.9) |
| |
NRE Deposits |
1,523 |
(1.3) |
1,449 |
(1.3) |
2,109 |
(1.9) |
1,651 |
(1.5) |
1,663 |
(1.5) |
1,830 |
(1.6) |
| |
Total |
5,207 |
(1.4) |
5,585 |
(1.6) |
8,291 |
(2.1) |
7,476 |
(1.9) |
7,451 |
(1.9) |
8,027 |
(2.0) |
Canada |
FCNR(B) |
745 |
(1.1) |
997 |
(1.5) |
907 |
(1.4) |
972 |
(1.6) |
1,019 |
(1.7) |
1,039 |
(1.7) |
| |
Borrowings |
101 |
(0.2) |
156 |
(0.3) |
96 |
(0.2) |
251 |
(0.4) |
586 |
(0.8) |
557 |
(0.6) |
| |
NRE Deposits |
1,591 |
(1.4) |
2,148 |
(2.0) |
1,882 |
(1.7) |
1,607 |
(1.5) |
1,546 |
(1.4) |
1,600 |
(1.4) |
| |
Total |
3,483 |
(1.0) |
4,396 |
(1.2) |
4,115 |
(1.0) |
4,267 |
(1.1) |
4,416 |
(1.1) |
4,440 |
(1.1) |
China |
FCNR(B) |
1,923 |
(2.8) |
2,924 |
(4.4) |
3,608 |
(5.6) |
3,806 |
(6.2) |
3,966 |
(6.6) |
4,429 |
(7.1) |
| |
Borrowings |
|
(0.0) |
|
(0.0) |
|
(0.0) |
|
(0.0) |
|
(0.0) |
|
(0.0) |
| |
NRE Deposits |
100 |
(0.1) |
87 |
(0.1) |
91 |
(0.1) |
110 |
(0.1) |
141 |
(0.1) |
109 |
(0.1) |
| |
Total |
2,125 |
(0.6) |
3,106 |
(0.9) |
3,741 |
(1.0) |
3,967 |
(1.0) |
4,161 |
(1.1) |
4,567 |
(1.2) |
France |
FCNR(B) |
91 |
(0.1) |
137 |
(0.2) |
109 |
(0.2) |
144 |
(0.2) |
170 |
(0.3) |
137 |
(0.2) |
| |
Borrowings |
390 |
(0.6) |
758 |
(1.3) |
870 |
(1.4) |
978 |
(1.6) |
2,601 |
(3.4) |
3,263 |
(3.6) |
| |
NRE Deposits |
216 |
(0.2) |
312 |
(0.3) |
326 |
(0.3) |
415 |
(0.4) |
490 |
(0.4) |
444 |
(0.4) |
| |
Total |
4,010 |
(1.1) |
4,582 |
(1.3) |
4,636 |
(1.2) |
4,447 |
(1.1) |
5,769 |
(1.5) |
6,581 |
(1.7) |
Germany |
FCNR(B) |
3,627 |
(5.3) |
4,641 |
(7.0) |
4,773 |
(7.4) |
4,947 |
(8.1) |
5,509 |
(9.1) |
6,652 |
(10.6) |
(includes ECB) |
Borrowings |
3,318 |
(5.4) |
3,149 |
(5.3) |
4,472 |
(7.1) |
3,919 |
(6.2) |
3,526 |
(4.6) |
3,502 |
(3.9) |
| |
NRE Deposits |
784 |
(0.7) |
906 |
(0.8) |
880 |
(0.8) |
721 |
(0.7) |
1,019 |
(0.9) |
1,055 |
(0.9) |
| |
Total |
9,858 |
(2.7) |
11,746 |
(3.3) |
12,992 |
(3.3) |
13,360 |
(3.3) |
14,296 |
(3.7) |
15,225 |
(3.9) |
Hong Kong |
FCNR(B) |
988 |
(1.5) |
860 |
(1.3) |
870 |
(1.3) |
779 |
(1.3) |
954 |
(1.6) |
966 |
(1.5) |
| |
Borrowings |
1,446 |
(2.4) |
1,176 |
(2.0) |
860 |
(1.4) |
981 |
(1.6) |
1,355 |
(1.8) |
1,832 |
(2.0) |
| |
NRE Deposits |
1,098 |
(1.0) |
1,124 |
(1.0) |
1,158 |
(1.0) |
966 |
(0.9) |
1,037 |
(0.9) |
901 |
(0.8) |
| |
Total |
9,486 |
(2.6) |
9,414 |
(2.6) |
9,714 |
(2.5) |
9,455 |
(2.4) |
9,738 |
(2.5) |
10,264 |
(2.6) |
India |
FCNR(B) |
|
(0.0) |
|
(0.0) |
|
(0.0) |
|
(0.0) |
280 |
(0.5) |
566 |
(0.9) |
| |
Borrowings |
4,292 |
(7.0) |
4,381 |
(7.3) |
5,303 |
(8.4) |
4,216 |
(6.7) |
4,908 |
(6.4) |
8,594 |
(9.5) |
| |
NRE Deposits |
|
(0.0) |
|
(0.0) |
|
(0.0) |
|
(0.0) |
|
(0.0) |
|
(0.0) |
| |
Total |
15,855 |
(4.4) |
16,753 |
(4.7) |
17,212 |
(4.4) |
16,386 |
(4.1) |
16,929 |
(4.3) |
21,583 |
(5.5) |
Japan |
FCNR(B) |
308 |
(0.5) |
420 |
(0.6) |
446 |
(0.7) |
370 |
(0.6) |
288 |
(0.5) |
175 |
(0.3) |
| |
Borrowings |
2,046 |
(3.3) |
2,200 |
(3.7) |
2,037 |
(3.2) |
1,949 |
(3.1) |
1,385 |
(1.8) |
1,783 |
(2.0) |
| |
NRE Deposits |
490 |
(0.4) |
645 |
(0.6) |
631 |
(0.6) |
788 |
(0.7) |
699 |
(0.6) |
758 |
(0.7) |
| |
Total |
4,653 |
(1.3) |
4,625 |
(1.3) |
4,965 |
(1.3) |
5,945 |
(1.5) |
4,784 |
(1.2) |
5,518 |
(1.4) |
Kuwait |
FCNR(B) |
1,572 |
(2.3) |
1,340 |
(2.0) |
1,632 |
(2.5) |
1,943 |
(3.2) |
1,504 |
(2.5) |
1,664 |
(2.7) |
| |
Borrowings |
|
(0.0) |
|
(0.0) |
2 |
(0.0) |
3 |
(0.0) |
2 |
(0.0) |
21 |
(0.0) |
| |
NRE Deposits |
3,542 |
(3.1) |
4,170 |
(3.8) |
4,078 |
(3.7) |
4,800 |
(4.4) |
4,808 |
(4.3) |
4,943 |
(4.3) |
| |
Total |
5,459 |
(1.5) |
5,821 |
(1.6) |
6,067 |
(1.5) |
7,078 |
(1.8) |
6,708 |
(1.7) |
6,966 |
(1.8) |
Mauritius |
FCNR(B) |
58 |
(0.1) |
53 |
(0.1) |
21 |
(0.0) |
27 |
(0.0) |
34 |
(0.1) |
15 |
(0.0) |
| |
Borrowings |
588 |
(1.0) |
852 |
(1.4) |
1,023 |
(1.6) |
1,090 |
(1.7) |
1,498 |
(1.9) |
1,435 |
(1.6) |
| |
NRE Deposits |
62 |
(0.1) |
74 |
(0.1) |
24 |
(0.0) |
48 |
(0.0) |
174 |
(0.2) |
35 |
(0.0) |
| |
Total |
17,254 |
(4.8) |
17,932 |
(5.0) |
26,070 |
(6.6) |
26,075 |
(6.5) |
21,040 |
(5.4) |
15,336 |
(3.9) |
Netherlands |
FCNR(B) |
99 |
(0.1) |
151 |
(0.2) |
93 |
(0.1) |
128 |
(0.2) |
286 |
(0.5) |
258 |
(0.4) |
| |
Borrowings |
2,312 |
(3.8) |
3,114 |
(5.2) |
3,296 |
(5.2) |
4,308 |
(6.9) |
5,885 |
(7.6) |
6,778 |
(7.5) |
| |
NRE Deposits |
224 |
(0.2) |
156 |
(0.1) |
286 |
(0.3) |
290 |
(0.3) |
367 |
(0.3) |
163 |
(0.1) |
| |
Total |
6,313 |
(1.8) |
7,057 |
(2.0) |
7,004 |
(1.8) |
8,175 |
(2.0) |
11,641 |
(3.0) |
12,250 |
(3.1) |
Statement IV: Country - wise Breakup of Major Component of International Liabilities of Banks (Based on LBS Statements) (Concld.) |
(Rs. crore) |
Country |
Major Components |
Q1: 2007 |
Q2: 2007 |
Q3: 2007 |
Q4: 2007 |
Q1: 2008 |
Q2:2008 |
No Specific Country |
FCNR(B) |
1,822 |
(2.7) |
2,142 |
(3.3) |
2,069 |
(3.2) |
1,964 |
(3.2) |
1,613 |
(2.7) |
1,744 |
(2.8) |
| |
Borrowings |
446 |
(0.7) |
474 |
(0.8) |
52 |
(0.1) |
271 |
(0.4) |
42 |
(0.1) |
52 |
(0.1) |
| |
NRE Deposits |
10,350 |
(9.2) |
11,083 |
(10.1) |
8,978 |
(8.1) |
11,201 |
(10.2) |
12,209 |
(11.0) |
12,984 |
(11.4) |
| |
Total |
18,316 |
(5.1) |
20,094 |
(5.6) |
19,857 |
(5.1) |
23,268 |
(5.8) |
24,881 |
(6.4) |
23,846 |
(6.1) |
Oman |
FCNR(B) |
859 |
(1.3) |
1,064 |
(1.6) |
1,157 |
(1.8) |
1,038 |
(1.7) |
614 |
(1.0) |
675 |
(1.1) |
| |
Borrowings |
30 |
(0.0) |
34 |
(0.1) |
57 |
(0.1) |
49 |
(0.1) |
133 |
(0.2) |
72 |
(0.1) |
| |
NRE Deposits |
2,738 |
(2.4) |
3,140 |
(2.9) |
2,977 |
(2.7) |
2,821 |
(2.6) |
2,736 |
(2.5) |
2,899 |
(2.5) |
| |
Total |
3,771 |
(1.0) |
4,409 |
(1.2) |
4,405 |
(1.1) |
4,094 |
(1.0) |
3,747 |
(1.0) |
3,866 |
(1.0) |
Saudi Arabia |
FCNR(B) |
1,244 |
(1.8) |
1,030 |
(1.6) |
1,275 |
(2.0) |
1,499 |
(2.5) |
1,537 |
(2.5) |
1,612 |
(2.6) |
| |
Borrowings |
200 |
(0.3) |
1 |
(0.0) |
1 |
(0.0) |
5 |
(0.0) |
4 |
(0.0) |
3 |
(0.0) |
| |
NRE Deposits |
7,606 |
(6.7) |
6,588 |
(6.0) |
7,623 |
(6.9) |
7,965 |
(7.3) |
7,474 |
(6.7) |
7,653 |
(6.7) |
| |
Total |
9,413 |
(2.6) |
8,126 |
(2.3) |
9,392 |
(2.4) |
9,902 |
(2.5) |
9,481 |
(2.4) |
9,640 |
(2.4) |
Singapore |
FCNR(B) |
406 |
(0.6) |
689 |
(1.0) |
760 |
(1.2) |
643 |
(1.1) |
513 |
(0.9) |
568 |
(0.9) |
| |
Borrowings |
9,440 |
(15.4) |
9,080 |
(15.2) |
10,437 |
(16.5) |
9,708 |
(15.5) |
9,754 |
(12.6) |
9,312 |
(10.3) |
| |
NRE Deposits |
1,814 |
(1.6) |
2,143 |
(1.9) |
2,839 |
(2.6) |
2,328 |
(2.1) |
1,967 |
(1.8) |
2,626 |
(2.3) |
| |
Total |
17,912 |
(5.0) |
17,941 |
(5.0) |
20,928 |
(5.3) |
20,613 |
(5.1) |
18,911 |
(4.8) |
18,815 |
(4.8) |
Spain |
FCNR(B) |
318 |
(0.5) |
459 |
(0.7) |
412 |
(0.6) |
273 |
(0.4) |
379 |
(0.6) |
458 |
(0.7) |
| |
Borrowings |
— |
(0.0) |
4 |
(0.0) |
6 |
(0.0) |
8 |
(0.0) |
5 |
(0.0) |
8 |
(0.0) |
| |
NRE Deposits |
272 |
(0.2) |
185 |
(0.2) |
198 |
(0.2) |
160 |
(0.1) |
238 |
(0.2) |
377 |
(0.3) |
| |
Total |
1,291 |
(0.4) |
3,028 |
(0.8) |
3,719 |
(0.9) |
3,794 |
(0.9) |
2,732 |
(0.7) |
2,765 |
(0.7) |
United Arab Emirates |
FCNR(B) |
9,110 |
(13.4) |
7,402 |
(11.2) |
7,569 |
(11.7) |
6,855 |
(11.2) |
4,133 |
(6.8) |
4,007 |
(6.4) |
| |
Borrowings |
175 |
(0.3) |
20 |
(0.0) |
26 |
(0.0) |
99 |
(0.2) |
63 |
(0.1) |
341 |
(0.4) |
| |
NRE Deposits |
17,654 |
(15.6) |
16,185 |
(14.7) |
17,917 |
(16.2) |
17,407 |
(15.9) |
17,896 |
(16.1) |
20,532 |
(18.0) |
| |
Total |
28,846 |
(8.0) |
25,721 |
(7.2) |
28,346 |
(7.2) |
27,497 |
(6.8) |
24,664 |
(6.3) |
27,374 |
(7.0) |
United Kingdom @ |
FCNR(B) |
18,753 |
(27.5) |
15,303 |
(23.2) |
15,284 |
(23.6) |
13,501 |
(22.1) |
15,226 |
(25.2) |
14,999 |
(23.9) |
| |
Borrowings |
9,031 |
(14.7) |
8,533 |
(14.3) |
11,626 |
(18.4) |
13,299 |
(21.2) |
18,453 |
(23.9) |
26,972 |
(29.7) |
| |
NRE Deposits |
15,027 |
(13.3) |
12,505 |
(11.4) |
12,144 |
(11.0) |
10,247 |
(9.4) |
9,010 |
(8.1) |
8,283 |
(7.2) |
| |
Total |
56,734 |
(15.7) |
49,384 |
(13.7) |
53,605 |
(13.6) |
54,350 |
(13.5) |
56,417 |
(14.4) |
64,851 |
(16.5) |
United States # |
FCNR(B) |
17,491 |
(25.7) |
17,252 |
(26.2) |
11,348 |
(17.5) |
10,700 |
(17.5) |
9,990 |
(16.6) |
10,412 |
(16.6) |
| |
Borrowings |
21,616 |
(35.2) |
19,928 |
(33.4) |
17,869 |
(28.3) |
16,856 |
(26.9) |
21,080 |
(27.3) |
20,022 |
(22.1) |
| |
NRE Deposits |
35,585 |
(31.5) |
34,772 |
(31.6) |
34,352 |
(31.1) |
33,005 |
(30.2) |
35,251 |
(31.7) |
34,567 |
(30.2) |
| |
Total |
109,684 |
(30.4) |
109,310 |
(30.4) |
114,471 |
(29.1) |
117,783 |
(29.3) |
107,453 |
(27.5) |
97,205 |
(24.7) |
Total |
FCNR(B) |
68,086 |
(100.0) |
65,834 |
(100.0) |
64,701 |
(100.0) |
61,181 |
(100.0) |
60,340 |
(100.0) |
62,730 |
(100.0) |
| |
Borrowings |
61,470 |
(100.0) |
59,662 |
(100.0) |
63,213 |
(100.0) |
62,776 |
(100.0) |
77,257 |
(100.0) |
90,791 |
(100.0) |
| |
NRE Deposits |
112,907 |
(100.0) |
109,974 |
(100.0) |
110,445 |
(100.0) |
109,400 |
(100.0) |
111,301 |
(100.0) |
114,316 |
(100.0) |
| |
Total |
360,698 |
(100.0) |
359,663 |
(100.0) |
392,821 |
(100.0) |
402,297 |
(100.0) |
390,857 |
(100.0) |
393,832 |
(100.0) |
@ : excluding Guernsey, Isle of Man and Jersey. # : includes Miday Island and Wake Islands.
‘-’ : nil/negligible.
Note: 1. Figures in brackets represent percentages to total in the respective group (column).
2. Totals may not tally due to rounding off.
3. Data have been revised for previous quarters.
4. Q1, Q2, Q3 and Q4 denote quarters ended March, June, September and December, respectively. |
Statement V: Country - wise Breakup of Major Component of International Assets of Banks (Based on LBS Statements) |
(Rs. crore) |
Country |
Major Components |
Q1: 2007 |
Q2: 2007 |
Q3: 2007 |
Q4: 2007 |
Q1: 2008 |
Q2:2008 |
Bahrain |
Export Bill |
76 |
(0.2) |
91 |
(0.2) |
67 |
(0.2) |
62 |
(0.1) |
65 |
(0.1) |
160 |
(0.3) |
| |
Nostro |
3,077 |
(4.6) |
3,066 |
(4.6) |
1,725 |
(3.2) |
465 |
(1.0) |
580 |
(1.3) |
465 |
(1.2) |
| |
Total |
3,579 |
(1.8) |
3,602 |
(1.8) |
2,290 |
(1.1) |
988 |
(0.5) |
1,141 |
(0.5) |
1,091 |
(0.5) |
Belgium |
Export Bill |
633 |
(1.5) |
686 |
(1.8) |
755 |
(1.8) |
809 |
(1.8) |
936 |
(1.9) |
961 |
(2.1) |
| |
Nostro |
596 |
(0.9) |
525 |
(0.8) |
239 |
(0.4) |
502 |
(1.1) |
342 |
(0.7) |
536 |
(1.4) |
| |
Total |
1,535 |
(0.8) |
1,508 |
(0.8) |
1,279 |
(0.6) |
1,729 |
(0.8) |
1,765 |
(0.8) |
1,798 |
(0.9) |
Canada |
Export Bill |
347 |
(0.8) |
425 |
(1.1) |
336 |
(0.8) |
326 |
(0.7) |
378 |
(0.8) |
339 |
(0.7) |
| |
Nostro |
449 |
(0.7) |
723 |
(1.1) |
370 |
(0.7) |
524 |
(1.1) |
755 |
(1.7) |
468 |
(1.3) |
| |
Total |
1,544 |
(0.8) |
1,928 |
(1.0) |
1,249 |
(0.6) |
1,451 |
(0.7) |
1,825 |
(0.8) |
1,429 |
(0.7) |
China |
Export Bill |
858 |
(2.1) |
1,234 |
(3.2) |
1,338 |
(3.3) |
1,314 |
(3.0) |
1,149 |
(2.3) |
1,244 |
(2.7) |
| |
Nostro |
2 |
(0.0) |
1 |
(0.0) |
1 |
(0.0) |
1 |
(0.0) |
0 |
(0.0) |
0 |
(0.0) |
| |
Total |
867 |
(0.4) |
1,248 |
(0.6) |
1,355 |
(0.7) |
1,398 |
(0.7) |
1,347 |
(0.6) |
1,464 |
(0.7) |
France |
Export Bill |
1,046 |
(2.6) |
675 |
(1.8) |
646 |
(1.6) |
626 |
(1.4) |
1,032 |
(2.1) |
926 |
(2.0) |
| |
Nostro |
2,000 |
(3.0) |
1,556 |
(2.3) |
769 |
(1.4) |
305 |
(0.7) |
339 |
(0.7) |
95 |
(0.3) |
| |
Total |
3,245 |
(1.6) |
2,432 |
(1.2) |
1,578 |
(0.8) |
1,253 |
(0.6) |
1,548 |
(0.7) |
1,190 |
(0.6) |
Germany |
Export Bill |
2,124 |
(5.2) |
1,341 |
(3.5) |
1,295 |
(3.2) |
1,562 |
(3.6) |
1,657 |
(3.4) |
1,384 |
(3.0) |
(includes ECB) |
Nostro |
3,192 |
(4.7) |
3,042 |
(4.6) |
1,567 |
(2.9) |
1,172 |
(2.5) |
1,828 |
(4.0) |
1,103 |
(3.0) |
| |
Total |
6,110 |
(3.0) |
5,051 |
(2.6) |
3,591 |
(1.8) |
3,424 |
(1.6) |
4,160 |
(1.9) |
3,261 |
(1.6) |
Hong Kong |
Export Bill |
2,469 |
(6.0) |
2,847 |
(7.4) |
2,906 |
(7.1) |
2,795 |
(6.4) |
2,927 |
(6.0) |
3,127 |
(6.8) |
| |
Nostro |
4,665 |
(6.9) |
6,890 |
(10.4) |
6,177 |
(11.4) |
3,796 |
(8.1) |
2,706 |
(5.9) |
3,067 |
(8.2) |
| |
Total |
7,915 |
(3.9) |
10,532 |
(5.3) |
9,857 |
(4.9) |
7,444 |
(3.5) |
6,784 |
(3.0) |
7,305 |
(3.5) |
India |
Export Bill |
|
— |
|
— |
|
— |
|
— |
|
— |
|
— |
| |
Nostro |
|
— |
|
— |
|
— |
|
— |
|
— |
|
— |
| |
Total |
75,339 |
(37.1) |
73,043 |
(37.1) |
87,930 |
(43.6) |
100,572 |
(47.9) |
108,614 |
(48.8) |
106,894 |
(51.3) |
Italy |
Export Bill |
1,344 |
(3.3) |
1,352 |
(3.5) |
1,263 |
(3.1) |
1,304 |
(3.0) |
1,464 |
(3.0) |
1,294 |
(2.8) |
| |
Nostro |
529 |
(0.8) |
138 |
(0.2) |
166 |
(0.3) |
109 |
(0.2) |
103 |
(0.2) |
85 |
(0.2) |
| |
Total |
1,884 |
(0.9) |
1,499 |
(0.8) |
1,519 |
(0.8) |
1,459 |
(0.7) |
1,577 |
(0.7) |
1,426 |
(0.7) |
Japan |
Export Bill |
474 |
(—) |
576 |
(—) |
488 |
(—) |
458 |
(—) |
516 |
(—) |
395 |
(—) |
| |
Nostro |
1,626 |
(—) |
853 |
(—) |
970 |
(—) |
792 |
(—) |
841 |
(—) |
871 |
(—) |
| |
Total |
2,717 |
(1.3) |
2,168 |
(1.1) |
2,238 |
(1.1) |
1,675 |
(0.8) |
1,837 |
(0.8) |
1,634 |
(0.8) |
Netherlands |
Export Bill |
316 |
(0.8) |
490 |
(1.3) |
490 |
(1.2) |
452 |
(1.0) |
625 |
(1.3) |
651 |
(1.4) |
| |
Nostro |
1,466 |
(2.2) |
1,155 |
(1.7) |
697 |
(1.3) |
611 |
(1.3) |
235 |
(0.5) |
62 |
(0.2) |
| |
Total |
1,800 |
(0.9) |
1,657 |
(0.8) |
1,196 |
(0.6) |
1,071 |
(0.5) |
867 |
(0.4) |
728 |
(0.3) |
Statement V: Country - wise Breakup of Major Component of International Assets of Banks (Based on LBS Statements) (Concld.) |
(Rs. crore) |
Country |
Major Components |
Q1: 2007 |
Q2: 2007 |
Q3: 2007 |
Q4: 2007 |
Q1: 2008 |
Q2:2008 |
No Specific Country |
Export Bill |
505 |
(1.2) |
333 |
(0.9) |
318 |
(0.8) |
302 |
(0.7) |
383 |
(0.8) |
667 |
(1.5) |
(country Unknown) |
Nostro |
464 |
(0.7) |
496 |
(0.7) |
479 |
(0.9) |
265 |
(0.6) |
167 |
(0.4) |
107 |
(0.3) |
| |
Total |
2,417 |
(1.2) |
2,277 |
(1.2) |
2,118 |
(1.1) |
1,859 |
(0.9) |
1,814 |
(0.8) |
1,648 |
(0.8) |
Singapore |
Export Bill |
1,936 |
(4.7) |
1,801 |
(4.7) |
1,689 |
(4.1) |
1,429 |
(3.3) |
1,431 |
(2.9) |
1,243 |
(2.7) |
| |
Nostro |
2,802 |
(4.2) |
2,883 |
(4.3) |
2,965 |
(5.4) |
3,142 |
(6.7) |
2,746 |
(6.0) |
2,052 |
(5.5) |
| |
Total |
6,341 |
(3.1) |
6,308 |
(3.2) |
6,269 |
(3.1) |
6,055 |
(2.9) |
5,689 |
(2.6) |
4,785 |
(2.3) |
Sri Lanka |
Export Bill |
335 |
(0.8) |
439 |
(1.1) |
674 |
(1.6) |
629 |
(1.4) |
604 |
(1.2) |
521 |
(1.1) |
| |
Nostro |
409 |
(0.6) |
513 |
(0.8) |
502 |
(0.9) |
364 |
(0.8) |
190 |
(0.4) |
59 |
(0.2) |
| |
Total |
1,081 |
(0.5) |
1,303 |
(0.7) |
1,530 |
(0.8) |
1,309 |
(0.6) |
1,124 |
(0.5) |
990 |
(0.5) |
Switzerland |
Export Bill |
384 |
(0.9) |
477 |
(1.2) |
385 |
(0.9) |
433 |
(1.0) |
421 |
(0.9) |
327 |
(0.7) |
(Includes Bis) |
Nostro |
1,836 |
(2.7) |
1,200 |
(1.8) |
642 |
(1.2) |
742 |
(1.6) |
648 |
(1.4) |
439 |
(1.2) |
| |
Total |
2,273 |
(1.1) |
1,721 |
(0.9) |
1,062 |
(0.5) |
1,216 |
(0.6) |
1,102 |
(0.5) |
796 |
(0.4) |
United Arab Emirates |
Export Bill |
2,786 |
(6.8) |
2,676 |
(7.0) |
2,946 |
(7.2) |
3,965 |
(9.0) |
4,535 |
(9.3) |
4,057 |
(8.8) |
| |
Nostro |
169 |
(0.3) |
327 |
(0.5) |
213 |
(0.4) |
1,368 |
(2.9) |
262 |
(0.6) |
64 |
(0.2) |
| |
Total |
4,540 |
(2.2) |
4,502 |
(2.3) |
4,627 |
(2.3) |
6,898 |
(3.3) |
6,458 |
(2.9) |
5,733 |
(2.7) |
United Kingdom@ |
Export Bill |
2,922 |
(7.2) |
1,952 |
(5.1) |
2,593 |
(6.3) |
3,082 |
(7.0) |
2,900 |
(5.9) |
3,158 |
(6.9) |
| |
Nostro |
9,098 |
(13.5) |
10,350 |
(15.5) |
6,807 |
(12.5) |
4,749 |
(10.1) |
7,105 |
(15.5) |
5,472 |
(14.7) |
| |
Total |
15,535 |
(7.7) |
15,605 |
(7.9) |
12,686 |
(6.3) |
10,632 |
(5.1) |
12,399 |
(5.6) |
10,988 |
(5.3) |
United States # |
Export Bill |
13,385 |
(32.8) |
13,030 |
(34.1) |
14,928 |
(36.5) |
15,563 |
(35.5) |
17,459 |
(35.6) |
16,289 |
(35.4) |
(Incl. Midway Is., |
Nostro |
30,550 |
(45.3) |
29,684 |
(44.6) |
27,974 |
(51.4) |
25,552 |
(54.5) |
24,788 |
(54.2) |
20,673 |
(55.5) |
Wake Islands) |
Total |
48,151 |
(23.7) |
47,022 |
(23.9) |
47,168 |
(23.4) |
45,635 |
(21.7) |
46,615 |
(20.9) |
41,412 |
(19.9) |
Total |
Export Bill |
40,846 |
(100.0) |
38,257 |
(100.0) |
40,852 |
(100.0) |
43,899 |
(100.0) |
49,011 |
(100.0) |
45,951 |
(100.0) |
| |
Nostro |
67,487 |
(100.0) |
66,564 |
(100.0) |
54,417 |
(100.0) |
46,863 |
(100.0) |
45,752 |
(100.0) |
37,252 |
(100.0) |
| |
Total |
202,973 |
(100.0) |
197,022 |
(100.0) |
201,549 |
(100.0) |
209,937 |
(100.0) |
222,711 |
(100.0) |
208,516 |
(100.0) |
@ : excluding Guernsey, Isle of Man and Jersey. # : includes Miday Island and Wake Islands. ‘-’ : nil/negligible.
Note: 1. Figures in brackets represent percentages to total in the respective group (column).
2. Totals may not tally due to rounding off.
3. Data have been revised for previous quarters.
4. Q1, Q2, Q3 and Q4 denote quarters ended March, June, September and December, respectively. |
Statement VI: International Liabilities/Assets of Banks Classified According to Country of Incorporation of Banks (Based on LBS Statements) - Amount Outstanding as at end |
(Rs. crore) |
Country |
International Liabilities |
Total All Sectors |
Position vis-a-vis Banks |
Q1: 2007 |
Q2: 2007 |
Q3: 2007 |
Q4: 2007 |
Q1: 2008 |
Q2:2008 |
Q1: 2007 |
Q2: 2007 |
Q3: 2007 |
Q4: 2007 |
Q1: 2008 |
Q2:2008 |
Bahrain |
330 |
303 |
297 |
222 |
257 |
215 |
59 |
59 |
59 |
19 |
19 |
19 |
| |
(0.1) |
(0.1) |
(0.1) |
(0.1) |
(0.1) |
(0.1) |
(0.1) |
(0.1) |
(0.1) |
(0.0) |
(0.0) |
(0.0) |
Bangladesh |
77 |
60 |
54 |
53 |
58 |
60 |
72 |
58 |
52 |
52 |
54 |
57 |
| |
(0.0) |
(0.0) |
(0.0) |
(0.0) |
(0.0) |
(0.0) |
(0.1) |
(0.1) |
(0.1) |
(0.1) |
(0.1) |
(0.0) |
Belgium |
563 |
541 |
582 |
591 |
687 |
693 |
523 |
504 |
546 |
555 |
651 |
651 |
| |
(0.2) |
(0.2) |
(0.1) |
(0.1) |
(0.2) |
(0.2) |
(0.6) |
(0.6) |
(0.6) |
(0.6) |
(0.6) |
(0.5) |
Canada |
1,786 |
1,531 |
1,963 |
2,195 |
2,591 |
3,151 |
1,667 |
1,414 |
1,873 |
2,101 |
2,488 |
2,991 |
| |
(0.5) |
(0.4) |
(0.5) |
(0.5) |
(0.7) |
(0.8) |
(1.9) |
(1.7) |
(2.1) |
(2.4) |
(2.4) |
(2.5) |
France |
2,766 |
3,607 |
3,730 |
3,779 |
4,330 |
4,642 |
1,980 |
2,855 |
2,829 |
2,672 |
3,242 |
3,647 |
| |
(0.8) |
(1.0) |
(0.9) |
(0.9) |
(1.1) |
(1.2) |
(2.3) |
(3.3) |
(3.2) |
(3.0) |
(3.1) |
(3.0) |
Germany |
4,880 |
4,741 |
7,757 |
8,823 |
11,100 |
8,751 |
1,723 |
2,425 |
2,232 |
3,182 |
3,816 |
3,764 |
(includes Ecb) |
(1.4) |
(1.3) |
(2.0) |
(2.2) |
(2.8) |
(2.2) |
(2.0) |
(2.8) |
(2.5) |
(3.6) |
(3.6) |
(3.1) |
Hong Kong |
17,327 |
16,947 |
20,939 |
23,785 |
25,257 |
23,817 |
4,957 |
5,197 |
5,694 |
6,057 |
8,917 |
8,421 |
| |
(4.8) |
(4.7) |
(5.3) |
(5.9) |
(6.5) |
(6.0) |
(5.8) |
(6.1) |
(6.4) |
(6.8) |
(8.4) |
(6.9) |
India |
292,215 |
293,053 |
315,445 |
321,229 |
299,095 |
293,028 |
56,024 |
54,503 |
55,345 |
50,989 |
57,755 |
62,638 |
| |
(81.0) |
(81.5) |
(80.3) |
(79.8) |
(76.5) |
(74.4) |
(65.1) |
(63.7) |
(61.8) |
(57.4) |
(54.7) |
(51.4) |
Japan |
717 |
861 |
1,138 |
1,189 |
1,212 |
1,809 |
559 |
683 |
1,012 |
1,128 |
1,144 |
1,719 |
| |
(0.2) |
(0.2) |
(0.3) |
(0.3) |
(0.3) |
(0.5) |
(0.6) |
(0.8) |
(1.1) |
(1.3) |
(1.1) |
(1.4) |
Mauritius |
149 |
158 |
164 |
142 |
129 |
120 |
115 |
115 |
113 |
110 |
106 |
94 |
| |
(0.0) |
(0.0) |
(0.0) |
(0.0) |
(0.0) |
(0.0) |
(0.1) |
(0.1) |
(0.1) |
(0.1) |
(0.1) |
(0.1) |
Netherlands |
7,974 |
8,863 |
8,938 |
9,760 |
11,573 |
12,582 |
6,664 |
7,734 |
7,699 |
8,534 |
10,295 |
11,263 |
| |
(2.2) |
(2.5) |
(2.3) |
(2.4) |
(3.0) |
(3.2) |
(7.7) |
(9.0) |
(8.6) |
(9.6) |
(9.8) |
(9.2) |
Oman |
209 |
205 |
216 |
260 |
219 |
407 |
20 |
27 |
35 |
35 |
48 |
55 |
| |
(0.1) |
(0.1) |
(0.1) |
(0.1) |
(0.1) |
(0.1) |
(0.0) |
(0.0) |
(0.0) |
(0.0) |
(0.0) |
(0.0) |
Singapore |
1,538 |
1,507 |
1,646 |
1,850 |
2,404 |
3,064 |
1,519 |
1,488 |
1,624 |
1,838 |
2,386 |
3,051 |
| |
(0.4) |
(0.4) |
(0.4) |
(0.5) |
(0.6) |
(0.8) |
(1.8) |
(1.7) |
(1.8) |
(2.1) |
(2.3) |
(2.5) |
South Korea |
220 |
200 |
185 |
161 |
202 |
296 |
216 |
182 |
165 |
159 |
199 |
258 |
| |
(0.1) |
(0.1) |
(0.0) |
(0.0) |
(0.1) |
(0.1) |
(0.3) |
(0.2) |
(0.2) |
(0.2) |
(0.2) |
(0.2) |
Sri Lanka |
89 |
84 |
85 |
77 |
83 |
81 |
53 |
50 |
51 |
50 |
49 |
47 |
| |
(0.0) |
(0.0) |
(0.0) |
(0.0) |
(0.0) |
(0.0) |
(0.1) |
(0.1) |
(0.1) |
(0.1) |
(0.0) |
(0.0) |
Taiwan, China |
281 |
261 |
231 |
204 |
123 |
84 |
281 |
261 |
230 |
204 |
123 |
79 |
| |
(0.1) |
(0.1) |
(0.1) |
(0.1) |
(0.0) |
(0.0) |
(0.3) |
(0.3) |
(0.3) |
(0.2) |
(0.1) |
(0.1) |
Thailand |
81 |
88 |
88 |
111 |
115 |
119 |
36 |
36 |
36 |
36 |
36 |
36 |
| |
(0.0) |
(0.0) |
(0.0) |
(0.0) |
(0.0) |
(0.0) |
(0.0) |
(0.0) |
(0.0) |
(0.0) |
(0.0) |
(0.0) |
United Arab |
482 |
464 |
482 |
443 |
412 |
413 |
103 |
98 |
96 |
105 |
108 |
91 |
Emirates |
(0.1) |
(0.1) |
(0.1) |
(0.1) |
(0.1) |
(0.1) |
(0.1) |
(0.1) |
(0.1) |
(0.1) |
(0.1) |
(0.1) |
United Kingdom |
10,109 |
8,282 |
10,356 |
10,068 |
11,923 |
17,388 |
3,110 |
2,826 |
4,053 |
4,963 |
6,361 |
10,808 |
| |
(2.8) |
(2.3) |
(2.6) |
(2.5) |
(3.1) |
(4.4) |
(3.6) |
(3.3) |
(4.5) |
(5.6) |
(6.0) |
(8.9) |
United States |
|
|
|
|
|
|
|
|
|
|
|
|
(Incl. Midway Is., |
18,813 |
17,835 |
18,453 |
17,281 |
19,015 |
23,113 |
6,255 |
4,991 |
5,732 |
5,928 |
7,684 |
12,150 |
Wake Islands) |
(5.2) |
(5.0) |
(4.7) |
(4.3) |
(4.9) |
(5.9) |
(7.3) |
(5.8) |
(6.4) |
(6.7) |
(7.3) |
(10.0) |
Total |
360,698 |
359,663 |
392,821 |
402,297 |
390,857 |
393,832 |
86,023 |
85,582 |
89,549 |
88,790 |
105,554 |
121,839 |
| |
(100.0) |
(100.0) |
(100.0) |
(100.0) |
(100.0) |
(100.0) |
(100.0) |
(100.0) |
(100.0) |
(100.0) |
(100.0) |
(100.0) |
Statement VI: International Liabilities/Assets of Banks Classified According to Country of Incorporation of Banks (Based on LBS Statements) - Amount Outstanding as at end |
(Rs. crore) |
Country |
International Asset |
Total All Sectors |
Position vis-a-vis Banks |
Q1: 2007 |
Q2: 2007 |
Q3: 2007 |
Q4: 2007 |
Q1: 2008 |
Q2:2008 |
Q1: 2007 |
Q2: 2007 |
Q3: 2007 |
Q4: 2007 |
Q1: 2008 |
Q2:2008 |
Bahrain |
125 |
166 |
135 |
158 |
309 |
344 |
44 |
92 |
40 |
35 |
28 |
14 |
| |
(0.1) |
(0.1) |
(0.1) |
(0.1) |
(0.1) |
(0.2) |
(0.0) |
(0.1) |
(0.1) |
(0.1) |
(0.0) |
(0.0) |
Bangladesh |
25 |
16 |
15 |
14 |
20 |
12 |
19 |
12 |
9 |
9 |
12 |
9 |
| |
(0.0) |
(0.0) |
(0.0) |
(0.0) |
(0.0) |
(0.0) |
(0.0) |
(0.0) |
(0.0) |
(0.0) |
(0.0) |
(0.0) |
Belgium |
385 |
373 |
408 |
418 |
472 |
524 |
88 |
68 |
76 |
54 |
59 |
78 |
| |
(0.2) |
(0.2) |
(0.2) |
(0.2) |
(0.2) |
(0.3) |
(0.1) |
(0.1) |
(0.1) |
(0.1) |
(0.1) |
(0.1) |
Canada |
1,284 |
1,178 |
1,645 |
2,155 |
2,640 |
2,492 |
64 |
51 |
16 |
7 |
76 |
14 |
| |
(0.6) |
(0.6) |
(0.8) |
(1.0) |
(1.2) |
(1.2) |
(0.1) |
(0.1) |
(0.0) |
(0.0) |
(0.1) |
(0.0) |
France |
2,049 |
544 |
323 |
629 |
1,038 |
816 |
1,756 |
278 |
94 |
262 |
284 |
97 |
| |
(1.0) |
(0.3) |
(0.2) |
(0.3) |
(0.5) |
(0.4) |
(2.0) |
(0.3) |
(0.1) |
(0.4) |
(0.4) |
(0.2) |
Germany |
4,536 |
1,022 |
2,465 |
1,822 |
2,746 |
2,356 |
3,479 |
199 |
1,187 |
701 |
1,060 |
791 |
(includes Ecb) |
(2.2) |
(0.5) |
(1.2) |
(0.9) |
(1.2) |
(1.1) |
(3.9) |
(0.2) |
(1.6) |
(1.0) |
(1.6) |
(1.4) |
Hong Kong |
8,142 |
8,310 |
7,593 |
7,386 |
8,408 |
7,354 |
4,636 |
4,688 |
3,674 |
2,804 |
2,522 |
1,162 |
| |
(4.0) |
(4.2) |
(3.8) |
(3.5) |
(3.8) |
(3.5) |
(5.2) |
(5.4) |
(5.0) |
(4.2) |
(3.8) |
(2.0) |
India |
158,374 |
156,763 |
159,587 |
166,004 |
166,558 |
150,564 |
69,447 |
70,396 |
57,842 |
54,828 |
52,321 |
43,785 |
| |
(78.0) |
(79.6) |
(79.2) |
(79.1) |
(74.8) |
(72.2) |
(78.4) |
(81.7) |
(78.7) |
(81.3) |
(79.0) |
(76.0) |
Japan |
323 |
482 |
552 |
390 |
570 |
1,273 |
269 |
381 |
510 |
262 |
202 |
322 |
| |
(0.2) |
(0.2) |
(0.3) |
(0.2) |
(0.3) |
(0.6) |
(0.3) |
(0.4) |
(0.7) |
(0.4) |
(0.3) |
(0.6) |
Mauritius |
154 |
82 |
27 |
12 |
22 |
20 |
111 |
43 |
17 |
6 |
2 |
2 |
| |
(0.1) |
(0.0) |
(0.0) |
(0.0) |
(0.0) |
(0.0) |
(0.1) |
(0.0) |
(0.0) |
(0.0) |
(0.0) |
(0.0) |
Netherlands |
6,126 |
5,979 |
6,806 |
8,158 |
8,236 |
7,903 |
593 |
729 |
198 |
426 |
319 |
217 |
| |
(3.0) |
(3.0) |
(3.4) |
(3.9) |
(3.7) |
(3.8) |
(0.7) |
(0.8) |
(0.3) |
(0.6) |
(0.5) |
(0.4) |
Oman |
2 |
6 |
7 |
4 |
2 |
0 |
1 |
5 |
5 |
4 |
2 |
|
| |
(0.0) |
(0.0) |
(0.0) |
(0.0) |
(0.0) |
(0.0) |
(0.0) |
(0.0) |
(0.0) |
(0.0) |
(0.0) |
|
Singapore |
3,647 |
3,218 |
3,846 |
4,041 |
4,367 |
4,807 |
2,290 |
2,018 |
2,421 |
2,533 |
2,661 |
2,940 |
| |
(1.8) |
(1.6) |
(1.9) |
(1.9) |
(2.0) |
(2.3) |
(2.6) |
(2.3) |
(3.3) |
(3.8) |
(4.0) |
(5.1) |
South Korea |
30 |
38 |
32 |
44 |
52 |
77 |
13 |
28 |
20 |
32 |
10 |
42 |
| |
(0.0) |
(0.0) |
(0.0) |
(0.0) |
(0.0) |
(0.0) |
(0.0) |
(0.0) |
(0.0) |
(0.0) |
(0.0) |
(0.1) |
Sri Lanka |
8 |
5 |
10 |
7 |
10 |
10 |
4 |
3 |
6 |
3 |
4 |
3 |
| |
(0.0) |
(0.0) |
(0.0) |
(0.0) |
(0.0) |
(0.0) |
(0.0) |
(0.0) |
(0.0) |
(0.0) |
(0.0) |
(0.0) |
Taiwan, China |
6 |
4 |
5 |
17 |
7 |
8 |
1 |
1 |
3 |
10 |
1 |
4 |
| |
(0.0) |
(0.0) |
(0.0) |
(0.0) |
(0.0) |
(0.0) |
(0.0) |
(0.0) |
(0.0) |
(0.0) |
(0.0) |
(0.0) |
Thailand |
21 |
18 |
20 |
9 |
11 |
11 |
20 |
17 |
20 |
9 |
11 |
9 |
| |
(0.0) |
(0.0) |
(0.0) |
(0.0) |
(0.0) |
(0.0) |
(0.0) |
(0.0) |
(0.0) |
(0.0) |
(0.0) |
(0.0) |
United Arab |
98 |
62 |
61 |
52 |
60 |
89 |
45 |
18 |
18 |
20 |
18 |
31 |
Emirates |
(0.0) |
(0.0) |
(0.0) |
(0.0) |
(0.0) |
(0.0) |
(0.1) |
(0.0) |
(0.0) |
(0.0) |
(0.0) |
(0.1) |
United Kingdom@ |
8,059 |
6,953 |
6,680 |
7,779 |
12,511 |
16,419 |
1,897 |
1,556 |
1,271 |
2,142 |
3,341 |
4,904 |
| |
(4.0) |
(3.5) |
(3.3) |
(3.7) |
(5.6) |
(7.9) |
(2.1) |
(1.8) |
(1.7) |
(3.2) |
(5.0) |
(8.5) |
United States # |
|
|
|
|
|
|
|
|
|
|
|
|
(Incl. Midway Is., |
9,577 |
11,800 |
11,333 |
10,835 |
14,671 |
13,438 |
3,790 |
5,605 |
6,073 |
3,301 |
3,319 |
3,181 |
Wake Islands) |
(4.7) |
(6.0) |
(5.6) |
(5.2) |
(6.6) |
(6.4) |
(4.3) |
(6.5) |
(8.3) |
(4.9) |
(5.0) |
(5.5) |
Total |
202,973 |
197,022 |
201,549 |
209,937 |
222,711 |
208,516 |
88,565 |
86,189 |
73,502 |
67,447 |
66,252 |
57,607 |
| |
(100.0) |
(100.0) |
(100.0) |
(100.0) |
(100.0) |
(100.0) |
(100.0) |
(100.0) |
(100.0) |
(100.0) |
(100.0) |
(100.0) |
@ : Excluding Guernsey, Isle of Man and Jersey. # : Includes Miday Island and Wake Islands.
‘—’ : Nil/Negligible.
Notes : 1. Figures in brackets represent percentages to total in the respective group (column).
2. Totals may not tally due to rounding off .
3. Data have been revised for previous quarters.
4. Q1, Q2, Q3 and Q4 denote quarters ended March, June, September and December, respectively. |
Statement VII : Residual Maturity and Sector-wise Classification of Consolidated International Claims of Banks (Based on CBS Statements) - Amount Outstanding as at end of Period on Immediate Country Risk Basis |
(Rs. crore) |
Country of Transacting Units |
Period |
Total International Claims |
Residual Maturity |
Sector |
Short-Term |
Long-Term |
Unallocated |
Bank |
Non-Bank Public |
Non-Bank Private |
Total Intl. Claims |
Mar-2007 |
149,258 |
109,481 |
39,775 |
2 |
69,781 |
871 |
78,607 |
| |
Jun-2007 |
158,382 |
113,324 |
45,058 |
0 |
75,178 |
719 |
82,485 |
| |
Sep-2007 |
157,201 |
108,775 |
47,740 |
686 |
66,410 |
546 |
90,246 |
| |
Dec-2007 |
153,353 |
105,930 |
45,722 |
1,701 |
58,943 |
767 |
93,643 |
| |
Mar-2008 |
169,481 |
117,279 |
50,232 |
1,970 |
62,394 |
748 |
106,339 |
| |
Jun-2008 |
171,730 |
113,983 |
55,549 |
2,199 |
65,021 |
828 |
105,881 |
Australia |
Mar-2007 |
2,275 |
1,435 |
840 |
— |
1,961 |
2 |
312 |
| |
Jun-2007 |
2,111 |
1,200 |
911 |
— |
1,856 |
0 |
255 |
| |
Sep-2007 |
1,987 |
1,101 |
886 |
— |
1,738 |
0 |
249 |
| |
Dec-2007 |
2,176 |
1,039 |
1,137 |
— |
1,613 |
2 |
560 |
| |
Mar-2008 |
2,042 |
982 |
1,060 |
— |
1,582 |
1 |
460 |
| |
Jun-2008 |
2,081 |
957 |
1,124 |
— |
1,485 |
2 |
594 |
Austria |
Mar-2007 |
1,786 |
1,478 |
308 |
— |
1,687 |
— |
98 |
| |
Jun-2007 |
1,624 |
1,387 |
237 |
— |
1,491 |
— |
133 |
| |
Sep-2007 |
960 |
785 |
175 |
— |
807 |
— |
152 |
| |
Dec-2007 |
850 |
683 |
167 |
— |
721 |
— |
129 |
| |
Mar-2008 |
1,123 |
1,043 |
80 |
— |
1,041 |
— |
82 |
| |
Jun-2008 |
921 |
794 |
126 |
— |
861 |
— |
60 |
Bahamas |
Mar-2007 |
1,136 |
1,089 |
47 |
— |
218 |
— |
918 |
| |
Jun-2007 |
1,059 |
912 |
147 |
— |
143 |
— |
916 |
| |
Sep-2007 |
1,005 |
871 |
133 |
— |
105 |
— |
900 |
| |
Dec-2007 |
904 |
794 |
110 |
— |
87 |
— |
817 |
| |
Mar-2008 |
898 |
799 |
99 |
— |
— |
— |
898 |
| |
Jun-2008 |
886 |
865 |
20 |
— |
64 |
— |
822 |
Bahrain |
Mar-2007 |
2,610 |
1,152 |
1,458 |
— |
1,876 |
— |
734 |
| |
Jun-2007 |
3,624 |
2,099 |
1,525 |
— |
3,088 |
— |
536 |
| |
Sep-2007 |
3,405 |
1,906 |
1,499 |
— |
2,815 |
— |
590 |
| |
Dec-2007 |
2,388 |
1,111 |
1,278 |
— |
1,919 |
— |
470 |
| |
Mar-2008 |
2,094 |
849 |
1,245 |
— |
1,654 |
— |
440 |
| |
Jun-2008 |
2,780 |
1,325 |
1,455 |
— |
2,530 |
— |
250 |
Belgium |
Mar-2007 |
3,389 |
2,980 |
410 |
— |
841 |
— |
2,548 |
| |
Jun-2007 |
3,332 |
2,872 |
460 |
— |
938 |
— |
2,394 |
| |
Sep-2007 |
3,323 |
3,012 |
311 |
— |
893 |
— |
2,430 |
| |
Dec-2007 |
3,403 |
3,125 |
278 |
— |
673 |
— |
2,730 |
| |
Mar-2008 |
3,886 |
3,675 |
210 |
— |
1,286 |
— |
2,599 |
| |
Jun-2008 |
3,361 |
3,331 |
29 |
— |
1,060 |
— |
2,300 |
Canada |
Mar-2007 |
1,956 |
1,492 |
465 |
— |
1,468 |
1 |
486 |
| |
Jun-2007 |
2,451 |
1,644 |
807 |
— |
1,822 |
1 |
628 |
| |
Sep-2007 |
2,346 |
1,001 |
1,096 |
250 |
1,741 |
1 |
604 |
| |
Dec-2007 |
2,597 |
847 |
1,015 |
735 |
1,859 |
3 |
735 |
| |
Mar-2008 |
4,019 |
1,361 |
2,172 |
486 |
1,741 |
2 |
2,276 |
|
Jun-2008 |
5,388 |
2,221 |
2,565 |
602 |
2,547 |
1 |
2,840 |
Cayman Islands |
Mar-2007 |
476 |
73 |
403 |
— |
95 |
— |
381 |
| |
Jun-2007 |
553 |
28 |
526 |
— |
40 |
— |
513 |
| |
Sep-2007 |
543 |
43 |
500 |
— |
57 |
— |
486 |
| |
Dec-2007 |
717 |
15 |
701 |
— |
58 |
— |
658 |
| |
Mar-2008 |
773 |
47 |
726 |
— |
47 |
69 |
657 |
| |
Jun-2008 |
1,148 |
902 |
246 |
— |
83 |
— |
1,066 |
Statement VII: Residual Maturity and Sector-wise Classification of Consolidated International Claims of Banks (Based on CBS Statements) - Amount Outstanding as at end of Period on Immediate Country Risk Basis (Contd.) |
(Rs. crore) |
Country of Transacting Units |
Period |
Total International Claims |
Residual Maturity |
Sector |
Short-Term |
Long-Term |
Unallocated |
Bank |
Non-Bank Public |
Non-Bank Private |
China |
Mar-2007 |
737 |
725 |
12 |
— |
2 |
— |
735 |
| |
Jun-2007 |
1,128 |
1,114 |
14 |
— |
1 |
— |
1,127 |
| |
Sep-2007 |
1,305 |
1,264 |
42 |
— |
10 |
— |
1,296 |
| |
Dec-2007 |
1,355 |
1,283 |
73 |
— |
27 |
— |
1,328 |
| |
Mar-2008 |
1,026 |
962 |
65 |
— |
— |
— |
1,026 |
| |
Jun-2008 |
1,312 |
1,133 |
179 |
— |
— |
— |
1,311 |
Cyprus |
Mar-2007 |
746 |
610 |
136 |
— |
113 |
— |
633 |
| |
Jun-2007 |
645 |
473 |
172 |
— |
80 |
— |
565 |
| |
Sep-2007 |
1,694 |
1,362 |
331 |
— |
173 |
— |
1,521 |
| |
Dec-2007 |
2,161 |
1,676 |
485 |
— |
173 |
— |
1,989 |
| |
Mar-2008 |
2,864 |
1,713 |
1,151 |
— |
232 |
— |
2,632 |
| |
Jun-2008 |
2,444 |
1,417 |
1,027 |
— |
185 |
— |
2,259 |
Denmark |
Mar-2007 |
1,654 |
1,357 |
298 |
— |
1,493 |
— |
161 |
| |
Jun-2007 |
1,311 |
1,018 |
292 |
— |
1,191 |
— |
119 |
| |
Sep-2007 |
1,126 |
871 |
255 |
— |
1,059 |
— |
67 |
| |
Dec-2007 |
1,001 |
709 |
292 |
— |
870 |
— |
132 |
| |
Mar-2008 |
1,660 |
1,347 |
313 |
— |
1,430 |
— |
229 |
| |
Jun-2008 |
1,516 |
1,186 |
330 |
— |
1,400 |
— |
116 |
France |
Mar-2007 |
3,833 |
3,225 |
608 |
— |
2,943 |
— |
890 |
| |
Jun-2007 |
3,854 |
3,244 |
611 |
— |
2,871 |
— |
984 |
| |
Sep-2007 |
2,202 |
1,655 |
547 |
— |
1,228 |
— |
974 |
| |
Dec-2007 |
2,126 |
1,675 |
451 |
— |
1,094 |
— |
1,032 |
| |
Mar-2008 |
2,969 |
2,074 |
895 |
— |
1,535 |
— |
1,434 |
| |
Jun-2008 |
3,456 |
2,377 |
1,079 |
— |
2,004 |
— |
1,452 |
Germany(includes ECB) |
Mar-2007 |
7,234 |
6,314 |
920 |
— |
4,973 |
72 |
2,188 |
| |
Jun-2007 |
6,721 |
5,369 |
1,351 |
— |
4,891 |
77 |
1,753 |
| |
Sep-2007 |
6,886 |
5,259 |
1,627 |
— |
5,243 |
61 |
1,582 |
| |
Dec-2007 |
6,896 |
5,212 |
1,645 |
40 |
4,905 |
57 |
1,934 |
| |
Mar-2008 |
10,607 |
8,572 |
1,600 |
435 |
5,266 |
43 |
5,299 |
| |
Jun-2008 |
10,300 |
8,481 |
1,492 |
327 |
5,157 |
144 |
4,998 |
Hong Kong |
Mar-2007 |
8,977 |
7,510 |
1,468 |
— |
5,855 |
— |
3,122 |
| |
Jun-2007 |
11,066 |
9,199 |
1,867 |
— |
7,585 |
2 |
3,480 |
| |
Sep-2007 |
11,477 |
9,485 |
1,992 |
— |
7,209 |
— |
4,268 |
| |
Dec-2007 |
10,487 |
9,048 |
1,438 |
— |
6,334 |
— |
4,152 |
| |
Mar-2008 |
9,792 |
9,092 |
700 |
— |
5,444 |
— |
4,347 |
| |
Jun-2008 |
9,978 |
8,614 |
1,364 |
— |
5,299 |
— |
4,679 |
Indonesia |
Mar-2007 |
1,228 |
811 |
417 |
— |
408 |
— |
820 |
| |
Jun-2007 |
1,011 |
567 |
444 |
— |
253 |
— |
758 |
| |
Sep-2007 |
746 |
377 |
370 |
— |
16 |
— |
730 |
| |
Dec-2007 |
985 |
568 |
417 |
— |
16 |
— |
969 |
| |
Mar-2008 |
1,057 |
592 |
465 |
— |
17 |
— |
1,039 |
| |
Jun-2008 |
1,343 |
899 |
444 |
— |
19 |
— |
1,325 |
Ireland |
Mar-2007 |
1,018 |
848 |
170 |
— |
740 |
— |
278 |
| |
Jun-2007 |
841 |
638 |
204 |
— |
645 |
— |
196 |
| |
Sep-2007 |
593 |
423 |
170 |
— |
488 |
— |
106 |
| |
Dec-2007 |
615 |
372 |
243 |
— |
347 |
— |
268 |
| |
Mar-2008 |
814 |
451 |
363 |
— |
294 |
— |
520 |
| |
Jun-2008 |
811 |
405 |
406 |
— |
353 |
— |
457 |
Statement VII: Residual Maturity and Sector-wise Classification of Consolidated International Claims of Banks (Based on CBS Statements) - Amount Outstanding as at end of Period on Immediate Country Risk Basis (Contd.) |
(Rs. crore) |
Country of Transacting Units |
Period |
Total International Claims |
Residual Maturity |
Sector |
Short-Term |
Long-Term |
Unallocated |
Bank |
Non-Bank Public |
Non-Bank Private |
Italy |
Mar-2007 |
3,024 |
2,067 |
957 |
— |
1,711 |
— |
1,313 |
| |
Jun-2007 |
2,292 |
1,611 |
681 |
— |
978 |
— |
1,314 |
| |
Sep-2007 |
2,508 |
1,744 |
763 |
— |
1,200 |
— |
1,307 |
| |
Dec-2007 |
2,493 |
1,688 |
805 |
— |
1,176 |
— |
1,317 |
| |
Mar-2008 |
2,768 |
1,866 |
902 |
— |
1,359 |
— |
1,409 |
| |
Jun-2008 |
2,541 |
1,510 |
1,031 |
— |
1,157 |
— |
1,384 |
Japan |
Mar-2007 |
1,947 |
1,544 |
403 |
— |
1,225 |
— |
722 |
| |
Jun-2007 |
1,525 |
1,313 |
212 |
— |
935 |
36 |
554 |
| |
Sep-2007 |
1,603 |
1,472 |
131 |
— |
1,103 |
4 |
495 |
| |
Dec-2007 |
1,205 |
1,003 |
201 |
— |
693 |
1 |
510 |
| |
Mar-2008 |
1,232 |
1,107 |
125 |
— |
647 |
41 |
544 |
| |
Jun-2008 |
1,675 |
1,339 |
336 |
— |
1,077 |
3 |
596 |
Kazakhstan |
Mar-2007 |
809 |
326 |
483 |
— |
317 |
— |
492 |
| |
Jun-2007 |
825 |
503 |
322 |
— |
479 |
— |
346 |
| |
Sep-2007 |
826 |
528 |
298 |
— |
427 |
— |
400 |
| |
Dec-2007 |
807 |
516 |
291 |
— |
330 |
— |
478 |
| |
Mar-2008 |
764 |
515 |
248 |
— |
261 |
— |
503 |
| |
Jun-2008 |
647 |
415 |
232 |
— |
236 |
— |
411 |
Luxembourg |
Mar-2007 |
864 |
467 |
397 |
— |
153 |
— |
711 |
| |
Jun-2007 |
657 |
277 |
380 |
— |
137 |
— |
520 |
| |
Sep-2007 |
636 |
302 |
334 |
— |
130 |
— |
506 |
| |
Dec-2007 |
555 |
244 |
311 |
— |
131 |
— |
425 |
| |
Mar-2008 |
6,111 |
3,954 |
2,157 |
— |
1,919 |
— |
4,192 |
| |
Jun-2008 |
5,641 |
3,706 |
1,934 |
1 |
1,742 |
— |
3,899 |
Mauritius |
Mar-2007 |
720 |
450 |
270 |
— |
178 |
— |
542 |
| |
Jun-2007 |
579 |
290 |
289 |
— |
43 |
— |
536 |
| |
Sep-2007 |
736 |
274 |
462 |
— |
17 |
— |
719 |
| |
Dec-2007 |
688 |
223 |
465 |
— |
46 |
— |
643 |
| |
Mar-2008 |
740 |
230 |
510 |
— |
82 |
— |
658 |
| |
Jun-2008 |
933 |
294 |
639 |
— |
67 |
— |
866 |
Netherlands |
Mar-2007 |
4,510 |
3,121 |
1,390 |
— |
1,731 |
— |
2,779 |
| |
Jun-2007 |
4,600 |
3,094 |
1,506 |
— |
2,481 |
— |
2,119 |
| |
Sep-2007 |
3,918 |
2,335 |
1,582 |
— |
1,516 |
— |
2,402 |
| |
Dec-2007 |
4,312 |
2,382 |
1,930 |
— |
1,559 |
— |
2,753 |
| |
Mar-2008 |
5,266 |
2,261 |
3,004 |
— |
1,264 |
— |
4,002 |
| |
Jun-2008 |
5,244 |
2,162 |
3,082 |
— |
1,188 |
— |
4,056 |
Nigeria |
Mar-2007 |
311 |
156 |
155 |
— |
— |
77 |
234 |
| |
Jun-2007 |
271 |
79 |
193 |
— |
57 |
75 |
139 |
| |
Sep-2007 |
368 |
197 |
171 |
— |
124 |
56 |
188 |
| |
Dec-2007 |
482 |
353 |
129 |
— |
233 |
55 |
194 |
| |
Mar-2008 |
698 |
496 |
202 |
— |
361 |
42 |
295 |
| |
Jun-2008 |
636 |
515 |
121 |
— |
314 |
31 |
290 |
Norway |
Mar-2007 |
1,137 |
790 |
347 |
— |
919 |
29 |
188 |
| |
Jun-2007 |
1,523 |
1,085 |
438 |
— |
1,211 |
— |
313 |
| |
Sep-2007 |
901 |
394 |
507 |
— |
516 |
— |
385 |
| |
Dec-2007 |
763 |
68 |
695 |
— |
214 |
— |
548 |
| |
Mar-2008 |
961 |
203 |
758 |
— |
247 |
— |
713 |
| |
Jun-2008 |
882 |
111 |
771 |
— |
193 |
— |
689 |
Statement VII: Residual Maturity and Sector-wise Classification of Consolidated International Claims of Banks (Based on CBS Statements) - Amount outstanding as at end of Period on Immediate Country Risk Basis (Concld.) |
(Rs. crore) |
Country of Transacting Units |
Period |
Total International Claims |
Residual Maturity |
Sector |
Short-Term |
Long-Term |
Unallocated |
Bank |
Non-Bank Public |
Non-Bank Private |
Russia |
Mar-2007 |
5,015 |
2,790 |
2,225 |
— |
2,534 |
1 |
2,480 |
| |
Jun-2007 |
5,400 |
3,371 |
2,030 |
— |
2,649 |
— |
2,751 |
| |
Sep-2007 |
5,418 |
3,357 |
2,061 |
— |
2,663 |
— |
2,755 |
| |
Dec-2007 |
6,001 |
3,944 |
1,959 |
99 |
3,433 |
— |
2,568 |
| |
Mar-2008 |
6,011 |
3,950 |
1,962 |
99 |
3,353 |
— |
2,658 |
| |
Jun-2008 |
5,573 |
3,569 |
1,897 |
106 |
3,162 |
— |
2,411 |
Saudi Arabia |
Mar-2007 |
778 |
581 |
197 |
— |
162 |
2 |
614 |
| |
Jun-2007 |
632 |
391 |
241 |
— |
11 |
2 |
619 |
| |
Sep-2007 |
571 |
359 |
212 |
— |
10 |
2 |
560 |
| |
Dec-2007 |
664 |
424 |
240 |
— |
9 |
1 |
654 |
| |
Mar-2008 |
586 |
347 |
239 |
— |
11 |
1 |
574 |
| |
Jun-2008 |
660 |
372 |
288 |
— |
7 |
1 |
652 |
Singapore |
Mar-2007 |
8,921 |
5,562 |
3,360 |
— |
3,324 |
1 |
5,596 |
| |
Jun-2007 |
8,514 |
4,528 |
3,986 |
— |
3,411 |
— |
5,103 |
| |
Sep-2007 |
10,561 |
6,204 |
4,357 |
— |
3,940 |
— |
6,621 |
| |
Dec-2007 |
11,749 |
5,872 |
5,877 |
— |
4,046 |
— |
7,703 |
| |
Mar-2008 |
11,918 |
6,194 |
5,724 |
— |
4,165 |
— |
7,753 |
| |
Jun-2008 |
11,714 |
6,134 |
5,580 |
— |
4,210 |
1 |
7,503 |
South Korea |
Mar-2007 |
1,010 |
514 |
496 |
— |
799 |
— |
211 |
| |
Jun-2007 |
853 |
343 |
511 |
— |
703 |
— |
150 |
| |
Sep-2007 |
857 |
363 |
494 |
— |
628 |
— |
228 |
| |
Dec-2007 |
699 |
279 |
420 |
— |
495 |
— |
204 |
| |
Mar-2008 |
963 |
513 |
450 |
— |
705 |
— |
258 |
| |
Jun-2008 |
945 |
500 |
444 |
— |
701 |
— |
244 |
Spain |
Mar-2007 |
769 |
695 |
73 |
— |
237 |
— |
532 |
| |
Jun-2007 |
929 |
856 |
73 |
— |
354 |
— |
575 |
| |
Sep-2007 |
944 |
845 |
99 |
— |
295 |
— |
650 |
| |
Dec-2007 |
859 |
757 |
102 |
— |
160 |
— |
699 |
| |
Mar-2008 |
921 |
843 |
79 |
— |
18 |
— |
903 |
| |
Jun-2008 |
830 |
744 |
86 |
— |
— |
— |
830 |
Sri Lanka |
Mar-2007 |
2,064 |
1,577 |
487 |
— |
591 |
205 |
1,268 |
| |
Jun-2007 |
1,903 |
1,389 |
515 |
— |
401 |
101 |
1,402 |
| |
Sep-2007 |
2,083 |
1,404 |
679 |
— |
402 |
98 |
1,583 |
| |
Dec-2007 |
2,114 |
1,608 |
506 |
— |
479 |
237 |
1,398 |
| |
Mar-2008 |
2,434 |
2,007 |
427 |
— |
1,025 |
192 |
1,217 |
| |
Jun-2008 |
2,456 |
2,021 |
434 |
1 |
989 |
331 |
1,136 |
Sweden |
Mar-2007 |
780 |
746 |
34 |
— |
669 |
— |
112 |
| |
Jun-2007 |
1,089 |
1,044 |
46 |
— |
935 |
— |
155 |
| |
Sep-2007 |
961 |
925 |
36 |
— |
857 |
— |
104 |
| |
Dec-2007 |
938 |
904 |
35 |
— |
811 |
— |
127 |
| |
Mar-2008 |
886 |
843 |
43 |
— |
693 |
— |
193 |
| |
Jun-2008 |
934 |
740 |
194 |
— |
784 |
— |
149 |
Switzerland (Includes BIS) |
Mar-2007 |
1,925 |
1,619 |
307 |
— |
1,268 |
1 |
656 |
| |
Jun-2007 |
2,521 |
2,103 |
418 |
— |
1,377 |
— |
1,144 |
| |
Sep-2007 |
1,884 |
1,383 |
501 |
— |
765 |
— |
1,119 |
| |
Dec-2007 |
1,807 |
1,393 |
414 |
— |
792 |
1 |
1,013 |
| |
Mar-2008 |
1,746 |
1,432 |
314 |
— |
761 |
— |
984 |
| |
Jun-2008 |
1,718 |
1,302 |
416 |
— |
604 |
3 |
1,112 |
Statement VII: Residual Maturity and Sector-wise Classification of Consolidated International Claims of Banks (Based on CBS Statements) - Amount Outstanding as at end of Period on Immediate Country Risk Basis (Concld.) |
(Rs. crore) |
Country of Transacting Units |
Period |
Total International Claims |
Residual Maturity |
Sector |
Short-Term |
Long-Term |
Unallocated |
Bank |
Non-Bank Public |
Non-Bank Private |
Turkey |
Mar-2007 |
1,582 |
1,192 |
391 |
— |
566 |
— |
1,016 |
| |
Jun-2007 |
1,315 |
1,027 |
288 |
— |
456 |
— |
859 |
| |
Sep-2007 |
1,290 |
1,022 |
267 |
— |
412 |
— |
878 |
| |
Dec-2007 |
1,203 |
906 |
297 |
— |
340 |
— |
863 |
| |
Mar-2008 |
1,028 |
788 |
240 |
— |
322 |
— |
705 |
| |
Jun-2008 |
973 |
746 |
226 |
— |
343 |
— |
629 |
United Arab Emirates |
Mar-2007 |
6,686 |
4,131 |
2,555 |
— |
1,189 |
— |
5,496 |
| |
Jun-2007 |
6,889 |
3,808 |
3,081 |
— |
1,119 |
— |
5,770 |
| |
Sep-2007 |
6,773 |
3,740 |
3,033 |
— |
1,046 |
— |
5,728 |
| |
Dec-2007 |
7,467 |
4,641 |
2,826 |
— |
1,448 |
1 |
6,018 |
| |
Mar-2008 |
7,990 |
5,405 |
2,585 |
— |
1,177 |
— |
6,812 |
| |
Jun-2008 |
7,977 |
4,967 |
3,010 |
— |
1,047 |
— |
6,930 |
United Kingdom @ |
Mar-2007 |
22,598 |
14,510 |
8,088 |
— |
13,070 |
32 |
9,496 |
| |
Jun-2007 |
29,257 |
18,347 |
10,910 |
— |
14,980 |
33 |
14,244 |
| |
Sep-2007 |
30,584 |
18,742 |
11,406 |
436 |
13,431 |
21 |
17,131 |
| |
Dec-2007 |
24,987 |
15,922 |
8,237 |
828 |
9,582 |
15 |
15,391 |
| |
Mar-2008 |
21,899 |
13,161 |
7,819 |
920 |
10,211 |
17 |
11,672 |
| |
Jun-2008 |
22,662 |
12,184 |
9,331 |
1,147 |
10,084 |
13 |
12,565 |
United States # |
Mar-2007 |
32,875 |
26,067 |
6,808 |
— |
13,442 |
426 |
19,007 |
(Incl. Midway Is., |
Jun-2007 |
34,396 |
27,579 |
6,817 |
— |
14,763 |
369 |
19,263 |
Wake Islands) |
Sep-2007 |
33,147 |
25,672 |
7,475 |
— |
12,298 |
303 |
20,546 |
| |
Dec-2007 |
33,114 |
26,405 |
6,709 |
— |
10,795 |
391 |
21,927 |
| |
Mar-2008 |
35,374 |
27,741 |
7,618 |
16 |
10,680 |
323 |
24,371 |
| |
Jun-2008 |
37,447 |
27,502 |
9,930 |
14 |
12,970 |
292 |
24,185 |
@ : Excluding Guernsey, Isle of Man and Jersey. # : Includes Miday Island and Wake Islands. — : Nil/Negligible.
Notes : 1. Totals may not tally due to rounding off.
2. Residual maturity “Unallocated” comprises maturity not applicable (e.g., for equities) and maturity information not available.
3. “No Specific Country” means the Country Information has not been provided by the Reporting bank branches.
4. Data have been revised for previous quarters. |
|


