 IST,
IST,
IV. Monetary and Liquidity Conditions
Tight liquidity conditions prevailing during the third quarter of 2010-11 eased somewhat during the fourth quarter mainly on account of softening of both structural and frictional stress factors. The deficit liquidity conditions strengthened monetary transmission, which was reflected in higher deposit as well as lending rates of banks, and in turn improved deposit growth and induced slight moderation in credit growth. The anti-inflationary thrust of monetary policy, however, continued to remain non-disruptive of the growth momentum. Monetary conditions remain consistent with the anti-inflationary bias IV.1 During 2010-11, the monetary and liquidity conditions remained consistent with the anti-inflationary stance. The monetary policy stance of the Reserve Bank shifted to tightening mode since October 2009 in response to rising inflationary pressures. The calibrated policy actions so far have not been disruptive to growth. The Reserve Bank increased cash reserve ratio by 100 basis points (bps), reverse repo rate by 250 bps, and the repo rate by 200 bps since February 2010 so far. A shift from absorption mode to injection mode in the liquidity adjustment facility (LAF) implies effective rise in policy rates by 350 bps since February 2010 (Table IV.1). IV.2 During 2010-11, the Reserve Bank articulated a net liquidity level of ±1 per cent of net demand and time liabilities (NDTL) of banks as ideal for effective monetary transmission. The persistence of deficit liquidity conditions in Q4 of 2010-11 helped in further strengthening the monetary policy transmission. However, inflation continues to remain at elevated levels. The Reserve Bank strove to maintain the difficult balance between ensuring sufficient liquidity for smooth functioning of markets on the one hand and sustaining the anti-inflationary monetary policy stance on the other.
Liquidity conditions soften as structural and frictional liquidity drivers ease IV.3 After a phase of significant tightness, both structural and frictional drivers of deficit liquidity conditions softened relatively during the fourth quarter of 2010-11 (Table IV.2). Liquidity conditions had switched to deficit mode since end-May 2010, due to large increase in government balances with the Reserve Bank (resulting from 3G/BWA auctions and the first installment of quarterly advance tax payments). The Reserve Bank initiated several policy measures to ease the liquidity pressure viz., allowing SCBs to avail of additional liquidity support under the LAF and conducting second LAF (SLAF) on a daily basis.
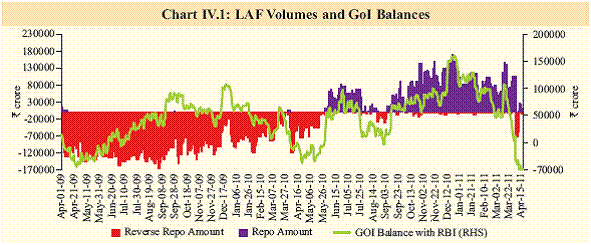
IV.4 Liquidity conditions eased in August 2010, mainly on account of large pre-scheduled public debt redemptions. After a brief period of surplus liquidity, the LAF again switched to deficit mode from the second week of September 2010 on account of quarterly advance tax payments. Structural factors like imbalances between deposit and credit growth coupled with high currency demand added to the pressure on liquidity. During the third quarter, the Reserve Bank undertook open market operation (OMO) purchases and other measures to ease the liquidity pressures. IV.5 Liquidity conditions eased marginally during the last quarter of 2010-11 due to pickup in government spending and staggered OMOs carried out by the Reserve Bank since mid-December (Table IV.3). During 2010-11, the Reserve Bank purchased government securities of around ` 67,000 crore under OMO auctions. Notwithstanding the quarterly advance tax payouts in mid-March 2011, which again contributed to temporary tightness, the liquidity deficit remained capped on account of higher government expenditure during the month. IV.6 During first week of April 2011, the LAF was in reverse repo mode, partly reflecting increased government spending. However, since April 11, it has reverted to deficit mode. IV.7 The monetary transmission is usually substantially more effective in a deficit liquidity situation than in a surplus liquidity situation. An empirical exercise carried out by the Working Group on Operating Procedures of Monetary Policy (Chairman: Shri Deepak Mohanty) suggests that under deficit liquidity conditions, money market rates respond immediately to policy shock. IV.8 The recent episodes of large government surplus cash balances emerging as a major autonomous factor influencing the liquidity points towards a need for better cash management by the government (Chart IV.1). In this context, the above Working Group suggested a scheme of auctioning of government surplus cash balances at the discretion of the Reserve Bank to be put in place in consultation with the government.
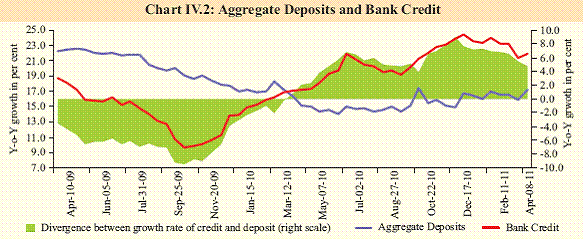
Structural drivers respond to policy signals amidst tight liquidity IV.9 The monetary policy transmission was weak till May 2010 due to overhang of large surplus liquidity that had to be infused following the global financial crisis. The antiinflationary policy actions of the Reserve Bank that operated through raising the policy rates contributed to keeping liquidity and monetary conditions in line with the policy objective. In a tight liquidity environment, it was expected that higher deposit rates would improve the growth of deposits while higher lending rates would moderate the demand for credit. During Q4 of 2010-11, effective transmission of monetary policy was reflected in higher deposit as well as lending rates of banks and higher issuances of bulk deposits by way of CDs. As a result, credit growth decelerated, while deposit growth accelerated, thereby narrowing the divergence between credit and deposit growth rates (Chart IV.2). The easing of liquidity conditions was reflected in the decline in the LAF injection.
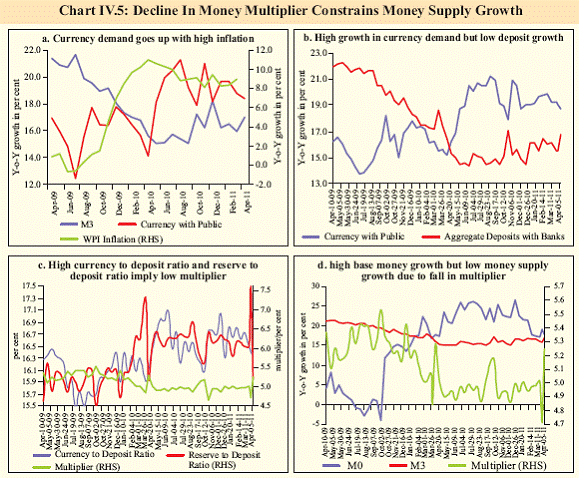
Money supply growth remains below the indicative trajectory IV.10 Even as reserve money growth remained strong, the money supply (M3) growth during 2010-11 generally remained below the indicative trajectory set out in the Annual Policy Statement for 2010-11 (Table IV.4). This was due to lower growth in aggregate deposits and reduction in money multiplier emanating from higher currency demand.
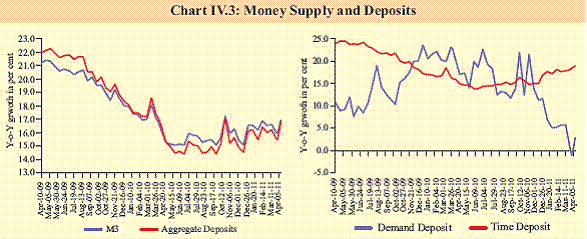
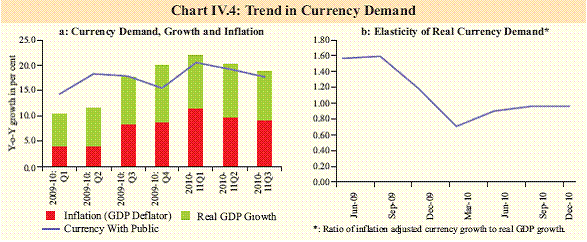
IV.11 Money supply growth is largely influenced by the trend in aggregate deposits, as these account for over 85 per cent of the money stock. During the first three quarters of 2010-11, term deposits appeared relatively unattractive as a store of value, in view of the modest rise in deposit rates relative to high inflationary expectations. During the last quarter of the year, however, as deposit rates were raised sharply, deposit mobilisation gathered momentum, which also helped in the pick-up in money supply growth. As a result of a sharper increase in deposit interest rates during the quarter as also the deceleration in industrial activity and the underperformance of equity market, a shift from low interest bearing demand deposits to more lucrative time deposits became evident (Chart IV.3). Strong currency demand aided tight liquidity and decline in money multiplier IV.12 Stronger growth in demand for currency during 2010-11 contributed to both tightness in liquidity and subdued growth in broad money. The growth in currency demand, which generally remains below money supply growth, witnessed a spurt in 2010-11 partly reflecting stronger GDP growth and persistent high inflation. During the year 2010-11, the real elasticity of demand for currency remained close to unity, indicating the predominant role that inflation played in generating high currency demand (Chart IV.4). The rise in currency demand, coupled with deceleration in the growth of aggregate deposits resulted in a higher currency-deposit ratio, and hence, a decline in the money multiplier. Consequently, even with high base money growth, due mainly to injection of primary liquidity through repo and OMOs, the money supply growth remained lower than the indicative trajectory (Chart IV.5).
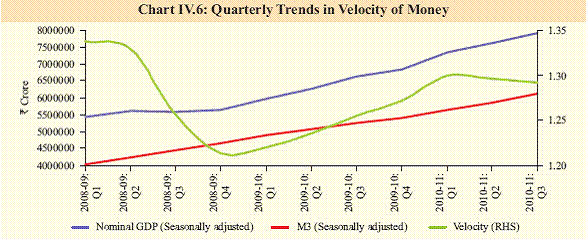
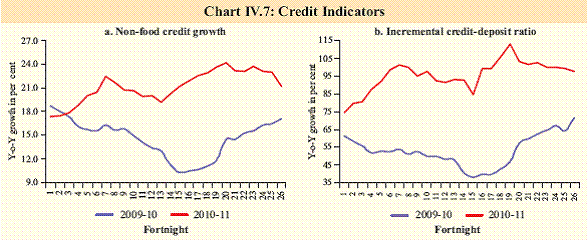
Income velocity of money recovers from the post-crisis dip IV.13 There was a sharp fall in the velocity of money (M3) during 2008-09 and 2009-10 reflecting post-global crisis uncertainties in the financial system. With consolidation of growth and normal financial conditions, the income velocity of money reverted to its long-term path, involving a pick-up in 2010-11 (Chart IV.6). Credit growth remains above trajectory but has started moderating IV.14 Credit growth remained above the indicative trajectory, but with some moderation seen in the recent period. After witnessing an acceleration in non-food credit growth over the indicative trajectory of 20 per cent, there had been some moderation since the beginning of Q4 of 2010-11. In response to higher interest rates, the non-food credit growth decelerated and deposit growth accelerated. Consequently, the incremental credit-deposit ratio moderated (Chart IV.7).
IV.15 The moderation in credit growth on a yo- y basis was especially evident in the case of public sector banks, even though the credit conditions generally remained supportive of economic activity (Table IV.5). IV.16 The sectoral deployment of credit continued to remain broad-based, with high growth in flow of credit to services and personal loans (Table IV.6). Disaggregated analysis suggests that credit to the industrial sector continued to be led by credit to infrastructure, metal and metal products, textiles, engineering, food processing and gems and jewellery. The high growth in credit to infrastructure is especially noteworthy as it is on a high base. The bank credit to NBFCs also witnessed a sharp rise.
IV.17 Banks continued to be the major source of finance for the commercial sector. During 2010-11, funding from non-bank sources registered a marginal decline as compared to the previous year (Table IV.7). In the case of foreign sources of funding, external commercial borrowings /FCCBs have registered robust rise, partly reflecting the soft interest rate regime prevalent in most of the advanced economies. The decline in foreign direct investment (FDI) was substantially offset by the rise in ECBs/ FCCBs. Monetary policy to factor risks to growth from high inflation IV.18 The Reserve Bank’s anti-inflationary policy has been calibrated with a view to containing inflationary expectations, while being non-disruptive to the overall growth process. The deficit liquidity conditions helped in strengthening the monetary transmission further in Q4 of 2010-11 as reflected in higher deposit and lending rates, which helped in easing the structural stress on liquidity. The growth momentum has continued so far. However, inflation remains elevated, despite the 350 bps effective increase in policy rates. Risk to growth from sustained high inflation could condition the stance of the monetary policy in near-term. Since high inflation itself could disrupt growth, it is important for the monetary policy to ensure a low inflation environment as a pre-condition for sustained high growth.
|
|||||||||||||||||||||||||||||||||||||||||||||||||||||||||||||||||||||||||||||||||||||||||||||||||||||||||||||||||||||||||||||||||||||||||||||||||||||||||||||||||||||||||||||||||||||||||||||||||||||||||||||||||||||||||||||||||||||||||||||||||||||||||||||||||||||||||||||||||||||||||||||||||||||||||||||||||||||||||||||||||||||||||||||||||||||||||||||||||||||||||||||||||||||||||||||||||||||||||||||||||||||||||||||||||||||||||||||||||||||||||||||||||||||||||||||||||||||||||||||||||||||||||||||||||||||||||||||||||||||||||||||||||||||||||||||||||||||||||||||||||||||||||||||||||||||||||||||||||||||||||||||||||||||||||||||||||||||||||||||||||||||||||||||||||||||||||||||||||||||||||
صفحے پر آخری اپ ڈیٹ:


