 IST,
IST,
Monetary Policy Transmission in India - Recent Trends and Impediments
This article examines monetary policy transmission to various segments of the financial system in India with a special emphasis on banks’ deposit and lending interest rates during the current easing cycle so far, i.e., since February 2019. While transmission to money market and long-term rates has been swift and almost complete, the transmission to deposit and lending interest rates has been muted. A key factor impeding quick and adequate transmission to banks’ lending rates has been long maturity profile of bank deposits at fixed interest rates. Even otherwise, banks are slow in adjusting their deposit interest rates. Under the external benchmark system introduced effective October 1, 2019 for select categories of loans, transmission to banks’ lending rates will no longer be contingent upon adjustment in deposit interest rates. Instead, changes in lending rates will induce changes in deposit interest rates. Introduction Monetary transmission is the process through which monetary policy impulses in the form of policy rate changes by a central bank are transmitted to the entire spectrum of interest rates such as money market rates, bond yields, bank deposit and lending rates and asset prices such as stock prices and house prices. Various economic agents such as households, firms and the government respond to these interest rate changes by adjusting their spending behaviour. This alters aggregate demand and by aligning it with aggregate supply conditions, the broader macroeconomic policy objectives such as price stability and sustainable growth of the economy are achieved. In a country like India where the banking system constitutes a predominant segment of the financial system, efficient transmission to banks’ deposit and lending interest rates is the key to achieving the ultimate objectives of monetary policy. However, transmission to banks’ lending rates in India is impeded by a variety of factors, the most important being the long maturity profile of deposits at fixed interest rates. This article assesses monetary transmission to various segments of the financial system during the current easing cycle (February 2019 – January 2020) with a special focus on banks’ deposit and lending interest rates. During this period, the policy repo rate was cut cumulatively by 135 basis points (bps) and the monetary policy stance was changed from calibrated tightening to neutral in February 2019 and then to accommodative in June 2019. The study is organised in six sections. While Section II briefly outlines the monetary policy transmission to money and bond market yields, Section III assesses the transmission to deposit and lending rates of commercial banks. Section IV delineates the impediments to monetary transmission in India. Section V describes briefly the advantages of an external benchmark linked pricing of loans vis-à-vis an internal benchmark. Section VI sums up the main findings and sets out some final reflections. II. Transmission to the Money and Bond Markets Monetary transmission has been full and reasonably swift across various money market segments and the private corporate bond market during the current easing cycle so far. For example, the transmission of policy rate changes to the weighted average call rate (WACR) was instantaneous. The transmission to other overnight money market segments – triparty repo rate and market repo rate – moved in step with call money rates. Interest rates in the secondary market on short-term money market instruments such as 3-month certificates of deposit (CDs), 3-month commercial papers (CPs) and 91-day Treasury bills (T-Bills) moved in sync with the policy rate. Overall, as against the cumulative reduction of 135 bps in the policy rate during February 6, 2019 - January 31, 2020, the 3-month yield on T-Bills declined by 144 bps. Similarly, the 3-month CD rate declined by 167 bps, while yield on 3-month CPs issued by non-banking finance companies (NBFCs) and non- NBFCs declined by 190 bps and 140 bps, respectively. Transmission to the government securities market, however, was partial with the 5-year and 10-year G-sec yields declining by 74 bps and 76 bps, respectively. Over the entire easing cycle, the spread between the corporate bond yield and the policy repo rate remained broadly stable, reflecting complete transmission from the policy repo rate to corporate bond yields. While transmission of policy rate changes to overnight segment was relatively smooth, instantaneous and almost full, transmission to longer-term money market rates and bond market yields was at times impacted by market imperfections as also several other idiosyncratic factors such as changing perceptions of credit risk, the evolving fiscal situation and changes in oil prices. For instance, rating downgrades of CPs issued by select NBFCs impacted the transmission to the CP market during June-July 2019. Likewise, transmission to CDs was impeded from time to time by balance sheet concerns faced by some banks. Between February and mid-September 2019 (the fortnight ended September 13, 2019), credit growth outpaced deposit growth, which exerted upward pressure on CD rates. Similarly, softening of yields on long-term bonds during the first half of 2019 was aided by a decline in oil prices and lower expectations of inflation. During mid-July till September, long-term yields were influenced by concerns over fiscal slippage arising from anticipation of a stimulus and domestic/geo-political tensions. Unconventional monetary policy measures announced on February 6, 2020, such as introduction of longer term repos of 1-year and 3-year maturities resulted in a lowering of bond yields. Using daily secondary market data, it is observed that the correlation coefficients between the policy repo rate on the one hand and overnight rates, viz., WACR, market repo rate and triparty repo rate on the other ranged between 0.90 to 0.98 (Table 1). The correlation coefficients of the policy rate and other money market rates, viz., 3-month CP, CD and T-bills were also quite high (0.87 to 0.98). The correlation coefficient between the policy repo rate and 5-year G-Sec yield was 0.87, while that between the policy repo rate and 5-year corporate bond yield was 0.95. Further, the correlation coefficients for 10-year G-Sec and 10-year corporate bond yields were found to be 0.88 and 0.89, respectively, during the period. The correlation coefficients of money and bond market rates with the policy rate were statistically significant. A regression analysis based on weekly data for the period February 2019 – January 2020 suggests a co-movement between the policy rate and the market rates. However, standard deviations of the error term were also found to be significant, suggesting that factors other than the policy rate also had a bearing on transmission (Table 2). Because of this, correlation coefficients of the policy rate and market rates, especially, those at the longer end, were found to be lower than unity (Table 1). III. Transmission to Deposit and Lending Interest Rates In response to the cumulative reduction in the policy repo rate by 135 bps since February 2019, most banks have reduced their term deposit rates; some banks also reduced their saving deposit interest rates. The decline in the weighted average domestic term deposit rate (WADTDR) on outstanding deposits was muted till September 2019. However, following the introduction of linking new floating rate loans to retail and micro and small enterprises (MSEs) to an external benchmark, effective October 1, 2019, the WADTDR declined sharply by 32 bps during October 2019 – January 2020 as against the decline of just 7 bps over the previous eight months. Overall, the WADTDR declined by 39 bps between February 2019 and January 2020. The weighted average lending rate (WALR) on fresh rupee loans declined by 61 bps, while that on outstanding rupee loans declined by 12 bps during February 2019 - January 2020. At the bank group level, the transmission to deposit and lending interest rates has been uneven, reflecting idiosyncratic factors. In the case of WADTDR, the largest decline was observed in the case of foreign banks (124 bps), followed by private sector banks (51 bps) and public sector banks (29 bps). In the case of fresh rupee loans, the largest decline in the WALR was observed in respect of foreign banks (105 bps), followed by public sector banks (62 bps) and private sector banks (50 bps). In the case of outstanding rupee loans, the largest decline was noticed in the case of foreign banks (46 bps) (Chart 1). At a disaggregated level, 74 banks reduced their 1-year marginal cost of funds-based lending rates (MCLRs), while five banks raised their 1-year MCLRs. While 18 public sector banks and 17 private sector banks reduced MCLRs, three private sector banks increased their 1-year MCLRs (Chart 2). 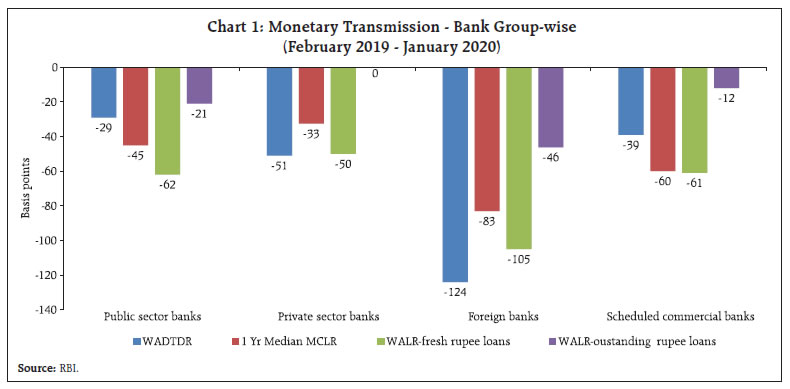 The median WALR charged by private sector banks was higher than that of public sector banks due to their higher 1- year median MCLR as also the higher spreads charged by them over MCLR (Chart 3)1. Higher MCLR reflects higher cost of funds, while higher spreads reflect divergent loan portfolios and quality of loan portfolio. Overall, transmission to bank lending rates, particularly on outstanding rupee loans, has been inadequate despite some improvement in the more recent period. 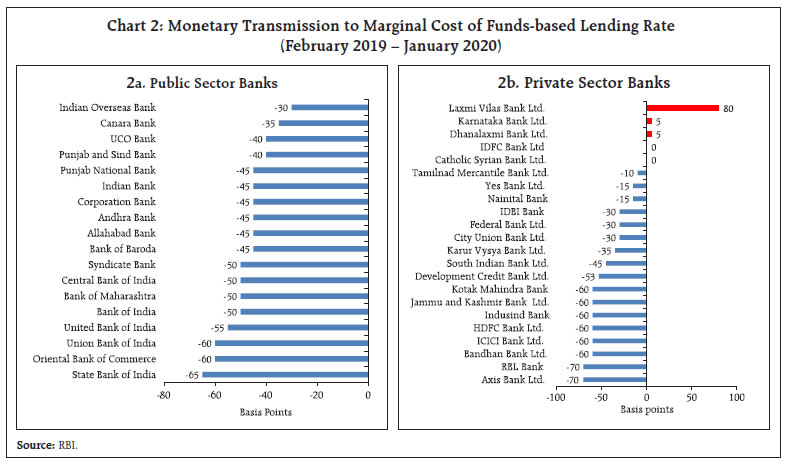 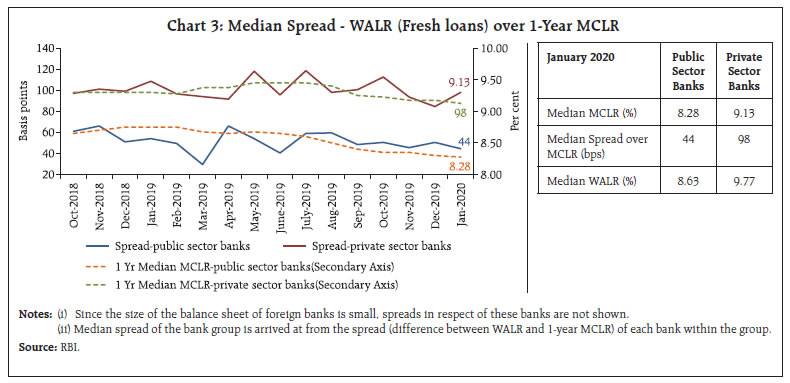 IV. Monetary Policy Transmission to Bank Deposit and Lending Interest Rates - Impediments Monetary transmission to bank lending interest rates is impacted by several factors: both endogenous, which are under the control of the banking system; and exogenous, which are not within the control of the banking system, as detailed below. IV.1 Long Maturity Profile of Deposits at Fixed Interest Rates The MCLR system is primarily based on the cost of funds - equity and borrowings (deposits and other borrowings) of banks.2 Since retail deposits comprise the bulk of the funds of banks, transmission to banks’ MCLR is inextricably linked to movements in the cost of such deposits. The banks’ cost of funds, however, is inflexible for two reasons: (i) long maturity profile of banks’ deposits; and (ii) fixed interest rates on such deposits. As at end-March 2019, the latest period for which data are available, more than half of the deposits of commercial banks were in the maturity bucket of ‘one year and above’ and over 20 per cent were in the maturity bucket of ‘five years and above’ (Chart 4a).3 Long maturity profile of deposits in itself does not impede monetary transmission provided interest rates on such deposits move in line with the policy rate. However, almost all bank deposits are at fixed interest rates. This makes banks’ outstanding liability profile insensitive to changes in the policy rate. The transmission, in particular, is impeded more during the easing cycle than during the tightening cycle. In the tightening cycle when interest rates rise, depositors have the option to prematurely terminate their deposits and redeploy them at higher interest rates. Banks also have the incentive to raise their lending rates even before an increase in their deposit interest rates, as the demand for credit is strong. During the easing cycle, on the other hand, banks have to wait until old deposits contracted at higher interest rates mature and are renewed at lower rates, which delays the process of transmission to lending rates. 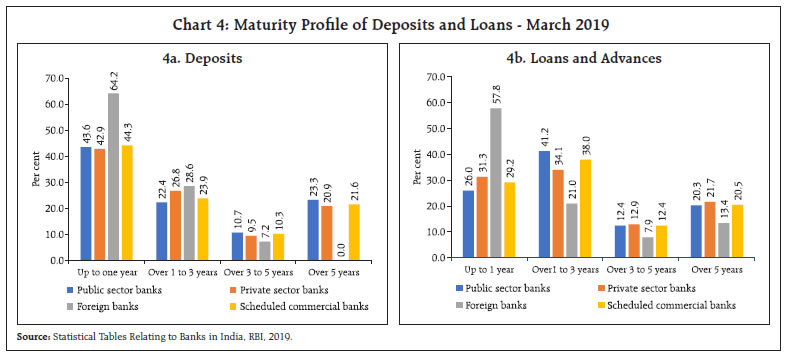 As the economy transits from a tightening cycle to an easing cycle, deposits contracted at high interest rates during the peak of the tightening cycle keep the average cost of deposits elevated in the initial months of the easing cycle. This is more so in the case of public sector and private sector banks as they hold more than 20 per cent of their deposits with maturity of five years and above, unlike foreign banks, which hold a negligible share of their deposits with maturity of five years and above. Unlike deposits, which are at fixed rates, most of loans (over 75 per cent) are at floating rates (Table 3). The maturity profile of loans and advances extended by public sector and private sector banks is skewed towards longer-term loans (one year and more), while that of foreign banks towards shorter tenor (up to one year) (Chart 4b). Loans at floating rates, by design, are expected to facilitate monetary transmission. However, transmission to lending rates, despite loans being at floating rates, is impeded due to long maturity profile of deposits at fixed interest rates. The median interest rates on fresh term deposits (card rates) declined cumulatively by 31 bps during the current easing cycle (up to January 2020). Now the question is why banks are slow in adjusting their deposit interest rates. Under the MCLR system, banks are required to apply any change in the card deposit rate on new deposits in the computation of the MCLR. The tenor of MCLR is typically one year, while the weighted average maturity of deposits of domestic banks is around two years. In view of this mismatch in the average tenor of MCLR and deposits, any reduction in MCLR by banks consequent to the application of lower card rates will have to be passed on to almost all borrowers with floating rate loans at the most within one year, whereas interest rates will be reset only on 50 per cent of term deposits in a year (given the average maturity of two years4). That is, interest rates on floating rate loans are reset faster than those on term deposits. Hence, banks are reluctant to make large changes in their deposit interest rates. If banks make large changes in their deposit interest rates, they will have to take a hit on their net interest margins (NIMs). This is because while the benefit of say, 25 bps rate cut will be passed on to almost all floating rate loans within a year, banks will have to wait for two years for effecting similar reduction on their outstanding deposits. Banks can apply new card rates to existing deposits only when they mature and become due for renewal. It is then that banks’ cost of funds declines significantly, which is then transmitted to lending rates but in the process the transmission is delayed. IV.2 Rigidity in Saving Deposit Interest Rate5 Although the Reserve Bank deregulated interest rates on saving bank deposits effective October 25, 2011, most banks kept their saving deposit interest rate unchanged at 4.0 per cent for almost six long years, though policy rates were changed in both directions during this period. Illustratively, as at end-September 2013, only 18 banks - 7 private sector banks and 11 foreign banks - with a market share of just 5.3 per cent in aggregate deposits – changed their saving deposit interest rate post deregulation. Private sector banks raised their saving deposit rates in the range of 150-200 bps for balances up to ₹ 1 lakh and 50-400 bps for balances above ₹ 1 lakh (Table 4). The market share of these banks in saving bank deposits increased by 0.57 percentage point to 3.5 per cent by end-September 2013. However, not a single public sector bank changed its saving deposit rate between October 25, 2011 and July 30, 2017. Following demonetisation in November 2016, there was a large influx of surplus liquidity resulting in a rise in the share of saving deposits in aggregate deposits from 26.0 per cent in October 2016 to 31.7 per cent by August 2018. This encouraged most public sector and private sector banks – led by the State Bank of India on July 31, 2017 – to reduce their saving deposit rate (for deposits up to ₹ 1 lakh) to 3.5 per cent (Chart 5). However, this reduction in the saving deposit interest rate was unrelated to monetary policy and instead entirely reflected the impact of demonetisation. Most of the rise in the share of saving deposits in aggregate deposits post-demonetisation has been sustained as the share of saving deposits in aggregate deposits has by and large remained stable - declining only modestly to 31.4 per cent by January 2020. 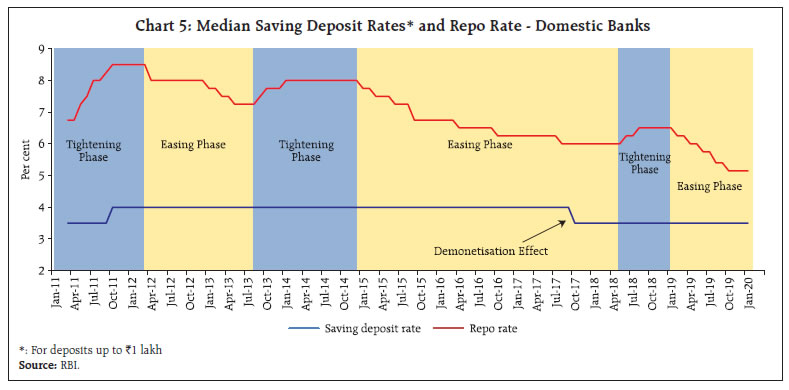 It is intriguing that the median saving deposit rate has remained rigid during the entire post-deregulation period, barring the one-off change in the saving deposit rate post-demonetisation.6 The rigidity in interest rate on saving accounts since its deregulation in October 2011 has significantly impeded transmission to the MCLR and to lending rates by keeping the average (as also marginal) cost of funds high during the easing phase and low during the tightening phase. Even if a bank fully transmits, say, a 25 bps cut in the policy repo rate to its term deposit rates, but does not change its saving deposit interest rate, its MCLR will decline only by 14 bps. This is based on the assumption that saving deposits constitute 30 per cent of total borrowings (deposits and other borrowings), which, in turn constitute 92 per cent of funds (borrowings and equity). The actual impact may sightly vary depending on the composition of liabilities. Hence, if banks do not change interest rates on saving deposits in tune with the policy rate, the transmission to lending rates would always remain incomplete. IV.3 Legacy of Base Rate Loans Rigidities observed with the transmission under the base rate system were intended to be addressed through the MCLR system for new loans, effective April 1, 2016. In the absence of any sunset clause, however, quite a sizeable portion of floating rate rupee loans has remained linked to the base rate even after more than three years of introduction of the MCLR system (Table 5)7. Although borrowers are permitted to switchover their base rate linked loans to MCLR linked loans at mutually convenient terms, the switchover to MCLR regime has been slow because: (i) banks do not widely publicise the option to shift to MCLR linked loans; (ii) banks can charge a fee for facilitating the shift; and (iii) there is no reduction in the interest rate immediately following the shift as existing customers are required to pay a higher spread than the new customers even though all other factors that go into the pricing of credit (risk profile, maturity and loan type) are fixed. For all these reasons, customers are either ignorant of the option or are discouraged from shifting to MCLR linked loans (RBI, 2017). The parallel operation of the MCLR and the base rate systems since April 2016 has adversely impacted the transmission in respect of outstanding loans linked to the base rate (see also Box 1). This is because unlike the median MCLR, the median base rate has remained relatively rigid during the easing and tightening phases of monetary policy (RBI, 2017). The median WALR on outstanding rupee loans linked to the MCLR declined by 47 bps in the case of public sector banks and 36 bps points in the case of private sector banks in the easing phase of monetary policy during 2017-18. However, during the same period, the median WALR on loans linked to the base rate increased paradoxically for both public sector and private sector banks. During the tightening phase of 2018-19, while expectedly, there was an increase in the median WALR on loans linked to MCLR, the median WALR linked to base rate surprisingly declined for private sector banks (Table 6). Thus, a sizeable proportion of loans at the base rate combined with the slow pace of changes in interest rates on such loans has impaired transmission to interest rates on outstanding rupee loans. IV.4 Periodicity of Interest Rate Reset under the MCLR System Another factor which delays transmission to the outstanding rupee loans is the long periodicity of interest rate reset on floating rate loans. Information collected by the Reserve Bank shows that as much as 75.8 per cent of floating rate MCLR loans are linked to MCLR of 1 year and above (Table 7). Only 15.8 per cent of floating rate loan portfolio linked to MCLR are for tenor up to 3 months. Loans linked to the 1-year MCLR are reset annually. The long interest rate reset clause combined with higher interest rates on base rate/Bencchmark Prime Lending Rate (BPLR) loans vis-á-vis MCLR-based rates (as alluded to earlier) has created a wedge between transmission to fresh rupee loans and outstanding rupee loans (Box I).
IV.5 Competitive Pressures - Mutual Funds and Small Savings Schemes The banking sector is the main segment which intermediates financial savings (Chart 6a). In recent years, however, the significance of mutual funds (MFs) and small saving has risen relative to bank deposits. During last seven years (2012-13 to 2018-19), resources raised by mutual funds grew at an annual average rate of 22.6 per cent – almost double the rate at which deposits of commercial banks grew. As a result, in incremental terms, the share of MFs in total resources mobilised by banks, small saving and MFs increased sharply from 11.7 per cent in 2012-13 to 31.6 per cent in 2017-18, before declining to 15.4 per cent in 2018-19 while the share of small savings too increased sharply from 2.5 per cent in 2012-13 to 12.1 per cent in 2018-19 (Chart 6b). The returns on small saving schemes, viz., 5-year time deposit, public provident fund (PPF), national savings certificate and senior citizens’ savings scheme, as well as debt and equity mutual funds receive favourable tax treatment vis-à-vis bank time deposits. 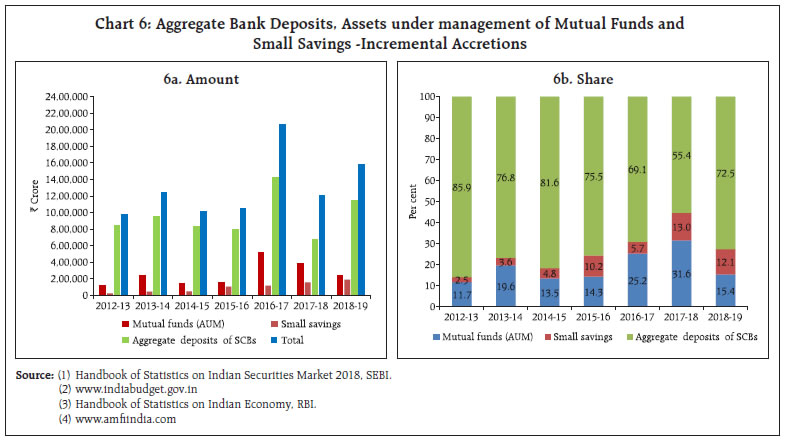 Interest rates on small saving are administered by the government and are linked to secondary market yields on G-secs of comparable maturities. Interest rates are set with a lag on a quarterly basis since April 2016. Typically, it is observed that during the easing cycles of monetary policy – Q2:2017-18 to Q4:2017-18 and Q1:2019-20 to Q4:2019-20, small saving rates were higher than the formula-based rates (Chart 7). On the other hand, during the tightening phase (Q1:2018-19 to Q3:2018-19), the opposite was true. This means that the nominal administered rates are not adjusted in line with the movement of G-sec yields that respond to the change in the policy rate. For instance, small saving rates on various schemes were higher by 18-61 bps for Q2:2019-20. The government left small saving rates unchanged for Q3 and Q4 even as G-sec yields declined during the respective reference periods of June-August and September- November 2019. Currently, the administered interest rates on small saving schemes are higher by 81- 160 bps as compared with the formula-based rates (Table 8). It has been argued8 that in the absence of social security system in our country and the fact that many senior citizens depend on deposit earnings, deposit rates cannot fall beyond a threshold floor level. This raises two issues. 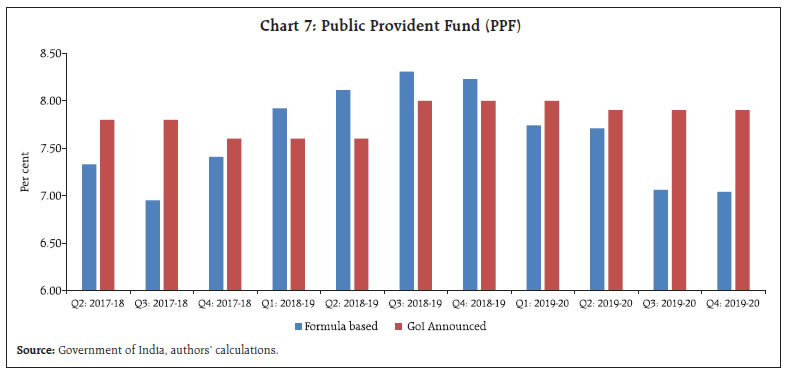 First, as investment slows down during growth slowdown, interest rates also need to decline to raise investment. Interest rates, thus, provide a mechanism to equilibrate saving and investment. Also, during an easing cycle, interest rates need to decline given low inflation rate to keep real interest rates at an appropriate level. Any artificial threshold for interest rate would clog the mechanism for equilibrating saving and investment and could also lead to higher real interest rates in the system. It may be recalled that about twenty years ago, interest rates were very high in double digits, which have now declined to a single digit. After the global financial crisis, many central banks reduced the policy interest rates to zero and some in Europe also took them even to negative territory, which was inconceivable in the past. In line with the policy rate, deposit interest rates also declined to near zero level in Europe. This suggests that there cannot be any threshold for interest rates, which is a function of saving and investment. Second, it is important to protect interests of pensioners/senior citizens, especially in our society which lacks a robust social security system. In this context, it is also important to recognize that interest rates have cycles. Central banks raise interest rates when the economy is overheating, i.e., when aggregate demand is above the potential output (positive output gap) and vice versa. The underlying rationale is to steer aggregate demand towards its potential level. Overall, however, as the economy goes through cycles, the benefits/losses are broadly evened out to borrowers and depositors. IV.6 Asset Quality of Banks A healthy bank with low default risk in its loan portfolio will be able to pass on interest rate changes by the central bank symmetrically to its deposits and loans. On the other hand, a bank faced with a high level of non-performing assets (NPA) – prospective or realised – is likely to build up provisions by loading credit risk premia on its performing loans, thereby pushing up the lending rates (John, et al. 2016). In the process, notwithstanding lower funding costs in response to the policy rate cut by the central bank, banks may not reduce their lending rates or may reduce them only partly, thereby impeding monetary transmission. Sound health of the banking system is critical for effective monetary transmission, especially in a bank-dominated financial system such as India. A study (John, et al. 2016) in the Indian context suggested that deterioration in asset quality was positively associated with NIMs only in the period Q1:2010-11 to Q1:2015-16 (sub period I). On the other hand, deterioration in asset quality was negatively associated with NIM in the period Q2:2015-16 to Q1:2017-18 (sub-period II). Significantly, NPAs/stressed assets were at a low level in the sub-period I than the sub-period II. This suggests that at a relatively low level of NPAs, banks were able to pass on the burden of deterioration in asset quality on to their lending rates and protect NIMs. In the sub-period II, however, when there was a sharp deterioration in asset quality as reflected in a high level of NPAs, NIMs came under pressure as banks were not able to sufficiently increase their spreads in a competitive market to compensate for credit risk. Instead, banks became risk averse and reduced their loan exposures, which impacted monetary transmission through the bank lending channel. The above findings at the aggregate level were also corroborated at the bank-group-wise level. NIMs of public sector banks, which had large NPAs/stressed assets, were negatively impacted. The deterioration in asset quality and losses incurred by public sector banks appeared to have hampered effective monetary transmission through credit supply. On the other hand, NIMs of private sector and foreign banks were not negatively impacted as both these groups had relatively low level of NPAs/stressed assets during the period under study. V. External Benchmarking of Lending Rates In pursuance of the recommendations of an Internal Study Group (Chairman: Janak Raj), the Reserve Bank mandated all scheduled commercial banks (excluding regional rural banks) to link all new floating rate personal or retail loans and floating rate loans to micro and small enterprises (MSEs) to the policy repo rate or 3-month T-bill rate or 6-month T-bill rate or any other benchmark market interest rate published by Financial Benchmarks India Private Ltd. (FBIL), effective October 1, 2019. Banks have complete freedom to fix the spread over the external benchmark for new borrowers at the time of origination of the loan. However, once the spread is fixed, banks shall be allowed to change the spread only under condition of a substantial change in the borrower’s credit assessment as agreed upon in the loan contract resulting in a change in the credit risk premium. Further, other components of spread could be altered once in three years. Following its introduction on October 1, 2019, information collected from banks suggests that most banks, i.e., 38 of the 56 banks have adopted the Reserve Bank’s policy repo rate as the external benchmark for floating rate loans to the retail and MSE sectors; these include 34 banks in the public and private sectors (Table 9). Thirteen banks have linked their loans to various other rates published by FBIL such as MIBOR, OIS, 3-month T-Bill rate, CD Rates and 10 Year G-sec yield. Some banks such as the State Bank of India, have voluntarily linked their floating rate loans to the medium scale enterprises to the policy rate.9 A comparison among the sectors, where banks have linked their floating rate loans to the repo rate, reveals that the median spread was the highest for other personal loans, which are mainly unsecured loans, followed by the MSE sector (Table 10). The median spread was the lowest in the case of housing loans, which are typically collateralised. Among the bank-groups, the median spread charged by public sector banks for different categories of loans was lower than that by private sector banks. There are early indications of an improvement in transmission to fresh rupee loans sanctioned in respect of sectors where new floating rate loans have been linked to the external benchmark. The WALRs charged by domestic (public and private sector) banks on fresh rupee loans sanctioned for housing sectors declined by 38 bps and that on vehicle loans by 47 bps during October 2019 - January 2020. The WALR of domestic banks in respect of loans to micro, small and medium enterprises (MSMEs) also declined by 59 bps in January (Chart 8). However, the WALR in respect of loans to the education sector increased marginally by 1 bp in January. The external benchmark framework will quicken transmission to lending rates (i) as any change in the benchmark rate will lead to a change in lending rates for new borrowers; (ii) for existing borrowers, banks would need to reset interest rates at least once in three months as against typically one year in the case of loans linked to the MCLR; and (iii) by constraining banks from adjusting their spreads arbitrarily for existing borrowers. Under the MCLR system, transmission to lending rates is indirect and is contingent upon changes in deposit interest rates. However, under the external benchmark system, transmission to lending rates will no longer be contingent upon deposit interest rates. As and when the Monetary Policy Committee changes the policy repo rate, lending interest rates will change, at the most within a quarter. Banks will then need to adjust their deposit rates to protect their NIMs. 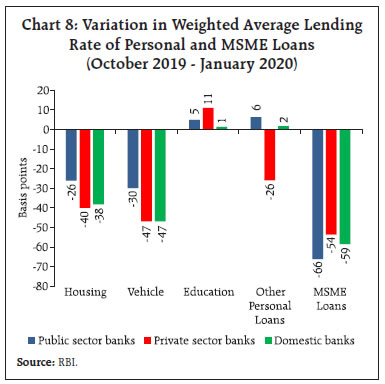 VI. Concluding Observations and Some Final Reflections The success of monetary policy critically hinges on the effective transmission to the entire spectrum of interest rates in the system. The speed and magnitude of monetary transmission varies across various financial market segments – money, bond and credit markets. The analysis of monetary transmission in the Indian context in the recent period suggests that monetary transmission was full and reasonably swift across various money market segments and the private corporate bond market. However, the transmission to bank deposit and lending rates has been delayed and partial for a variety of reasons. The root cause of the delayed and inadequate transmission has been rigidity in banks’ deposit interest rates. Banks hold long-term deposits at fixed interest rates, which do not move in line with the change in the policy rate. Even when banks reduce deposit interest rates in line with the policy rate, the impact of such reduction is felt immediately only on fresh deposits. As a result, banks are unable to reduce lending rates on existing loans, especially in an easing monetary policy cycle. Banks, therefore, wait for the bulk of outstanding deposits to mature and renew them at reduced rates before transmitting the rate reduction to lending rates on past loans. For this reason, it is almost always the case that the transmission to lending rates on outstanding loans lags transmission to outstanding term deposit rates during the easing cycle. As banks will try to protect their NIMs,10 the rigidity in deposit interest rates gets transmitted to their lending interest rates. During the easing cycle, the higher small saving rates vis-à-vis term deposit rates of banks also constrain banks from lowering their deposit interest rates. However, long-term deposits at fixed interest rates and the rigidity in small saving rates imparting rigidity to bank term deposit rates explain only a part of the story. That banks have hardly changed their saving deposit rates suggests that banks prefer not to use interest rates as an instrument for altering their cost of funds in line with the monetary policy cycle. It is intriguing that the same saving deposit interest rate was retained by public sector banks and most private sector banks during the tightening and easing phases. The median saving deposit rate remained unchanged at 4 per cent during October 2011-September 2017, which cannot be consistent with the peak policy rate of 8.5 per cent during the tightening cycle and low policy rate of 6.0 per cent during the easing cycle. The median saving deposit interest rate declined to 3.5 per cent towards the end of 2017 and has remained unchanged thereafter. During this period, the peak policy rate was 6.5 per cent and trough at 5.15 per cent . It is also important to bear in mind that if deposit interest rates do not adjust in line with the policy rate, the recovery is likely to be slow and deposit rates are likely to remain lower than normal/neutral levels for a prolonged period than if interest rates move in line with the policy rate. Transmission to banks’ lending interest rates should ideally follow changes in deposit interest rates, provided deposit interest rates respond swiftly to policy rate changes. In a situation where deposit interest rates are sticky and the interest rates swap market is not well developed to facilitate hedging of interest rate risk on a large scale, transmission to lending rates is bound to be impaired, unless banks are ready to take a hit on their NIMs. Assuming banks would always protect their NIMs, an effective transmission to lending interest rates would require flexibility in deposit interest rates. Under the MCLR system, the transmission from the policy rate to lending rates runs through deposit rates. However, rigidity in deposit interest rates hampers effective monetary transmission to lending rates. This, however, will change under the external benchmark system, as the transmission will no longer be contingent on changes in deposit interest rates by banks. The transmission to lending rates will be direct and almost one to one with respect to the change in the benchmark rate (typically, the policy rate). As banks are expected to protect their NIMs, they would then bring necessary adjustments in their deposit interest rates. Even for outstanding floating rate loans linked to an external benchmark, banks will have to pass on the changes in the benchmark rate to existing borrowers after a quarter as the reset periodicity has also been reduced from annual to quarterly. The external benchmark system is transparent, which can be easily monitored by borrowers. It is expected to ensure quick and almost one to one monetary transmission. References Acharya, V. V. (2017), “Monetary Transmission in India: Why is it important and why hasn’t it worked well?”, Inaugural Speech delivered at the Aveek Guha Memorial Lecture organised by Tata Institute of Fundamental Research (TIFR) at Homi Bhabha Auditorium, Mumbai, November 16. (Retrieved from /en/web/rbi/-/speeches-interview/monetary-transmission-in-india-why-is-it-important-and-why-hasn-t-it-worked-well-1049) John, J., Mitra, A.K., Raj, J. and Rath, D.P. (2016), “Asset Quality and Monetary Transmission”, Reserve Bank of India Occasional Papers, Vol 37 (1&2), 35-62. Reserve Bank of India, “Annual Report”, various issues. ……, “Monetary Policy Report”, various issues. …… (2014), “Report of the Expert Committee to Revise and Strengthen the Monetary Policy Framework” (Chairman: Urjit R. Patel). https://www.rbi.org.in/Scripts/PublicationReportDetails.aspx?UrlPage=&ID=743. ………. (2017), “Report of the Internal Study Group to Review the Working of the Marginal Cost of Funds Based Lending Rate System”. https://www.rbi.org.in/Scripts/PublicationReportDetails.aspx?UrlPage=&ID=878. * This article is prepared by Arghya Kusum Mitra and Sadhan Kumar Chattopadhyay of Monetary Policy Department. The views expressed in the article are those of the authors and not of the institution they represent. The authors acknowledge the inputs provided by Joice John and Krishna M. Kushawaha. Help provided by Avnish Kumar, Sulabha Nadgouda, Sunil B. Sawant and Nilesh Dalal in compilation of data is gratefully acknowledged. 1 Spread is defined as WALR on fresh rupee loans over 1-year MCLR. 2 The other components of MCLR are negative carry on cash reserve ratio (CRR), operating cost and the tenor premium. 3 The maturity profile of deposits and loans is not expected to change significantly, especially in the short run. 4 It does not mean that all deposits will mature in two years – banks issue term deposits ranging from 7 days to 10-year maturity with an average maturity of deposits of two years. 5 Unless otherwise stated, the discussion in this section relates to saving deposit interest rate for deposits up to ₹1 lakh. 6 During 2019-20 so far (up to end-January 2020), 10 public sector banks and three private sector banks had reduced their saving deposit rate (up to ₹1 lakh) by 25 bps to 3.25 per cent. The median saving deposit rate of deposits up to ₹ 1 lakh has declined to 3.25 per cent for public sector banks, while for private sector banks, it remained unchanged at 3.50 per cent. 7 As we saw in Table 5, floating rate loans comprise 76 per cent of the credit portfolio of banks. 8 Financial Express, December 21, 2019 “Banks cannot go beyond a threshold to cut deposit rates as India lacks social security net”, Observations made by Shri Rajnish Kumar, Chairman, SBI at the 92nd FICCI Annual Convention held at New Delhi on December 21, 2019. https://www.financialexpress.com/industry/banking-finance/banks-cannot-go-beyond-athreshold-to-cut-deposit-rates-as-india-lacks-social-security-net-sbichairman/1800774/ 9 Effective April 1, 2020, all banks would be required to link their lending rates to medium enterprises to an external benchmark. 10 Banks that can improve their efficiency in financial intermediation can also charge lower NIMs without a dent on profitability. |
صفحے پر آخری اپ ڈیٹ:


