Performance of Financial and Investment Companies: 2010-11* This article analyses the performance of select non- Government financial and investment companies (other than banking, insurance and chit-fund companies) during the year 2010-11, based on their audited annual accounts. The data are presented at the aggregate level for all select companies and also for various activity groups. The analysis revealed that the growth in financial income increased during the year 2010-11, whereas growth in total expenditure decelerated. Profitability ratios like profit margin, return on assets and return on shareholders’ equity also improved during the year under review. With higher growth in borrowings from banks, debt-equity ratio of select companies increased further in 2010-11. Larger sized companies performed better than the smaller sized companies, but they had higher debtequity ratio. Non-banking financial and investment companies operate as an important adjunct to the banking sector in financial intermediation. They provide support to the capital market through investment holding, share trading and merchant banking activities, to the credit market through short and medium term loans and also help firms in acquiring long term assets through lease and hire purchase activities. This article analyses the performance of non- Government financial and investment companies (other than banking, insurance and chit-fund companies) during the year 2010-11. Annual accounts of 1,344 companies, which closed their accounts during the period April 2010 to March 20111 were considered for the study. The select 1,344 companies accounted for 56.3 per cent of total paid-up capital (provisional estimate supplied by Ministry of Corporate Affairs, GoI) of all non-government financial and investment companies as on March 31, 2011 which is higher than the coverage of 53.9 per cent in the previous study. The segment of financial and investment companies in the private corporate sector is highly skewed. The presence of a large sized company, viz., Housing Development Finance Corporation (HDFC) Limited in the study would exert considerable influence on the overall performance of the companies in this group in terms of various quantitative measures. In view of such marked skewness in the size structure, the analysis presented in the article excludes results of HDFC. Further, it was observed that the results of three other companies were in large variance with the remaining companies and accordingly these companies were also kept outside the scope of the study. Thus, the present analysis is confined to 1,340 companies. However, the data on all the select 1,344 companies including HDFC and other three outlier companies are separately presented in Annex 1 to 3. The study also presents comparable data for the preceding two years 2008-09 and 2009-102 for the same set of companies, based on the analysis of their accounts for the respective years. In the case of companies, which either extended or shortened their accounting year, income, expenditure and appropriation account figures have been annualised. The balance sheet data, however, have been retained as presented in the annual accounts of the companies. The analysis of the financial performance for the year, discussed below, is subject to this limitation. I. Composition of the Select Companies The select 1,340 financial and investment companies were classified into five groups, viz., (1) Share Trading and Investment Holding, (2) Loan Finance (3) Asset Finance (4) Diversified and (5) Miscellaneous. A company was placed in one of the first three principal activity groups if at least half of its annual income during the study year 2010-11 was derived from that principal activity consistent with the income yielding assets. In case no single principal activity was predominant, the company was classified under ‘Diversified’ group. Companies not engaged in any of the above three activities, but conducting financial activities3 were classified under ‘Miscellaneous’ group. The distribution of the select companies among the above mentioned activities in terms of number, paid-up capital, financial income and net assets is presented in Table 1. It is observed that the ‘Share Trading and Investment Holding’ companies dominate the sample in terms of numbers followed by ‘Loan Finance’ companies. However ‘Loan Finance’ companies dominate in terms of financial parameters.
Table 1: Composition of Select 1,340 Companies by Activity – 2010-11 |
(Amount in ` million) |
Activity |
No of Companies |
Paid-up Capital |
Financial Income |
Total Net Assets |
| |
1 |
2 |
3 |
4 |
1. Share Trading and Investment Holding |
605 |
97,601 |
70,783 |
665,655 |
| |
(45.1) |
(26.6) |
(13.8) |
(15.1) |
2. Loan Finance |
455 |
2,11,345 |
3,13,729 |
30,37,914 |
| |
(34.0) |
(57.5) |
(61.2) |
(68.9) |
3. Asset Finance |
78 |
6,274 |
54,930 |
4,19,504 |
| |
(5.8) |
(1.7) |
(10.7) |
(9.5) |
4. Diversified |
15 |
1,686 |
1,761 |
9,716 |
| |
(1.1) |
(0.5) |
(0.3) |
(0.2) |
5. Miscellaneous |
187 |
50,350 |
71,428 |
2,75,137 |
| |
(14.0) |
(13.7) |
(13.9) |
(6.2) |
All Activities |
1,340 |
3,67,257 |
5,12,631 |
44,07,926 |
| |
(100.0) |
(100.0) |
(100.0) |
(100.0) |
| Note: Figures in parentheses represent percentages to total. |
II. Operational Results The financial income of the select 1,340 financial and investment companies grew at a higher rate of 23.8 per cent in 2010-11 as compared to 13.1 per cent in 2009-10 (Statement 1 and Table 2). Interest income, the main component of total income, also grew at a much higher rate of 36.2 per cent compared to 6.9 per cent growth in 2009-10. Together with non-financial income, total income increased by 22.9 per cent during 2010-11. As against this, growth in total expenditure was 2.9 per cent in 2010-11. Interest payments registered 25.9 per cent growth in 2010-11 as against 2.0 per cent growth in 2009-10. Employees’ remuneration witnessed marginally lower growth of 11.1 per cent in 2010-11. However, lower amount of bad debts and provisions restricted the total expenditure. Profits of the select companies grew almost at the same rate as that of the previous year. However with lower growth in dividend payments, retained profits increased at much higher rate in 2010-11. The ‘Loan Finance’ and ‘Asset Finance’ companies recorded higher growth in profits in 2010-11 as compared with that in 2009-10 while for ‘Share Trading and Investment Holding ’ companies profit growth decelerated reflecting adverse capital market conditions. Operating profit margin (measured as a ratio of financial income) of the select companies increased to 37.4 per cent in 2010-11 from 32.0 per cent in 2009-10 (Statement 2 and Table 3). The return on shareholders’ equity (ratio of net profits to net worth) of the select companies was higher at 9.3 per cent in 2010-11 compared with 7.2 per cent registered in 2009-10. Similarly, the return on assets (ratio of net profits to total net assets) improved in 2010-11. Dividend payout ratio (ratio of dividends to net profits) declined but the dividend rate (ratio of dividend paid to total paid up capital) increased to 7.6 per cent in 2010-11 from 7.3 per cent in 2009-10. The ratio of bad debts (including provisions for the same) to total income declined to 2.0 per cent in 2010-11 from 4.8 per cent of in 2009-10.
Table 2: Growth Rate of Select Items: 2009-10 and 2010-11 |
(Per cent) |
Activity |
All Activities |
Share Trading and Investment Holding |
Loan Finance |
Asset Finance |
Diversified |
Miscellaneous |
Item |
2009-10 |
2010-11 |
2009-10 |
2010-11 |
2009-10 |
2010-11 |
2009-10 |
2010-11 |
2009-10 |
2010-11 |
2009- 10 |
2010-11 |
| |
1 |
2 |
3 |
4 |
5 |
6 |
7 |
8 |
9 |
10 |
11 |
12 |
1. Financial Income |
13.1 |
23.8 |
19.4 |
8.6 |
8.7 |
32.4 |
15.0 |
28.8 |
23.4 |
26.9 |
22.5 |
5.3 |
2. Total Income |
12.5 |
22.9 |
22.5 |
9.6 |
8.6 |
29.9 |
11.2 |
30.2 |
20.2 |
24.5 |
19.1 |
6.4 |
3. Total Expenditure |
5.1 |
2.9 |
27.6 |
-2.0 |
-0.1 |
1.0 |
14.7 |
5.2 |
6.6 |
14.5 |
3.3 |
6.3 |
4. Operating Profits |
46.1 |
47.3 |
34.0 |
9.4 |
31.3 |
89.1 |
47.3 |
60.8 |
67.9 |
30.1 |
251.0 |
0.4 |
5. Net Profits |
54.8 |
56.0 |
41.5 |
9.4 |
40.5 |
100.9 |
20.8 |
92.6 |
72.8 |
26.2 |
# |
37.4 |
# Denominator is negative, nil or negligible. |
Table 3: Select Profitability Ratios: 2009-10 and 2010-11 |
(Per cent) |
Activity |
All Activities |
Share Trading and Investment Holding |
Loan Finance |
Asset Finance |
Diversified |
Miscellaneous |
Item |
2009-10 |
2010-11 |
2009-10 |
2010-11 |
2009-10 |
2010-11 |
2009-10 |
2010-11 |
2009-10 |
2010-11 |
2009-10 |
2010-11 |
| |
1 |
2 |
3 |
4 |
5 |
6 |
7 |
8 |
9 |
10 |
11 |
12 |
1. Operating Profit Margin |
32.0 |
37.4 |
64.9 |
65.8 |
23.1 |
32.6 |
24.4 |
30.4 |
68.8 |
83.2 |
36.6 |
34.1 |
2. Tax Provision to Earnings before Tax (EBT)* |
28.3 |
29.2 |
19.0 |
21.7 |
32.0 |
31.3 |
36.2 |
33.2 |
35.8 |
35.7 |
34.1 |
34.0 |
3. Return on Share holders' equity |
7.2 |
9.3 |
8.4 |
8.3 |
6.1 |
9.6 |
11.4 |
17.6 |
10.9 |
8.5 |
6.0 |
6.8 |
4. Dividend Rate |
7.3 |
7.6 |
9.6 |
9.1 |
6.1 |
7.0 |
16.9 |
23.1 |
12.3 |
6.6 |
5.7 |
5.0 |
5. Return on Assets |
2.1 |
2.6 |
5.3 |
5.1 |
1.4 |
2.0 |
1.7 |
2.5 |
5.1 |
5.3 |
2.4 |
2.8 |
* Calculated based on the companies which made profits during that year. |
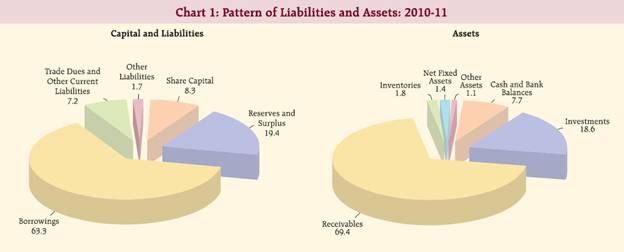
The operating profit margin increased across all activity groups except ‘Miscellaneous’ group during 2010-11. Return on share holders’ equity rose appreciably for ‘Loan Finance’ and ‘Asset Finance’ companies. The dividend rate at 23.1 per cent was the highest for ‘Asset Finance’ companies. III. Liabilities and Assets Structure4 Liabilities Structure Borrowings which constituted major part of total liabilities of financial companies increased its share further to 63.3 per cent in 2010-11 from 59.7 per cent in the previous year (Chart 1, Table 4 and Statement 4). This was mainly contributed by the increase in the share of bank borrowings. The debt-equity ratio increased to 147.2 per cent in 2010-11 from 130.8 per cent in 2009-10; it was 122.1 per cent in 2008-09. On a broader measure, the ratio of total outside liabilities to net worth increased to 261.2 per cent in 2010-11 from 236.0 per cent in 2009-10.
Table 4: Liabilities Structure of Select Financial and Investment Companies: 2009-10 and 2010-11 |
(Per cent) |
Capital and Liabilities |
All Activities |
Share Trading and Investment Holding |
Loan Finance |
Asset Finance |
Diversified |
Miscellaneous |
2009-10 |
2010-11 |
2009-10 |
2010-11 |
2009-10 |
2010-11 |
2009-10 |
2010-11 |
2009-10 |
2010-11 |
2009-10 |
2010-11 |
| |
1 |
2 |
3 |
4 |
5 |
6 |
7 |
8 |
9 |
10 |
11 |
12 |
A. Share Capital |
9.8 |
8.3 |
16.1 |
14.7 |
8.3 |
7.0 |
1.8 |
1.5 |
10.8 |
17.4 |
19.3 |
18.3 |
B. Reserves and Surplus |
20.0 |
19.4 |
47.3 |
46.7 |
14.0 |
14.0 |
12.9 |
12.5 |
36.0 |
45.0 |
19.8 |
22.7 |
C. Borrowings |
59.7 |
63.3 |
21.8 |
28.2 |
71.6 |
73.4 |
78.7 |
79.7 |
31.9 |
25.5 |
15.6 |
13.5 |
of which, |
|
|
|
|
|
|
|
|
|
|
|
|
(i) Debentures@ |
21.2 |
22.3 |
4.6 |
8.5 |
25.1 |
26.1 |
39.4 |
30.3 |
4.4 |
0.0 |
1.6 |
1.4 |
(ii) Bank borrowings |
23.6 |
28.6 |
8.4 |
10.1 |
29.6 |
33.5 |
24.3 |
38.3 |
25.1 |
21.0 |
3.7 |
5.5 |
D. Trade Dues and Other Current Liabilities |
8.7 |
7.2 |
12.7 |
8.2 |
4.3 |
3.9 |
5.9 |
5.6 |
19.3 |
10.6 |
43.8 |
44.1 |
of which, |
|
|
|
|
|
|
|
|
|
|
|
|
Sundry Creditors |
3.4 |
2.8 |
3.7 |
2.1 |
0.8 |
1.0 |
2.7 |
2.4 |
12.7 |
7.0 |
28.1 |
24.2 |
E. Other Liabilities |
1.8 |
1.7 |
2.1 |
2.2 |
1.8 |
1.7 |
0.7 |
0.7 |
2.0 |
1.6 |
1.5 |
1.4 |
Total |
100.0 |
100.0 |
100.0 |
100.0 |
100.0 |
100.0 |
100.0 |
100.0 |
100.0 |
100.0 |
100.0 |
100.0 |
@: includes privately placed debentures. |
For the ‘Loan Finance’ and ‘Asset Finance’ companies, which depend more on borrowed funds, the debt-equity ratio moved in opposite directions. While for ‘ Loan Finance’ companies the debt-equity ratio increased further to 244.5 per cent in 2010-11, the ‘Asset Finance’ companies could lower their debt- equity ratio from a high of 322.0 per cent in 2009-10 to 263.0 per cent in 2010-11.
Assets Structure The assets pattern of the select companies showed that while the share of ‘Loans and Advances’ in total assets increased to 66.0 per cent in 2010-11 from 63.0 per cent in 2009-10, the share of ‘Investments’ marginally declined to 18.6 per cent from 19.2 per cent and liquid funds in the form of ‘Cash and Bank Balances’ declined to 7.7 per cent from 9.4 per cent in the same period (Table 5). The assets structure of the companies in various groups was in line with the major activity undertaken by them. Investments accounted for a major share (58.1 per cent) of total assets for ‘Share Holding and Investment Holding’ companies, whereas, loans and advances extended formed a major share for companies engaged in ‘Loan Finance’ and ‘Asset Finance’ activities in 2010-11.
Table 5: Assets Structure of Select Financial and Investment Companies: 2009-10 and 2010-11 |
(Per cent) |
Assets |
All Activities |
Share Trading and Investment Holding |
Loan Finance |
Asset Finance |
Diversified |
Miscellaneous |
2009-10 |
2010-11 |
2009-10 |
2010-11 |
2009-10 |
2010-11 |
2009-10 |
2010-11 |
2009-10 |
2010-11 |
2009-10 |
2010-11 |
| |
1 |
2 |
3 |
4 |
5 |
6 |
7 |
8 |
9 |
10 |
11 |
12 |
A. Cash and Bank Balances |
9.4 |
7.7 |
12.1 |
8.4 |
5.3 |
4.7 |
8.6 |
6.6 |
24.4 |
18.6 |
42.0 |
40.5 |
of which, |
|
|
|
|
|
|
|
|
|
|
|
|
Deposits with Banks |
9.2 |
7.5 |
12.1 |
8.4 |
5.1 |
4.5 |
8.4 |
6.4 |
23.9 |
18.5 |
41.9 |
40.5 |
B. Investments |
19.2 |
18.6 |
53.3 |
58.1 |
12.5 |
11.9 |
3.6 |
4.6 |
5.8 |
7.6 |
20.9 |
18.3 |
C. Receivables |
66.7 |
69.4 |
26.4 |
25.6 |
78.8 |
80.3 |
84.8 |
86.2 |
52.7 |
61.5 |
26.3 |
30.2 |
of which, |
|
|
|
|
|
|
|
|
|
|
|
|
(i) Loans and advances |
63.0 |
66.0 |
22.0 |
21.9 |
76.8 |
78.3 |
83.2 |
85.5 |
37.6 |
47.1 |
6.2 |
6.6 |
(ii) Sundry debtors |
1.8 |
1.9 |
1.8 |
2.0 |
0.6 |
0.4 |
0.2 |
0.2 |
12.7 |
12.1 |
15.7 |
19.8 |
D. Inventories |
2.1 |
1.8 |
5.3 |
4.1 |
1.4 |
1.4 |
0.5 |
0.3 |
5.3 |
1.9 |
3.1 |
3.7 |
of which, |
|
|
|
|
|
|
|
|
|
|
|
|
Industrial Securities |
1.8 |
1.5 |
4.9 |
3.8 |
1.0 |
1.0 |
0.4 |
0.2 |
4.5 |
1.2 |
2.7 |
3.4 |
E. Net Fixed Assets |
1.5 |
1.4 |
1.4 |
1.7 |
1.0 |
0.9 |
2.4 |
2.0 |
11.5 |
10.2 |
5.0 |
4.8 |
F. Other Assets |
1.1 |
1.1 |
1.4 |
2.1 |
1.0 |
0.8 |
0.2 |
0.3 |
0.2 |
0.1 |
2.6 |
2.5 |
Total |
100.0 |
100.0 |
100.0 |
100.0 |
100.0 |
100.0 |
100.0 |
100.0 |
100.0 |
100.0 |
100.0 |
100.0 |
IV. Sources and Uses of Funds Sources of Funds The select companies raised funds amounting to `1006 billion during 2010-11 as against `482 billion raised during the previous year (Statement 5). Funds raised through external sources (other than own sources) increased to `900 million (89.5 per cent) from `516 million (107.2 per cent) in the previous year (Table 6A). Issue of fresh capital (including premium on shares) contributed to 11.2 per cent in the total sources of funds during 2010-11 (18.3 per cent during 2009-10). The share of borrowings was lower at 75.8 per cent (78.9 per cent during 2009-10); however, the share of borrowing from banks increased to 45.7 per cent (29.6 per cent in the previous year). Addition to reserves and surplus was another important sources of funds (9.5 per cent).
Table 6A: Composition of Sources of Funds: 2009-10 and 2010-11 |
(Per cent) |
Year |
All Activities |
Share Trading and Investment Holding |
Loan Finance |
Asset Finance |
Diversified |
Miscellaneous |
2009-10 |
2010-11 |
2009-10 |
2010-11 |
2009-10 |
2010-11 |
2009-10 |
2010-11 |
2009-10 |
2010-11 |
2009-10 |
2010-11 |
| |
1 |
2 |
3 |
4 |
5 |
6 |
7 |
8 |
9 |
10 |
11 |
12 |
| Sources of Funds |
|
|
|
|
|
|
|
|
|
|
|
|
Internal Sources (Own sources) |
-7.2 |
10.5 |
34.3 |
29.4 |
-26.5 |
8.6 |
7.0 |
8.0 |
27.3 |
20.4 |
4.7 |
15.5 |
A. Paid-up Capital |
0.5 |
0.1 |
0.0 |
0.1 |
1.0 |
0.1 |
0.0 |
0.0 |
0.0 |
0.0 |
0.0 |
0.1 |
B. Reserves and Surplus |
9.4 |
9.5 |
28.8 |
29.2 |
6.1 |
7.3 |
5.9 |
9.0 |
22.4 |
24.9 |
3.4 |
14.4 |
C. Provisions |
-17.0 |
1.0 |
5.5 |
0.1 |
-33.6 |
1.3 |
1.2 |
-1.0 |
4.9 |
-4.5 |
1.2 |
1.0 |
of which: |
|
|
|
|
|
|
|
|
|
|
|
|
Depreciation Provision |
0.7 |
0.1 |
0.0 |
0.1 |
0.6 |
0.1 |
-0.1 |
-0.9 |
3.5 |
-3.9 |
2.5 |
3.7 |
External Sources (Other than own sources) |
107.2 |
89.5 |
65.7 |
70.6 |
126.5 |
91.4 |
93.0 |
92.0 |
72.7 |
79.6 |
95.3 |
84.5 |
D. Paid-up Capital |
18.3 |
11.2 |
44.8 |
19.1 |
16.8 |
9.9 |
1.4 |
2.9 |
27.0 |
116.2 |
12.5 |
38.3 |
of which: Premium on Shares |
9.7 |
7.7 |
17.2 |
14.3 |
11.3 |
6.7 |
1.3 |
2.3 |
3.5 |
66.3 |
5.0 |
26.4 |
E. Borrowings |
78.9 |
75.8 |
23.1 |
74.8 |
102.6 |
78.7 |
102.9 |
84.5 |
14.9 |
-5.0 |
25.4 |
0.4 |
of which: From Banks |
29.6 |
45.7 |
-2.6 |
22.5 |
43.6 |
44.7 |
33.4 |
84.4 |
73.9 |
1.3 |
6.8 |
17.1 |
F. Trade Dues and Other Current Liabilities |
9.7 |
2.4 |
-3.3 |
-23.7 |
7.1 |
2.8 |
-11.3 |
4.6 |
30.8 |
-31.7 |
57.1 |
45.8 |
of which: Sundry Creditors |
2.7 |
0.6 |
-21.4 |
-9.4 |
1.4 |
1.6 |
2.0 |
1.6 |
16.6 |
-20.6 |
35.2 |
-0.8 |
G. Others |
0.3 |
0.1 |
1.1 |
0.4 |
0.1 |
0.1 |
0.0 |
0.0 |
0.0 |
0.0 |
0.3 |
0.0 |
Total Sources of Funds |
100.0 |
100.0 |
100.0 |
100.0 |
100.0 |
100.0 |
100.0 |
100.0 |
100.0 |
100.0 |
100.0 |
100.0 |
Companies engaged in ‘Share Trading and Investment Holding’ (74.8 per cent), ‘Loan Finance’ (78.7 per cent) and ‘Asset Finance’ (84.5 per cent) relied mainly on borrowings but to varying degree for expanding their business. For the ‘Asset Finance’ companies, entire increase in borrowings was financed by banks. Uses of Funds The pattern of uses of funds of the select companies showed that the share of ‘Loans and Advances’ in the total uses of funds declined to 76.3 per cent during 2010-11 from 81.4 per cent in 2009-10, whereas, the share of ‘Investments’ in total uses of funds increased to 16.6 per cent from 2.4 per cent during the same period (Table 6B).
Table 6B: Composition of Uses of Funds: 2009-10 and 2010-11 |
Year |
All Activities |
Share Trading
and Investment
Holding |
Loan Finance |
Asset Finance |
Diversified |
Miscellaneous |
2009-10 |
2010-11 |
2009-10 |
2010-11 |
2009-10 |
2010-11 |
2009-10 |
2010-11 |
2009-10 |
2010-11 |
2009-10 |
2010-11 |
| |
1 |
2 |
3 |
4 |
5 |
6 |
7 |
8 |
9 |
10 |
11 |
12 |
Uses of Funds |
|
|
|
|
|
|
|
|
|
|
|
|
A. Cash and Bank Balances |
3.6 |
2.1 |
28.5 |
-17.5 |
-17.4 |
2.9 |
16.8 |
0.1 |
9.4 |
-9.3 |
41.7 |
31.4 |
of which: |
|
|
|
|
|
|
|
|
|
|
|
|
Deposits with Banks |
3.5 |
1.9 |
30.3 |
-17.6 |
-18.0 |
2.7 |
16.9 |
0.0 |
11.2 |
-7.3 |
41.7 |
31.4 |
B. Investments |
2.4 |
16.6 |
26.1 |
93.8 |
-7.7 |
10.4 |
1.3 |
7.8 |
2.8 |
16.8 |
16.3 |
1.7 |
of which: |
|
|
|
|
|
|
|
|
|
|
|
|
(a) Government and Semi-Government Securities |
-0.8 |
-1.0 |
-4.5 |
-8.2 |
-0.3 |
-0.4 |
0.2 |
0.0 |
0.1 |
0.2 |
0.1 |
-0.3 |
(b) Mutual Funds |
0.8 |
0.1 |
13.4 |
-14.8 |
-3.7 |
2.3 |
-1.6 |
1.9 |
0.1 |
0.4 |
6.8 |
-18.0 |
(c) Shares and Debentures of Other Indian Companies |
-10.3 |
10.5 |
-11.1 |
74.0 |
-16.9 |
5.4 |
1.0 |
0.9 |
2.7 |
13.1 |
3.3 |
3.9 |
C. Receivables |
87.8 |
79.0 |
24.0 |
20.5 |
122.9 |
84.5 |
80.8 |
92.6 |
71.1 |
106.9 |
32.3 |
54.4 |
of which: |
|
|
|
|
|
|
|
|
|
|
|
|
(a) Loans and Advances |
81.4 |
76.3 |
21.6 |
22.1 |
119.3 |
82.8 |
82.5 |
94.8 |
59.5 |
95.8 |
1.3 |
9.5 |
(b) Sundry Debtors |
4.7 |
2.1 |
-3.0 |
3.5 |
1.1 |
0.1 |
-0.4 |
0.1 |
11.7 |
9.8 |
33.0 |
44.8 |
D. Inventories |
4.6 |
0.9 |
19.4 |
-4.1 |
0.5 |
1.3 |
1.1 |
-0.3 |
4.4 |
-14.9 |
7.8 |
6.9 |
of which: |
|
|
|
|
|
|
|
|
|
|
|
|
Industrial Securities |
2.8 |
0.6 |
17.2 |
-3.9 |
-2.0 |
0.8 |
1.2 |
-0.3 |
5.0 |
-15.1 |
7.1 |
8.2 |
E. Gross Fixed Assets |
1.6 |
1.2 |
1.6 |
3.5 |
1.7 |
0.8 |
0.0 |
-0.2 |
11.5 |
0.7 |
2.7 |
7.0 |
F. Other Assets |
0.0 |
0.3 |
0.5 |
3.9 |
0.0 |
0.0 |
0.0 |
0.0 |
0.8 |
-0.2 |
-0.8 |
-1.3 |
Total Uses of Funds |
100.0 |
100.0 |
100.0 |
100.0 |
100.0 |
100.0 |
100.0 |
100.0 |
100.0 |
100.0 |
100.0 |
100.0 |
In line with the major activity, companies engaged in ‘Loan Finance’ and ’Asset Finance’ activities deployed major portion of their additional funds in loans and advances while those engaged in ‘Share Trading and Investment Holding’ used it for investments. V. Performance of Companies by Size of Financial Income On analysing the performance of companies according to size, it was observed that the financial income and operating profit of small sized companies (with financial income up to `500 million) declined in 2010-11 (Table 7). In contrast, the companies in the largest size group (with financial income ‘`1 billion and above’) recorded impressive growth in income and profits.
Table 7: Performance of Companies by size of Financial Income |
(Per cent) |
A. Growth Rates of Select items |
Financial Income Size Group |
No of Cos. |
Financial Income |
Operating Profits |
Total Net Assets |
2009-10 |
2010-11 |
2009-10 |
2010-11 |
2009-10 |
2010-11 |
Less than `10 million |
786 |
87.4 |
-75.8 |
133.4 |
-70.2 |
-13.2 |
-5.8 |
`10 million -`100 million |
309 |
11.8 |
-15.0 |
49.8 |
-34.4 |
12.2 |
8.8 |
`100 million -`500 million |
143 |
43.7 |
-0.6 |
# |
-9.9 |
11.9 |
7.7 |
`500 million -`1 billion |
32 |
-29.4 |
7.0 |
-48.4 |
-7.7 |
21.7 |
11.3 |
`1 billion and above |
70 |
14.6 |
29.7 |
58.1 |
55.5 |
18.9 |
35.9 |
B. Select Financial Ratios |
Financial Income Size Group |
Operating Profit Margin |
Debt to Equity Ratio |
Tax Provision to EBT* |
2008-09 |
2009-10 |
2010-11 |
2008-09 |
2009-10 |
2010-11 |
2008-09 |
2009-10 |
2010-11 |
Less than `10 million |
-176.7 |
-220.0 |
-270.7 |
25.9 |
26.6 |
17.8 |
15.8 |
23.8 |
27.1 |
`10 million -`100 million |
27.9 |
37.5 |
28.9 |
11.4 |
12.4 |
10.2 |
33.1 |
30.5 |
30.5 |
`100 million -`500 million |
6.9 |
38.7 |
35.1 |
12.2 |
13.1 |
15.5 |
22.0 |
23.6 |
22.2 |
`500 million -`1 billion |
53.9 |
39.4 |
34.0 |
14.9 |
23.6 |
34.1 |
15.9 |
18.1 |
18.3 |
`1 billion and above |
20.5 |
28.3 |
33.9 |
211.4 |
220.3 |
234.7 |
10.7 |
16.9 |
17.6 |
# Denominator is negative, nil or negligible.
* Calculated based on the companies which made profi ts during that year. |
Barring the companies in smallest size class (with financial income less than `10 million each) which registered operating loss, profit margin of mid-sized companies (with financial income `10 million- `1 billion’ each) was impressive but lower than that in 2009-10. Only the companies with financial income ‘above `1 billion’ each, improved their profit margin in 2010-11. Again, it was the largest sized companies that could attract considerable debt as debt to equity ratio was the highest at 234.7 per cent for the companies with financial income ‘`1 billion and above’, and that in the next size class ‘`500 million – `1 billion’ it was at 34.1 per cent.
Table 8: Performance of Companies by size of Paid-up capital |
(Per cent) |
A. Growth Rates of Select items |
PUC Size Group |
No of Cos. |
Financial Income |
Operating Profits |
Total Net Assets |
2009-10 |
2010-11 |
2009-10 |
2010-11 |
2009-10 |
2010-11 |
Less than `10 million |
363 |
17.8 |
-6.8 |
17.4 |
-11.4 |
14.0 |
81.0 |
`10 million -`100 million |
687 |
31.1 |
12.4 |
84.1 |
28.2 |
10.9 |
14.5 |
`100 million -`500 million |
184 |
10.9 |
16.4 |
7.1 |
7.8 |
29.8 |
15.1 |
`500 million -`1 billion |
39 |
9.9 |
36.1 |
27.2 |
48.9 |
12.8 |
37.9 |
`1 billion and above |
67 |
11.9 |
25.6 |
130.5 |
94.8 |
15.9 |
31.0 |
B. Select Financial Ratios |
PUC Size Group |
Operating Profit Margin |
Debt to Equity Ratio |
Tax Provision to EBT* |
2008-09 |
2009-10 |
2010-11 |
2008-09 |
2009-10 |
2010-11 |
2008-09 |
2009-10 |
2010-11 |
Less than `10 million |
75.6 |
75.3 |
71.6 |
7.1 |
6.1 |
74.4 |
12.0 |
11.1 |
12.0 |
`10 million -`100 million |
20.8 |
29.2 |
33.4 |
36.7 |
37.6 |
46.5 |
26.3 |
24.9 |
26.5 |
`100 million -`500 million |
39.4 |
38.1 |
35.3 |
43.0 |
51.9 |
55.9 |
21.6 |
29.7 |
29.1 |
`500 million -`1 billion |
25.9 |
29.9 |
32.7 |
258.9 |
273.8 |
341.0 |
30.5 |
31.7 |
30.9 |
`1 billion and above |
9.8 |
20.2 |
31.3 |
146.1 |
153.2 |
153.5 |
34.7 |
29.6 |
30.7 |
* Calculated based on the companies which made profits during that year. |
VI. Performance of companies by size of Paid-up Capital When grouped according to paid up capital (PUC), growth rates of financial income and operating profits generally increased with size. The operating profit margin moved in a close range except that for smallest sized companies, i.e., PUC with ‘Less than `10 million’ each, it was the highest at 71.6 per cent. Debt to equity ratio was the highest at 341.0 per cent for the companies with PUC in the range `500 million – `1 billion, followed by 153.5 per cent for the group with PUC ‘above `1 billion’ each. Concluding Observations It was observed from the aggregate results of the select 1,340 non-Government financial and investment companies that as growth in financial income improved during the year 2010-11, operating profits maintained its impressive growth and profit margin improved further. With higher recourse to bank borrowings, debtequity ratio of select companies rose further. But the ability to contract sizeable debt remained restricted to large sized companies. It was also observed that performance of financial companies’ generally improved with size of financial income or paid up capital.
Statement 1: Growth Rates of the Select Items of the Select Financial and
Investment Companies: 2009-10 and 2010-11 |
(Per cent) |
Item |
All Activities |
Share Trading and Investment Holding |
Loan Finance |
(1340) |
(605) |
(455) |
2009-10 |
2010-11 |
2009-10 |
2010-11 |
2009-10 |
2010-11 |
| |
1 |
2 |
3 |
4 |
5 |
6 |
1. Financial Income |
13.1 |
23.8 |
19.4 |
8.6 |
8.7 |
32.4 |
Of which: Interest Received |
6.9 |
36.2 |
-7.1 |
28.0 |
7.3 |
36.3 |
Dividend Received |
22.8 |
-1.1 |
26.6 |
1.5 |
33.3 |
-18.8 |
2. Non-Financial Income |
-9.2 |
17.5 |
2.4 |
17.0 |
6.6 |
41.6 |
3. Total Income |
12.5 |
22.9 |
22.5 |
9.6 |
8.6 |
29.9 |
4. Total Expenditure |
5.1 |
2.9 |
27.6 |
-2.0 |
-0.1 |
1.0 |
5. Interest Payment |
2.0 |
25.9 |
-28.3 |
27.8 |
5.1 |
25.9 |
6. Employees' Remuneration |
13.0 |
11.1 |
9.6 |
22.6 |
11.4 |
15.7 |
7. Operating Profits |
46.1 |
47.3 |
34.0 |
9.4 |
31.3 |
89.1 |
8. Depreciation Provision |
-7.4 |
-3.4 |
11.8 |
3.5 |
-29.4 |
3.7 |
9. Earnings before Tax & Non-operating Surplus/Deficit |
51.0 |
50.5 |
34.0 |
9.6 |
37.6 |
93.3 |
10. Non-Operating Surplus/ deficit |
-33.1 |
-151.6 |
# |
127.6 |
-1.5 |
-268.2 |
11. Earnings before Tax |
47.4 |
46.5 |
40.6 |
11.1 |
35.5 |
78.9 |
12. Tax Provision |
35.4 |
29.1 |
37.5 |
17.0 |
28.5 |
45.3 |
13. Net Profits |
54.8 |
56.0 |
41.5 |
9.4 |
40.5 |
100.9 |
14. Dividend Paid |
62.2 |
15.5 |
57.4 |
-0.9 |
72.8 |
30.2 |
15. Profits Retained |
51.4 |
76.1 |
35.8 |
13.7 |
26.3 |
143.4 |
16. Investments @ |
1.8 |
25.6 |
6.9 |
24.7 |
-6.7 |
29.2 |
17. Loans and Advances @ |
23.2 |
35.8 |
11.4 |
15.1 |
22.1 |
37.4 |
18. Total Net Assets @ |
16.4 |
29.8 |
14.7 |
14.6 |
13.1 |
35.0 |
19. Borrowings @ |
23.1 |
37.6 |
16.2 |
48.3 |
20.0 |
38.4 |
Of which, from Banks @ |
21.6 |
57.2 |
-3.9 |
37.9 |
20.7 |
52.8 |
20. Net Worth @ |
15.6 |
20.7 |
18.3 |
10.8 |
14.3 |
27.1 |
@ adjusted for revaluation, etc., if any.
# Denominator is negative, nil or negligible.
Note: Figures in brackets below the activitity name represents the number of companies in the activity. |
Statement 1: Growth Rates of the Select Items of the Select Financial and
Investment Companies: 2009-10 and 2010-11 (Concld.) |
(Per cent) |
Item |
Asset Finance |
Diversified |
Miscellaneous |
(78) |
(15) |
(187) |
2009-10 |
2010-11 |
2009-10 |
2010-11 |
2009-10 |
2010-11 |
| |
7 |
8 |
9 |
10 |
11 |
12 |
1. Financial Income |
15.0 |
28.8 |
23.4 |
26.9 |
22.5 |
5.3 |
Of which: Interest Received |
70.1 |
55.7 |
18.3 |
68.6 |
7.5 |
37.8 |
Dividend Received |
32.1 |
160.6 |
-9.4 |
-31.3 |
-28.1 |
4.3 |
2. Non-Financial Income |
-42.9 |
23.1 |
0.1 |
-42.3 |
13.9 |
-25.2 |
3. Total Income |
11.2 |
30.2 |
20.2 |
24.5 |
19.1 |
6.4 |
4. Total Expenditure |
14.7 |
5.2 |
6.6 |
14.5 |
3.3 |
6.3 |
5. Interest Payment |
1.8 |
29.3 |
-25.7 |
55.1 |
1.6 |
-0.8 |
6. Employees' Remuneration |
15.5 |
25.3 |
9.3 |
40.9 |
14.4 |
3.4 |
7. Operating Profits |
47.3 |
60.8 |
67.9 |
30.1 |
251.0 |
0.4 |
8. Depreciation Provision |
6.1 |
-10.1 |
2.8 |
18.9 |
13.2 |
-9.1 |
9. Earnings before Tax & Non-operating Surplus/Deficit |
47.8 |
70.0 |
77.9 |
25.3 |
559.3 |
2.2 |
10. Non-Operating Surplus/ deficit |
-127.9 |
# |
-112.1 |
# |
-105.9 |
# |
11. Earnings before Tax |
27.8 |
77.8 |
68.8 |
26.4 |
270.2 |
8.7 |
12. Tax Provision |
40.4 |
55.1 |
62.1 |
27.0 |
51.8 |
-14.1 |
13. Net Profits |
20.8 |
92.6 |
72.8 |
26.2 |
# |
37.4 |
14. Dividend Paid |
61.5 |
49.3 |
3.8 |
3.7 |
42.8 |
-4.0 |
15. Profits Retained |
14.5 |
102.1 |
125.7 |
34.1 |
# |
74.4 |
16. Investments @ |
9.4 |
66.8 |
8.8 |
58.8 |
28.6 |
1.3 |
17. Loans and Advances @ |
30.0 |
35.2 |
31.4 |
42.8 |
80.4 |
39.7 |
18. Total Net Assets @ |
30.4 |
31.2 |
19.3 |
21.1 |
39.2 |
16.0 |
19. Borrowings @ |
44.1 |
33.2 |
8.5 |
-3.2 |
87.1 |
0.4 |
Of which, from Banks @ |
47.3 |
107.1 |
98.4 |
1.1 |
110.0 |
74.0 |
20. Net Worth @ |
13.1 |
24.9 |
21.6 |
61.3 |
13.4 |
21.6 |
Statement 2: Select Financial Ratios of the Select Financial and Investment Companies –
Activity-wise: 2009-10 and 2010-11 |
(Per cent) |
Item |
All Activities |
Share Trading and
Investment Holding |
Loan Finance |
(1340) |
(605) |
(455) |
2008-09 |
2009-10 |
2010-11 |
2008-09 |
2009-10 |
2010-11 |
2008-09 |
2009-10 |
2010-11 |
| |
1 |
2 |
3 |
4 |
5 |
6 |
7 |
8 |
9 |
Prifit Allocation Ratios |
|
|
|
|
|
|
|
|
|
1. Tax Provision to EBT* |
27.2 |
28.3 |
29.2 |
17.4 |
19.0 |
21.7 |
32.2 |
32.0 |
31.3 |
2. Dividends to EBT |
19.5 |
21.5 |
16.9 |
20.1 |
22.5 |
20.1 |
17.8 |
22.7 |
16.5 |
3. Profits Retained to EBT |
42.2 |
43.3 |
52.1 |
57.2 |
55.3 |
56.5 |
40.5 |
37.7 |
51.3 |
4. Dividends to Net Profits |
31.6 |
33.1 |
24.5 |
26.0 |
29.0 |
26.2 |
30.5 |
37.6 |
24.3 |
5. Profits Retained to Net Profits |
68.4 |
66.9 |
75.5 |
74.0 |
71.0 |
73.8 |
69.5 |
62.5 |
75.7 |
Profitability Ratios |
|
|
|
|
|
|
|
|
|
6. Operating Profits to Financial Income |
24.5 |
32.0 |
37.4 |
58.0 |
64.9 |
65.8 |
18.9 |
23.1 |
32.6 |
7. Operating Profits to Total Net Assets |
2.7 |
3.4 |
3.9 |
5.8 |
6.8 |
6.5 |
1.9 |
2.2 |
3.1 |
8. Net Profits to Total Net Assets |
1.6 |
2.1 |
2.6 |
4.3 |
5.3 |
5.1 |
1.1 |
1.4 |
2.0 |
9. Net Profits to Net Worth |
5.4 |
7.2 |
9.3 |
7.0 |
8.4 |
8.3 |
4.9 |
6.1 |
9.6 |
10. Dividends to Total Paid-up Capital |
5.1 |
7.3 |
7.6 |
7.9 |
9.6 |
9.1 |
3.9 |
6.1 |
7.0 |
11. Dividends to Net Worth |
1.7 |
2.4 |
2.3 |
1.8 |
2.4 |
2.2 |
1.5 |
2.3 |
2.3 |
Capital Structure Ratios |
|
|
|
|
|
|
|
|
|
12. Net Worth to Total Net Assets |
30.0 |
29.8 |
27.7 |
61.5 |
63.4 |
61.3 |
22.0 |
22.2 |
20.9 |
13. Debt to Equity |
122.1 |
130.8 |
147.2 |
8.7 |
11.6 |
19.2 |
211.4 |
224.0 |
244.5 |
14. Total outside Liabilities to Net Worth |
233.8 |
236.0 |
261.2 |
62.7 |
57.9 |
63.3 |
355.4 |
350.4 |
378.2 |
15. Borrowings to Total Assets |
56.4 |
59.7 |
63.3 |
21.5 |
21.8 |
28.2 |
67.5 |
71.6 |
73.4 |
16. Bank Borrowing to Total Borrowing |
40.1 |
39.6 |
45.2 |
46.5 |
38.4 |
35.7 |
41.1 |
41.3 |
45.6 |
* Calculated based on the companies which made profits during that year.
Note: Figures in brackets below the activitity name represents the number of companies in the activity. |
Statement 2: Select Financial Ratios of the Select Financial and Investment Companies –
Activity-wise: 2009-10 and 2010-11 (Concld.) |
(Per cent) |
Item |
Asset Finance |
Diversified |
Miscellaneous |
(78) |
(15) |
(187) |
2008-09 |
2009-10 |
2010-11 |
2008-09 |
2009-10 |
2010-11 |
2008-09 |
2009-10 |
2010-11 |
| |
10 |
11 |
12 |
13 |
14 |
15 |
16 |
17 |
18 |
Prifit Allocation Ratios |
|
|
|
|
|
|
|
|
|
1. Tax Provision to EBT* |
35.7 |
36.2 |
33.2 |
35.9 |
35.8 |
35.7 |
31.6 |
34.1 |
34.0 |
2. Dividends to EBT |
8.7 |
11.0 |
9.2 |
27.2 |
16.7 |
13.7 |
54.0 |
20.8 |
18.4 |
3. Profits Retained to EBT |
55.5 |
49.7 |
56.5 |
35.4 |
47.4 |
50.2 |
-90.1 |
23.4 |
37.5 |
4. Dividends to Net Profits |
13.6 |
18.1 |
14.0 |
43.4 |
26.1 |
21.4 |
-149.7 |
47.1 |
32.9 |
5. Profits Retained to Net Profits |
86.5 |
81.9 |
86.0 |
56.6 |
73.9 |
78.6 |
249.7 |
52.9 |
67.1 |
Profitability Ratios |
|
|
|
|
|
|
|
|
|
6. Operating Profits to Financial Income |
19.6 |
24.4 |
30.4 |
54.4 |
68.8 |
83.2 |
12.6 |
36.6 |
34.1 |
7. Operating Profits to Total Net Assets |
2.8 |
3.1 |
3.9 |
6.2 |
8.7 |
9.4 |
2.6 |
6.5 |
5.7 |
8. Net Profits to Total Net Assets |
1.8 |
1.7 |
2.5 |
3.5 |
5.1 |
5.3 |
-0.7 |
2.4 |
2.8 |
9. Net Profits to Net Worth |
10.7 |
11.4 |
17.6 |
7.7 |
10.9 |
8.5 |
-1.5 |
6.0 |
6.8 |
10. Dividends to Total Paid-up Capital |
10.6 |
16.9 |
23.1 |
18.7 |
12.3 |
6.6 |
4.5 |
5.7 |
5.0 |
11. Dividends to Net Worth |
1.5 |
2.1 |
2.5 |
3.3 |
2.8 |
1.8 |
2.3 |
2.8 |
2.2 |
Capital Structure Ratios |
|
|
|
|
|
|
|
|
|
12. Net Worth to Total Net Assets |
16.8 |
14.6 |
13.9 |
45.7 |
46.6 |
62.0 |
48.0 |
39.1 |
41.0 |
13. Debt to Equity |
254.9 |
322.0 |
263.0 |
41.2 |
13.0 |
3.0 |
12.2 |
10.2 |
10.6 |
14. Total outside Liabilities to Net Worth |
493.8 |
584.4 |
618.9 |
119.0 |
114.8 |
61.3 |
108.5 |
155.8 |
143.9 |
15. Borrowings to Total Assets |
70.8 |
78.2 |
79.4 |
34.8 |
31.7 |
25.3 |
11.6 |
15.5 |
13.5 |
16. Bank Borrowing to Total Borrowing |
30.2 |
30.9 |
48.1 |
43.2 |
78.9 |
82.3 |
21.2 |
23.8 |
41.2 |
Statement 3: Combined Income, Expenditure and Appropriation Accounts of the Select Financial and
Investment Companies – Activity-wise: 2008-09 to 2010-11 |
(` Million) |
Items |
All Activities |
Share Trading and
Investment Holding |
Loan Finance |
(1340) |
(605) |
(455) |
2008-09 |
2009-10 |
2010-11 |
2008-09 |
2009-10 |
2010-11 |
2008-09 |
2009-10 |
2010-11 |
| |
1 |
2 |
3 |
4 |
5 |
6 |
7 |
8 |
9 |
Income |
|
|
|
|
|
|
|
|
|
1. Financial Income |
3,66,250 |
4,14,051 |
5,12,631 |
54,574 |
65,158 |
70,783 |
2,18,066 |
2,37,025 |
3,13,729 |
A. Fund-based Income |
3,09,887 |
3,44,436 |
4,39,035 |
50,845 |
60,973 |
65,248 |
2,08,607 |
2,26,539 |
3,01,743 |
(a) Interest |
2,16,602 |
2,31,643 |
3,15,511 |
19,219 |
17,860 |
22,868 |
1,88,503 |
2,02,211 |
2,75,653 |
(i) On Loans and Advances |
1,54,270 |
1,70,168 |
2,31,195 |
2,823 |
2,939 |
6,397 |
1,48,691 |
1,62,329 |
2,15,074 |
(ii) Others |
62,331 |
61,475 |
84,315 |
16,397 |
14,921 |
16,471 |
39,812 |
39,882 |
60,578 |
(b) Dividends |
15,830 |
19,441 |
19,236 |
10,829 |
13,706 |
13,906 |
3,303 |
4,402 |
3,573 |
(c) Net Profit/ Loss in Share Dealings |
28,241 |
40,938 |
36,077 |
18,310 |
26,353 |
18,982 |
5,930 |
9,953 |
11,708 |
(d) Net Earnings from Hire Purchase Financing |
25,613 |
25,558 |
32,804 |
52 |
5 |
6 |
4,089 |
305 |
215 |
(e) Lease rentals |
8,908 |
8,684 |
17,488 |
126 |
140 |
7,230 |
381 |
377 |
714 |
(f) Other Fund-based Income |
14,693 |
18,172 |
17,920 |
2,309 |
2,910 |
2,256 |
6,400 |
9,290 |
9,879 |
B. Fee-based Income |
56,363 |
69,615 |
73,596 |
3,729 |
4,185 |
5,534 |
9,459 |
10,486 |
11,987 |
(a) Brokerage |
29,637 |
37,131 |
36,966 |
2,295 |
2,784 |
2,593 |
856 |
537 |
493 |
(b) Bill Discounting |
669 |
781 |
878 |
3 |
14 |
5 |
420 |
466 |
702 |
(c) Merchant Banking |
1,506 |
2,025 |
2,321 |
125 |
158 |
82 |
62 |
8 |
8 |
(d) Others fee-based |
24,552 |
29,678 |
33,430 |
1,307 |
1,230 |
2,855 |
8,121 |
9,474 |
10,784 |
2. Non-financial Income |
1,715 |
1,557 |
1,830 |
382 |
391 |
457 |
509 |
542 |
768 |
Of which: Rent |
599 |
625 |
768 |
230 |
245 |
285 |
111 |
141 |
176 |
3. Non-operating Surplus(+)/ Deficit(–) |
3,316 |
2,220 |
-1,145 |
-1,009 |
519 |
1,182 |
2,040 |
2,010 |
-3,381 |
4. Total (1+2+3) |
3,71,281 |
4,17,829 |
5,13,316 |
53,946 |
66,068 |
72,422 |
2,20,615 |
2,39,577 |
3,11,116 |
Expenditure and Appropriations |
|
|
|
|
|
|
|
|
|
5. Interest |
1,46,846 |
1,49,745 |
1,88,546 |
11,511 |
8,249 |
10,546 |
1,14,629 |
1,20,488 |
1,51,746 |
6. Salaries, Wages and Bonus |
37,689 |
43,233 |
47,374 |
3,649 |
4,027 |
4,978 |
12,469 |
13,974 |
16,064 |
7. Provident Fund |
1,908 |
1,695 |
2,163 |
132 |
161 |
158 |
659 |
662 |
836 |
8. Employees Welfare Expenses |
1,797 |
1,837 |
2,425 |
163 |
134 |
164 |
693 |
759 |
906 |
9. Managerial Remuneration |
1,688 |
1,627 |
1,920 |
282 |
427 |
247 |
780 |
622 |
808 |
10. Bad Debts # |
16,727 |
20,212 |
10,457 |
352 |
3,607 |
500 |
11,006 |
11,652 |
6,937 |
11. Other Expenses |
69,141 |
68,468 |
80,096 |
7,283 |
8,823 |
10,232 |
30,841 |
28,149 |
34,099 |
Of which: (a) Rent |
7,415 |
7,443 |
8,702 |
600 |
601 |
667 |
2,414 |
2,590 |
3,438 |
(b) Insurance |
547 |
437 |
477 |
38 |
41 |
33 |
350 |
240 |
294 |
(c) Advertisement |
2,718 |
2,275 |
3,516 |
74 |
140 |
173 |
1,482 |
1,303 |
2,097 |
12. Other Provisions (other than tax and depreciation) |
10,948 |
11,075 |
8,504 |
1,742 |
264 |
778 |
8,623 |
10,334 |
7,067 |
13. Operating Profits |
79,506 |
1,16,157 |
1,71,147 |
29,459 |
39,466 |
43,180 |
38,366 |
50,386 |
95,267 |
14. Depreciation Provision |
8,463 |
7,834 |
7,565 |
523 |
585 |
605 |
3,838 |
2,709 |
2,810 |
15. Earnings before Tax & Non-operating Surplus(+)/ Deficit(–) |
72,758 |
1,09,881 |
1,65,412 |
29,318 |
39,273 |
43,032 |
35,036 |
48,219 |
93,224 |
16. Non-operating Surplus(+)/ Deficit(–) |
3,316 |
2,220 |
-1,145 |
-1,009 |
519 |
1,182 |
2,040 |
2,010 |
-3,381 |
17. Earnings before Tax |
76,074 |
1,12,101 |
1,64,267 |
28,309 |
39,792 |
44,214 |
37,077 |
50,228 |
89,843 |
18. Less: Tax Provision |
29,164 |
39,472 |
50,969 |
6,428 |
8,838 |
10,338 |
15,484 |
19,895 |
28,913 |
19. Net Profits |
46,911 |
72,629 |
1,13,297 |
21,881 |
30,954 |
33,876 |
21,593 |
30,333 |
60,931 |
(a) Dividends |
14,834 |
24,064 |
27,793 |
5,696 |
8,969 |
8,884 |
6,593 |
11,390 |
14,826 |
(i) Ordinary |
14,302 |
23,691 |
27,324 |
5,510 |
8,769 |
8,859 |
6,341 |
11,225 |
14,482 |
(ii) Preference |
532 |
374 |
470 |
186 |
200 |
25 |
252 |
165 |
344 |
(b) Profits Retained |
32,076 |
48,564 |
85,504 |
16,184 |
21,985 |
24,991 |
15,000 |
18,943 |
46,104 |
20. Total (5 to 12 + 14+ 15 + 16) |
3,71,281 |
4,17,829 |
5,13,316 |
53,946 |
66,068 |
72,422 |
2,20,615 |
2,39,577 |
3,11,116 |
# Including provisions for bad debts
– Nil or negligible
Note: Figures in brackets below the activitity name represents the number of companies in the activity. |
Statement 3: Combined Income, Expenditure and Appropriation Accounts of the Select Financial and
Investment Companies – Activity-wise: 2008-09 to 2010-11 (Concld.) |
(` Million) |
Items |
Asset Finance |
Diversified |
Miscellaneous |
(78) |
(15) |
(187) |
2008-09 |
2009-10 |
2010-11 |
2008-09 |
2009-10 |
2010-11 |
2008-09 |
2009-10 |
2010-11 |
| |
10 |
11 |
12 |
13 |
14 |
15 |
16 |
17 |
18 |
Income |
|
|
|
|
|
|
|
|
|
1. Financial Income |
37,098 |
42,648 |
54,930 |
1,124 |
1,387 |
1,761 |
55,388 |
67,832 |
71,428 |
A. Fund-based Income |
35,301 |
41,839 |
54,434 |
597 |
710 |
875 |
14,537 |
14,374 |
16,735 |
(a) Interest |
3,198 |
5,439 |
8,467 |
208 |
246 |
414 |
5,474 |
5,886 |
8,108 |
(i) On Loans and Advances |
1,983 |
4,284 |
7,458 |
193 |
156 |
148 |
580 |
461 |
2,118 |
(ii) Others |
1,214 |
1,155 |
1,009 |
15 |
90 |
267 |
4,893 |
5,426 |
5,990 |
(b) Dividends |
180 |
238 |
620 |
17 |
16 |
11 |
1,500 |
1,079 |
1,126 |
(c) Net Profit/ Loss in Share Dealings |
1,908 |
2,391 |
2,269 |
72 |
163 |
126 |
2,020 |
2,078 |
2,991 |
(d) Net Earnings from Hire Purchase Financing |
21,428 |
25,211 |
32,549 |
14 |
16 |
16 |
31 |
20 |
18 |
(e) Lease rentals |
8,216 |
8,005 |
9,352 |
159 |
135 |
163 |
26 |
27 |
28 |
(f) Other Fund-based Income |
372 |
555 |
1,178 |
126 |
134 |
145 |
5,487 |
5,283 |
4,463 |
B. Fee-based Income |
1,797 |
809 |
495 |
527 |
677 |
886 |
40,851 |
53,458 |
54,693 |
(a) Brokerage |
5 |
1 |
88 |
298 |
445 |
369 |
26,182 |
33,363 |
33,423 |
(b) Bill Discounting |
20 |
18 |
13 |
202 |
178 |
151 |
24 |
105 |
7 |
(c) Merchant Banking |
– |
– |
– |
– |
8 |
– |
1,319 |
1,851 |
2,231 |
(d) Others fee-based |
1,772 |
789 |
394 |
27 |
47 |
366 |
13,326 |
18,139 |
19,032 |
2. Non-financial Income |
540 |
308 |
379 |
62 |
62 |
36 |
223 |
254 |
190 |
Of which: Rent |
138 |
145 |
184 |
3 |
3 |
5 |
118 |
92 |
118 |
3. Non-operating Surplus(+)/ Deficit(–) |
786 |
-219 |
323 |
18 |
-2 |
5 |
1,481 |
-87 |
726 |
4. Total (1+2+3) |
38,424 |
42,737 |
55,632 |
1,204 |
1,447 |
1,801 |
57,092 |
67,999 |
72,345 |
Expenditure and Appropriations |
|
|
|
|
|
|
|
|
|
5. Interest |
17,346 |
17,653 |
22,834 |
224 |
166 |
258 |
3,137 |
3,188 |
3,162 |
6. Salaries, Wages and Bonus |
2,959 |
3,474 |
4,332 |
158 |
173 |
243 |
18,454 |
21,585 |
21,757 |
7. Provident Fund |
167 |
156 |
197 |
1 |
1 |
2 |
948 |
716 |
970 |
8. Employees Welfare Expenses |
122 |
122 |
173 |
2 |
2 |
3 |
817 |
820 |
1,179 |
9. Managerial Remuneration |
186 |
50 |
118 |
37 |
41 |
31 |
403 |
488 |
716 |
10. Bad Debts # |
3,038 |
3,749 |
2,411 |
9 |
7 |
11 |
2,322 |
1,197 |
599 |
11. Other Expenses |
6,270 |
6,984 |
8,137 |
246 |
294 |
296 |
24,500 |
24,218 |
27,331 |
Of which: (a) Rent |
331 |
312 |
339 |
1 |
2 |
6 |
4,069 |
3,938 |
4,252 |
(b) Insurance |
26 |
27 |
26 |
1 |
1 |
1 |
132 |
128 |
123 |
(c) Advertisement |
73 |
74 |
112 |
2 |
3 |
2 |
1,087 |
755 |
1,132 |
12. Other Provisions (other than tax and depreciation) |
172 |
389 |
539 |
29 |
1 |
3 |
383 |
87 |
117 |
13. Operating Profits |
6,838 |
10,071 |
16,189 |
418 |
703 |
914 |
4,425 |
15,532 |
15,597 |
14. Depreciation Provision |
1,262 |
1,339 |
1,205 |
120 |
123 |
146 |
2,720 |
3,078 |
2,798 |
15. Earnings before Tax & Non-operating Surplus(+)/ Deficit(–) |
6,115 |
9,040 |
15,364 |
361 |
642 |
804 |
1,928 |
12,708 |
12,989 |
16. Non-operating Surplus(+)/ Deficit(–) |
786 |
-219 |
323 |
18 |
-2 |
5 |
1,481 |
-87 |
726 |
17. Earnings before Tax |
6,901 |
8,821 |
15,686 |
379 |
639 |
809 |
3,409 |
12,621 |
13,715 |
18. Less: Tax Provision |
2,471 |
3,468 |
5,380 |
142 |
230 |
292 |
4,639 |
7,041 |
6,047 |
19. Net Profits |
4,430 |
5,353 |
10,307 |
237 |
410 |
517 |
-1,230 |
5,579 |
7,668 |
(a) Dividends |
600 |
970 |
1,447 |
103 |
107 |
111 |
1,842 |
2,629 |
2,524 |
(i) Ordinary |
540 |
970 |
1,351 |
103 |
107 |
110 |
1,808 |
2,621 |
2,521 |
(ii) Preference |
60 |
– |
96 |
– |
– |
– |
33 |
9 |
4 |
(b) Profits Retained |
3,830 |
4,383 |
8,859 |
134 |
303 |
406 |
-3,072 |
2,950 |
5,144 |
20. Total (5 to 12 + 14+ 15 + 16) |
38,424 |
42,737 |
55,632 |
1,204 |
1,447 |
1,801 |
57,092 |
67,999 |
72,345 |
Statement 4: Combined Balance Sheet of the Select Financial and Investment Companies –
Activity-wise: 2008-09 to 2010-11 |
(` Million) |
Items |
All Activities |
Share Trading and
Investment Holding |
Loan Finance |
(1340) |
(605) |
(455) |
2008-09 |
2009-10 |
2010-11 |
2008-09 |
2009-10 |
2010-11 |
2008-09 |
2009-10 |
2010-11 |
| |
1 |
2 |
3 |
4 |
5 |
6 |
7 |
8 |
9 |
A. Share capital |
2,88,508 |
3,32,017 |
3,67,310 |
72,616 |
93,676 |
97,626 |
1,68,984 |
1,85,918 |
2,11,367 |
1. Paid-up Capital |
2,88,460 |
3,31,964 |
3,67,257 |
72,595 |
93,651 |
97,601 |
1,68,962 |
1,85,897 |
2,11,345 |
(a) Ordinary |
2,57,183 |
3,01,523 |
3,26,513 |
68,539 |
88,498 |
92,299 |
1,50,631 |
1,71,815 |
1,87,601 |
Of which, Bonus |
14,117 |
16,654 |
17,243 |
3,699 |
3,711 |
3,793 |
8,152 |
10,673 |
11,140 |
(b) Preference |
31,277 |
30,441 |
40,743 |
4,057 |
5,154 |
5,302 |
18,331 |
14,082 |
23,744 |
2. Forfeited Shares |
48 |
52 |
53 |
20 |
25 |
25 |
22 |
21 |
22 |
B. Reserves and Surplus |
5,86,750 |
6,79,981 |
8,54,832 |
2,38,956 |
2,74,842 |
3,11,083 |
2,68,294 |
3,14,060 |
4,24,272 |
3. Capital Reserves |
3,11,522 |
3,58,939 |
4,34,829 |
1,08,307 |
1,22,364 |
1,33,982 |
1,60,177 |
1,88,886 |
2,39,134 |
Of which, Premium on Shares |
2,77,147 |
3,23,071 |
3,96,597 |
81,078 |
94,164 |
1,04,769 |
1,55,511 |
1,83,990 |
2,33,518 |
4. Investment Allowance Reserve |
123 |
123 |
42 |
123 |
123 |
1 |
– |
– |
41 |
5. Sinking Funds |
1,467 |
1,348 |
2,077 |
249 |
189 |
222 |
515 |
928 |
1,661 |
6. Other Reserves |
2,73,639 |
3,19,570 |
4,17,884 |
1,30,276 |
1,52,165 |
1,76,879 |
1,07,602 |
1,24,246 |
1,83,435 |
C. Borrowings |
16,48,798 |
20,28,958 |
27,91,854 |
1,08,989 |
1,26,641 |
1,87,789 |
13,43,446 |
16,11,789 |
22,30,239 |
7. Debentures @ |
5,82,469 |
7,20,608 |
9,81,109 |
21,503 |
26,681 |
56,584 |
4,65,225 |
5,63,969 |
7,93,367 |
8. Loans and Advances |
10,12,350 |
12,35,089 |
17,45,621 |
85,541 |
98,177 |
1,30,912 |
8,39,530 |
9,91,410 |
13,88,588 |
(a) From banks |
6,60,484 |
8,03,041 |
12,62,484 |
50,620 |
48,661 |
67,090 |
5,51,965 |
6,65,939 |
10,17,310 |
Of which, Short-Term Borrowings |
3,34,317 |
3,73,135 |
6,23,080 |
48,545 |
42,832 |
60,509 |
2,31,424 |
2,53,893 |
3,99,212 |
(b) From other Indian Financial Institutions |
89,768 |
83,004 |
88,087 |
1,385 |
7,605 |
13,477 |
84,164 |
71,527 |
70,904 |
(c) From Foreign Institutional Agencies |
9,155 |
1,661 |
12,170 |
– |
– |
– |
9,155 |
1,661 |
12,170 |
(d) From Government and Semi-government Bodies |
6,500 |
14,759 |
10,449 |
– |
713 |
1,259 |
6,500 |
14,046 |
9,190 |
(e) From Companies |
58,893 |
66,359 |
60,059 |
19,218 |
19,512 |
18,987 |
35,177 |
30,050 |
33,169 |
(f) From Others |
1,87,551 |
2,66,265 |
3,12,373 |
14,317 |
21,687 |
30,100 |
1,52,569 |
2,08,188 |
2,45,845 |
9. Deferred Payments |
11 |
11 |
1,034 |
– |
– |
6 |
2 |
1 |
1,027 |
10. Public Deposits |
53,968 |
73,250 |
64,089 |
1,946 |
1,783 |
286 |
38,689 |
56,409 |
47,257 |
(Of total borrowings, debt) |
10,68,543 |
13,23,262 |
17,98,321 |
27,119 |
42,610 |
78,193 |
9,24,573 |
11,19,718 |
15,53,991 |
D. Trade Dues and Other Current Liabiliabilities |
2,48,677 |
2,95,364 |
3,19,258 |
76,163 |
73,660 |
54,323 |
78,843 |
97,405 |
1,19,171 |
11. Sundry Creditors |
1,03,735 |
1,16,625 |
1,22,552 |
37,672 |
21,375 |
13,681 |
15,245 |
18,938 |
31,592 |
12. Acceptances |
1 |
– |
– |
– |
– |
– |
1 |
– |
– |
13. Liabilities to Susidiaries & Holding Companies |
217 |
445 |
1,757 |
29 |
215 |
1,468 |
88 |
143 |
140 |
14. Advances/ Deposits from Customers, Agents, etc. |
39,358 |
57,588 |
26,445 |
12,866 |
35,894 |
5,464 |
14,078 |
12,940 |
12,700 |
15. Interest Accrued on Loans |
32,367 |
40,486 |
48,730 |
2,617 |
4,036 |
3,909 |
24,102 |
30,430 |
39,425 |
16. Others |
72,998 |
80,220 |
1,19,775 |
22,980 |
12,140 |
29,802 |
25,329 |
34,953 |
35,314 |
E. Provisions |
1,15,788 |
59,621 |
74,672 |
9,820 |
12,066 |
14,834 |
1,11,970 |
41,581 |
52,865 |
17. Taxation (Net of Advance of Income-Tax) |
65,806 |
– |
– |
– |
– |
– |
76,769 |
– |
– |
18. Dividends |
9,974 |
17,204 |
21,000 |
3,184 |
5,927 |
7,206 |
5,446 |
8,995 |
11,259 |
19. Other Current Provisions |
34,309 |
31,401 |
36,918 |
5,019 |
4,109 |
4,216 |
26,608 |
24,738 |
29,922 |
20. Non-current Provisions |
5,699 |
11,017 |
16,755 |
1,617 |
2,029 |
3,413 |
3,147 |
7,849 |
11,684 |
F. 21. Miscellaneous non-current liabilities |
– |
– |
– |
– |
– |
– |
– |
– |
– |
22. Total |
28,88,521 |
33,95,940 |
44,07,926 |
5,06,544 |
5,80,885 |
6,65,655 |
19,71,537 |
22,50,753 |
30,37,914 |
@ Includes privately placed debentures
– Nil or negligible
Note: Figures in brackets below the activitity name represents the number of companies in the activity. |
Statement 4: Combined Balance Sheet of the Select Financial and Investment Companies –
Activity-wise: 2008-09 to 2010-11 (Contd.) |
(` Million) |
Items |
All Activities |
Share Trading and
Investment Holding |
Loan Finance |
(1340) |
(605) |
(455) |
2008-09 |
2009-10 |
2010-11 |
2008-09 |
2009-10 |
2010-11 |
2008-09 |
2009-10 |
2010-11 |
| |
1 |
2 |
3 |
4 |
5 |
6 |
7 |
8 |
9 |
G. Cash and bank balances |
3,01,643 |
3,18,769 |
3,39,473 |
48,864 |
70,576 |
56,240 |
1,64,646 |
1,19,245 |
1,42,409 |
23. Deposits with banks |
2,96,306 |
3,13,290 |
3,32,142 |
47,151 |
70,261 |
55,835 |
1,61,946 |
1,14,863 |
1,36,377 |
24. Cash in hand |
5,337 |
5,479 |
7,331 |
1,713 |
315 |
405 |
2,700 |
4,382 |
6,032 |
H. Investments |
6,39,768 |
6,51,548 |
8,18,480 |
2,89,880 |
3,09,810 |
3,86,470 |
3,00,444 |
2,80,245 |
3,61,946 |
Of which, quoted investments |
99,035 |
1,88,254 |
1,57,267 |
68,725 |
1,67,517 |
1,38,749 |
21,175 |
11,314 |
15,505 |
25. Foreign Securities |
330 |
22 |
118 |
4 |
6 |
4 |
– |
– |
– |
26. Indian Securities |
6,39,439 |
6,51,526 |
8,18,361 |
2,89,877 |
3,09,805 |
3,86,467 |
3,00,444 |
2,80,245 |
3,61,946 |
(a) Government/ semi-Government securities |
37,595 |
33,724 |
23,582 |
18,222 |
14,810 |
8,073 |
17,668 |
16,969 |
13,645 |
(b) Public sector undertakings |
3,161 |
4,379 |
7,604 |
536 |
3,630 |
5,682 |
2,598 |
483 |
1,865 |
(c) Securities of Financial Institutions |
2,436 |
5,811 |
18,080 |
1,601 |
4,455 |
6,376 |
641 |
1,192 |
11,541 |
(d) Mutual funds |
1,08,498 |
1,12,498 |
1,13,111 |
32,733 |
42,927 |
30,793 |
62,615 |
52,960 |
70,712 |
(e) Shares and debentures of subsidiaries/ holding |
1,38,088 |
1,80,070 |
2,04,452 |
33,283 |
48,221 |
72,032 |
86,609 |
1,08,998 |
1,02,008 |
(f) Shares and debentures of other Indian companies |
3,23,307 |
2,73,797 |
3,79,628 |
1,83,249 |
1,74,816 |
2,35,316 |
1,26,615 |
82,500 |
1,25,269 |
(g) Others |
26,353 |
41,248 |
71,904 |
20,252 |
20,944 |
28,196 |
3,698 |
17,142 |
36,906 |
I. Receivables |
18,42,518 |
22,65,387 |
30,60,075 |
1,35,246 |
1,53,576 |
1,70,339 |
14,53,220 |
17,74,654 |
24,38,951 |
27. Loans and advances |
17,48,439 |
21,40,190 |
29,07,665 |
1,11,551 |
1,28,037 |
1,46,077 |
14,17,226 |
17,29,200 |
23,80,073 |
(a) Subsidiary companies |
14,870 |
26,073 |
53,193 |
3,721 |
3,322 |
3,287 |
8,778 |
20,003 |
46,505 |
(b) Holding companies and companies in the same group |
1,690 |
2,423 |
1,760 |
667 |
1,412 |
659 |
916 |
792 |
618 |
(c) Against hire purchase |
68,477 |
28,899 |
87,211 |
604 |
1,212 |
1,756 |
4,607 |
5,258 |
5,007 |
(d) Others |
16,63,402 |
20,82,796 |
27,65,502 |
1,06,559 |
1,22,090 |
1,40,376 |
14,02,925 |
17,03,147 |
23,27,942 |
28. Book debts |
94,078 |
1,25,197 |
1,52,410 |
23,695 |
25,539 |
24,262 |
35,994 |
45,454 |
58,878 |
(a) Sundry debtors |
39,250 |
61,968 |
83,017 |
12,826 |
10,529 |
13,353 |
9,648 |
12,506 |
13,444 |
(b) Dividend/ Interest accrued |
19,286 |
22,112 |
29,751 |
3,028 |
4,598 |
3,044 |
14,709 |
15,795 |
24,266 |
(c) Deposits balances with Govt/ others |
15,977 |
24,675 |
21,365 |
5,858 |
6,068 |
4,962 |
4,203 |
10,462 |
8,235 |
(d) Others |
19,565 |
16,442 |
18,277 |
1,983 |
4,345 |
2,903 |
7,435 |
6,691 |
12,933 |
J. Inventories |
48,803 |
71,122 |
80,065 |
15,889 |
30,666 |
27,283 |
29,645 |
30,972 |
41,182 |
29. Government and semi government securities |
434 |
8,006 |
10,491 |
136 |
882 |
181 |
57 |
6,698 |
10,206 |
30. Industrial securities |
46,262 |
59,742 |
65,882 |
15,535 |
28,636 |
25,483 |
28,636 |
23,288 |
29,958 |
31. Repossessed goods on hire purchase |
444 |
291 |
264 |
106 |
– |
– |
30 |
33 |
35 |
32. Other goods, stores and others |
1,663 |
3,083 |
3,428 |
112 |
1,148 |
1,620 |
922 |
953 |
983 |
K. 33. Advance of income-tax (net of tax provision) |
0 |
29,179 |
35,768 |
6,840 |
4,848 |
7,572 |
0 |
19,315 |
21,086 |
L. 34. Gross fixed assets |
75,714 |
83,295 |
95,398 |
13,597 |
14,795 |
17,672 |
25,839 |
30,222 |
36,745 |
of which: (a) Plant and machinery leased |
8,614 |
8,770 |
5,033 |
3,263 |
3,694 |
3,183 |
637 |
677 |
482 |
(b) Equipments leased |
374 |
322 |
612 |
158 |
158 |
157 |
130 |
110 |
98 |
(c) Vehicles leased |
4,183 |
3,133 |
2,536 |
575 |
545 |
552 |
90 |
77 |
41 |
(d) Other assets leased |
641 |
836 |
497 |
51 |
78 |
91 |
63 |
266 |
264 |
M. 35. Less: Depreciation Provision |
28,641 |
31,949 |
32,886 |
6,630 |
6,596 |
6,305 |
5,831 |
7,517 |
8,295 |
N. 36. Net fixed assets |
47,073 |
51,346 |
62,512 |
6,967 |
8,199 |
11,368 |
20,007 |
22,704 |
28,450 |
Of which: assets leased |
5,089 |
3,390 |
2,304 |
3,131 |
1,960 |
1,551 |
290 |
272 |
259 |
O. 37 Other assets |
8,717 |
8,589 |
11,553 |
2,857 |
3,210 |
6,382 |
3,574 |
3,618 |
3,890 |
38. Total |
28,88,521 |
33,95,940 |
44,07,926 |
5,06,544 |
5,80,885 |
6,65,655 |
19,71,537 |
22,50,753 |
30,37,914 |
Note: Figures in brackets below the activitity name represents the number of companies in the activity. |
Statement 4: Combined Balance Sheet of the Select Financial and Investment Companies –
Activity-wise: 2008-09 to 2010-11 (Contd.) |
(` Million) |
Items |
Asset Finance |
Diversified |
Miscellaneous |
(78) |
(15) |
(187) |
2008-09 |
2009-10 |
2010-11 |
2008-09 |
2009-10 |
2010-11 |
2008-09 |
2009-10 |
2010-11 |
| |
10 |
11 |
12 |
13 |
14 |
15 |
16 |
17 |
18 |
A. Share capital |
5,646 |
5,752 |
6,275 |
551 |
870 |
1,686 |
40,712 |
45,800 |
50,356 |
1. Paid-up Capital |
5,645 |
5,751 |
6,274 |
551 |
870 |
1,686 |
40,706 |
45,795 |
50,350 |
(a) Ordinary |
3,732 |
3,838 |
4,035 |
548 |
595 |
1,677 |
33,733 |
36,778 |
40,902 |
Of which, Bonus |
665 |
665 |
665 |
– |
– |
– |
1,602 |
1,606 |
1,645 |
(b) Preference |
1,913 |
1,914 |
2,239 |
3 |
275 |
9 |
6,973 |
9,017 |
9,448 |
2. Forfeited Shares |
1 |
1 |
1 |
– |
– |
– |
6 |
6 |
6 |
B. Reserves and Surplus |
35,793 |
41,132 |
52,539 |
2,537 |
2,886 |
4,374 |
41,172 |
47,062 |
62,565 |
3. Capital Reserves |
14,871 |
15,827 |
18,419 |
850 |
896 |
1,978 |
27,318 |
30,967 |
41,316 |
Of which, Premium on Shares |
14,011 |
14,966 |
17,252 |
850 |
896 |
1,978 |
25,697 |
29,056 |
39,081 |
4. Investment Allowance Reserve |
– |
– |
– |
– |
– |
– |
– |
– |
– |
5. Sinking Funds |
512 |
34 |
4 |
– |
– |
– |
190 |
198 |
190 |
6. Other Reserves |
20,410 |
25,272 |
34,116 |
1,687 |
1,990 |
2,396 |
13,664 |
15,897 |
21,059 |
C. Borrowings |
1,74,279 |
2,51,060 |
3,34,290 |
2,354 |
2,555 |
2,474 |
19,729 |
36,914 |
37,062 |
7. Debentures @ |
90,731 |
1,25,824 |
1,27,261 |
1,154 |
354 |
4 |
3,855 |
3,781 |
3,894 |
8. Loans and Advances |
71,962 |
1,11,578 |
1,92,518 |
1,082 |
2,071 |
2,293 |
14,236 |
31,852 |
31,310 |
(a) From banks |
52,706 |
77,654 |
1,60,783 |
1,016 |
2,015 |
2,037 |
4,176 |
8,772 |
15,265 |
Of which, Short-Term Borrowings |
50,056 |
66,722 |
1,48,880 |
1,016 |
2,015 |
2,037 |
3,277 |
7,673 |
12,441 |
(b) From other Indian Financial Institutions |
646 |
552 |
296 |
– |
5 |
– |
3,572 |
3,316 |
3,410 |
(c) From Foreign Institutional Agencies |
– |
– |
– |
– |
– |
– |
– |
– |
– |
(d) From Government and Semi-government Bodies |
– |
– |
– |
– |
– |
– |
– |
– |
– |
(e) From Companies |
863 |
876 |
1,646 |
39 |
23 |
205 |
3,596 |
15,898 |
6,052 |
(f) From Others |
17,747 |
32,496 |
29,793 |
27 |
28 |
51 |
2,891 |
3,866 |
6,584 |
9. Deferred Payments |
– |
– |
– |
1 |
1 |
– |
8 |
10 |
– |
10. Public Deposits |
11,586 |
13,657 |
14,511 |
116 |
130 |
176 |
1,631 |
1,271 |
1,858 |
(Of total borrowings, debt) |
1,05,614 |
1,50,967 |
1,53,971 |
1,272 |
489 |
180 |
9,965 |
9,477 |
11,986 |
D. Trade Dues and Other Current Liabiliabilities |
27,307 |
18,857 |
23,411 |
1,130 |
1,546 |
1,029 |
65,234 |
1,03,895 |
1,21,324 |
11. Sundry Creditors |
7,047 |
8,515 |
10,125 |
797 |
1,021 |
684 |
42,975 |
66,775 |
66,469 |
12. Acceptances |
– |
– |
– |
– |
– |
– |
– |
– |
– |
13. Liabilities to Susidiaries & Holding Companies |
– |
– |
– |
– |
– |
– |
100 |
87 |
149 |
14. Advances/ Deposits from Customers, Agents, etc. |
6,193 |
2,833 |
3,097 |
98 |
105 |
106 |
6,122 |
5,816 |
5,078 |
15. Interest Accrued on Loans |
5,433 |
5,551 |
5,185 |
9 |
4 |
2 |
207 |
465 |
209 |
16. Others |
8,634 |
1,958 |
5,004 |
226 |
417 |
237 |
15,830 |
30,752 |
49,419 |
E. Provisions |
1,549 |
2,235 |
2,989 |
145 |
164 |
154 |
3,277 |
3,604 |
3,830 |
17. Taxation (Net of Advance of Income-Tax) |
– |
– |
– |
11 |
28 |
– |
– |
– |
– |
18. Dividends |
409 |
669 |
1,086 |
103 |
107 |
111 |
832 |
1,505 |
1,339 |
19. Other Current Provisions |
937 |
1,289 |
1,405 |
29 |
26 |
34 |
1,716 |
1,239 |
1,339 |
20. Non-current Provisions |
204 |
277 |
498 |
2 |
3 |
9 |
729 |
859 |
1,152 |
F. 21. Miscellaneous non-current liabilities |
– |
– |
– |
– |
– |
– |
– |
– |
– |
22. Total |
2,44,574 |
3,19,036 |
4,19,504 |
6,717 |
8,021 |
9,716 |
1,70,124 |
2,37,274 |
2,75,137 |
Statement 4: Combined Balance Sheet of the Select Financial and Investment Companies –
Activity-wise: 2008-09 to 2010-11 (Concld.) |
(` Million) |
Items |
Asset Finance |
Diversified |
Miscellaneous |
(78) |
(15) |
(187) |
2008-09 |
2009-10 |
2010-11 |
2008-09 |
2009-10 |
2010-11 |
2008-09 |
2009-10 |
2010-11 |
| |
10 |
11 |
12 |
13 |
14 |
15 |
16 |
17 |
18 |
G. Cash and bank balances |
14,892 |
27,397 |
27,504 |
1,834 |
1,961 |
1,809 |
71,407 |
99,590 |
1,11,511 |
23. Deposits with banks |
14,187 |
26,798 |
26,753 |
1,767 |
1,918 |
1,799 |
71,255 |
99,450 |
1,11,378 |
24. Cash in hand |
705 |
599 |
752 |
67 |
43 |
9 |
152 |
140 |
133 |
H. Investments |
10,455 |
11,441 |
19,088 |
429 |
467 |
741 |
38,560 |
49,585 |
50,234 |
Of which, quoted investments |
2,341 |
118 |
115 |
17 |
– |
– |
6,777 |
9,304 |
2,899 |
25. Foreign Securities |
– |
– |
– |
– |
– |
– |
326 |
16 |
114 |
26. Indian Securities |
10,455 |
11,441 |
19,088 |
429 |
467 |
741 |
38,234 |
49,569 |
50,120 |
(a) Government/ semi-Government securities |
1,628 |
1,790 |
1,802 |
25 |
26 |
30 |
52 |
129 |
31 |
(b) Public sector undertakings |
5 |
6 |
33 |
1 |
– |
– |
21 |
261 |
24 |
(c) Securities of Financial Institutions |
11 |
2 |
– |
– |
– |
– |
182 |
161 |
163 |
(d) Mutual funds |
2,408 |
1,246 |
3,092 |
53 |
53 |
60 |
10,688 |
15,311 |
8,454 |
(e) Shares and debentures of subsidiaries/ holding |
1,299 |
1,319 |
4,798 |
123 |
124 |
173 |
16,773 |
21,407 |
25,441 |
(f) Shares and debentures of other Indian companies |
3,398 |
4,137 |
5,013 |
226 |
263 |
477 |
9,820 |
12,081 |
13,553 |
(g) Others |
1,706 |
2,941 |
4,349 |
1 |
– |
– |
697 |
219 |
2,453 |
I. Receivables |
2,10,113 |
2,70,425 |
3,61,631 |
3,268 |
4,230 |
5,976 |
40,670 |
62,502 |
83,179 |
27. Loans and advances |
2,03,683 |
2,65,291 |
3,58,674 |
2,210 |
3,014 |
4,579 |
13,769 |
14,648 |
18,263 |
(a) Subsidiary companies |
365 |
549 |
195 |
– |
– |
– |
2,006 |
2,199 |
3,206 |
(b) Holding companies and companies in the same group |
– |
– |
– |
– |
1 |
34 |
106 |
218 |
449 |
(c) Against hire purchase |
62,791 |
21,999 |
80,374 |
49 |
69 |
40 |
426 |
360 |
35 |
(d) Others |
1,40,527 |
2,42,744 |
2,78,106 |
2,161 |
2,944 |
4,505 |
11,231 |
11,870 |
14,573 |
28. Book debts |
6,430 |
5,134 |
2,957 |
1,059 |
1,216 |
1,397 |
26,900 |
47,854 |
64,916 |
(a) Sundry debtors |
861 |
563 |
666 |
859 |
1,017 |
1,177 |
15,056 |
37,354 |
54,377 |
(b) Dividend/ Interest accrued |
271 |
255 |
253 |
35 |
43 |
70 |
1,243 |
1,421 |
2,117 |
(c) Deposits balances with Govt/ others |
168 |
174 |
132 |
159 |
150 |
139 |
5,589 |
7,821 |
7,897 |
(d) Others |
5,131 |
4,142 |
1,906 |
5 |
6 |
11 |
5,011 |
1,258 |
525 |
J. Inventories |
743 |
1,595 |
1,346 |
370 |
429 |
185 |
2,155 |
7,460 |
10,069 |
29. Government and semi government securities |
– |
– |
– |
– |
– |
– |
241 |
426 |
105 |
30. Industrial securities |
277 |
1,161 |
894 |
290 |
358 |
112 |
1,523 |
6,299 |
9,435 |
31. Repossessed goods on hire purchase |
271 |
217 |
176 |
38 |
41 |
52 |
– |
– |
– |
32. Other goods, stores and others |
196 |
217 |
275 |
42 |
29 |
21 |
391 |
736 |
529 |
K. 33. Advance of income-tax (net of tax provision) |
681 |
421 |
1,234 |
– |
– |
– |
3,453 |
4,624 |
5,877 |
L. 34. Gross fixed assets |
15,046 |
15,038 |
15,059 |
2,383 |
2,537 |
2,550 |
18,850 |
20,702 |
23,372 |
of which: (a) Plant and machinery leased |
2,228 |
1,906 |
454 |
1,548 |
1,579 |
– |
939 |
914 |
914 |
(b) Equipments leased |
12 |
1 |
– |
75 |
54 |
– |
– |
– |
357 |
(c) Vehicles leased |
3,125 |
2,134 |
1,885 |
236 |
222 |
2 |
157 |
154 |
57 |
(d) Other assets leased |
141 |
102 |
79 |
10 |
14 |
5 |
376 |
376 |
59 |
M. 35. Less: Depreciation Provision |
7,558 |
7,484 |
6,590 |
1,572 |
1,619 |
1,556 |
7,051 |
8,733 |
10,140 |
N. 36. Net fixed assets |
7,488 |
7,554 |
8,469 |
811 |
919 |
994 |
11,799 |
11,970 |
13,232 |
Of which: assets leased |
1,105 |
613 |
438 |
513 |
499 |
– |
50 |
46 |
56 |
O. 37 Other assets |
201 |
203 |
232 |
5 |
16 |
12 |
2,079 |
1,542 |
1,036 |
38. Total (I+J+K+L+M+N+O) |
2,44,574 |
3,19,036 |
4,19,504 |
6,717 |
8,021 |
9,716 |
1,70,124 |
2,37,274 |
2,75,137 |
Statement 5: Sources and Uses of Funds of the select Financial and Investmemnts Companies –
Activity-wise: 2009-10 and 2010-11 |
(` Million) |
Item |
All Activities |
Share Trading and
Investment Holding |
Loan Finance |
(1340) |
(605) |
(455) |
2009-10 |
2010-11 |
2009-10 |
2010-11 |
2009-10 |
2010-11 |
| |
1 |
2 |
3 |
4 |
5 |
6 |
Internal Sources |
-34,482 |
1,06,016 |
26,160 |
24,064 |
-69,427 |
67,820 |
A. 1. Paid-up Capital |
2,537 |
589 |
13 |
82 |
2,521 |
468 |
B. Reserves and Surplus |
45,033 |
95,689 |
21,945 |
23,873 |
16,070 |
57,066 |
2. Capital Reserves |
-779 |
-3,273 |
116 |
-751 |
-987 |
-2,898 |
3. Investment Allowance Reserve |
– |
-81 |
– |
-123 |
– |
41 |
4. Sinking Funds |
-118 |
729 |
-60 |
33 |
413 |
734 |
5. Other Reserves |
45,931 |
98,314 |
21,889 |
24,714 |
16,644 |
59,189 |
C. Provisions |
-82,053 |
9,739 |
4,202 |
109 |
-88,018 |
10,286 |
6. Depreciation |
3,293 |
1,277 |
-35 |
64 |
1,685 |
774 |
7. Taxation (net of advance of Income-tax) |
-94,985 |
-6,589 |
1,992 |
-2,724 |
-96,084 |
-1,771 |
8. Dividends |
7,230 |
3,796 |
2,743 |
1,278 |
3,549 |
2,264 |
9. Other current provisions |
-2,908 |
5,517 |
-910 |
107 |
-1,870 |
5,185 |
10. Non-current provisions |
5,318 |
5,738 |
413 |
1,383 |
4,701 |
3,835 |
External Sources |
5,16,030 |
9,00,052 |
50,139 |
57,690 |
3,31,014 |
7,18,347 |
D. Paid-up Capital |
87,921 |
1,12,470 |
34,157 |
15,594 |
43,890 |
77,627 |
11. Net issues |
40,972 |
34,705 |
21,048 |
3,868 |
14,414 |
24,981 |
12. Premium on Shares |
46,949 |
77,765 |
13,109 |
11,726 |
29,477 |
52,645 |
E. 13. Capital receipts |
1,263 |
792 |
832 |
287 |
220 |
504 |
F. Borrowings |
3,80,160 |
7,62,895 |
17,652 |
61,147 |
2,68,342 |
6,18,450 |
14. Debentures @ |
1,38,140 |
2,60,501 |
5,179 |
29,903 |
98,743 |
2,29,398 |
15. Loans and Advances |
2,22,738 |
5,10,533 |
12,637 |
32,735 |
1,51,881 |
3,97,178 |
(a) From Banks |
1,42,557 |
4,59,443 |
-1,959 |
18,429 |
1,13,974 |
3,51,371 |
(b) From Other Indian Financial Institutions |
-6,763 |
5,083 |
6,219 |
5,872 |
-12,637 |
-622 |
(c) From foreign Institutional Agencies |
-7,494 |
10,509 |
– |
– |
-7,494 |
10,509 |
(d) From Government and Semi-government Bodies |
8,259 |
-4,310 |
713 |
546 |
7,546 |
-4,856 |
(e) From Companies |
7,466 |
-6,300 |
295 |
-526 |
-5,127 |
3,119 |
(f) From Others |
78,714 |
46,108 |
7,370 |
8,413 |
55,619 |
37,658 |
16. Deferred Payments |
– |
1,022 |
– |
6 |
-1 |
1,026 |
17. Public Deposits |
19,282 |
-9,161 |
-163 |
-1,497 |
17,720 |
-9,152 |
G. Trade dues and other current Liabiliabilities |
46,686 |
23,894 |
-2,503 |
-19,338 |
18,562 |
21,766 |
18. Sundry Creditors |
12,889 |
5,927 |
-16,296 |
-7,695 |
3,693 |
12,654 |
19. Acceptances |
-1 |
– |
– |
– |
-1 |
– |
20. Liabilities to Companies |
227 |
1,312 |
186 |
1,254 |
55 |
-3 |
21. Advances/ Deposits from Customers, agents, etc. |
18,231 |
-31,143 |
23,029 |
-30,431 |
-1,138 |
-241 |
22. Interest accrued on Loans |
8,118 |
8,244 |
1,419 |
-128 |
6,329 |
8,995 |
23. Others |
7,222 |
39,555 |
-10,840 |
17,662 |
9,624 |
361 |
H. 24. Miscellaneous Non-current Liabilities |
– |
– |
– |
– |
– |
– |
25. Total |
4,81,547 |
10,06,068 |
76,299 |
81,755 |
2,61,587 |
7,86,167 |
@ Includes privately placed debentures
-Nil or negligible
Note: (i) Figures in brackets below the activitity name represents the number of companies in the activity.
(ii) This statement is derived from Statement 4. The figure have been adjusted for revaluation, etc., whereever necessary.
(iii) Item A(1) represents capitalised reserves and forfeited shares. |
Statement 5: Sources and Uses of Funds of the select Financial and Investmemnts Companies –
Activity-wise: 2009-10 and 2010-11 (Contd.) |
(` Million) |
Item |
All Activities |
Share Trading and
Investment Holding |
Loan Finance |
(1340) |
(605) |
(455) |
2009-10 |
2010-11 |
2009-10 |
2010-11 |
2009-10 |
2010-11 |
| |
1 |
2 |
3 |
4 |
5 |
6 |
I. Cash and Bank Balances |
17,126 |
20,704 |
21,712 |
-14,336 |
-45,401 |
23,164 |
26. Deposits with Banks |
16,984 |
18,852 |
23,110 |
-14,426 |
-47,083 |
21,514 |
27. Cash in Hand |
142 |
1,852 |
-1,398 |
91 |
1,682 |
1,650 |
J. Investments |
11,780 |
1,66,931 |
19,930 |
76,660 |
-20,200 |
81,702 |
Of which, Quoted Investments |
89,219 |
-30,987 |
98,792 |
-28,769 |
-9,861 |
4,190 |
28. Foreign Securities |
-308 |
96 |
2 |
-2 |
– |
– |
29. Indian Securities |
12,088 |
1,66,835 |
19,928 |
76,662 |
-20,200 |
81,702 |
(a) Government/ Semi-Government Securities |
-3,871 |
-10,143 |
-3,412 |
-6,738 |
-698 |
-3,324 |
(b) Public Sector Undertakings |
1,218 |
3,224 |
3,095 |
2,052 |
-2,115 |
1,382 |
(c) Securities of Financial Institutions |
3,375 |
12,270 |
2,854 |
1,921 |
550 |
10,349 |
(d) Mutual Funds |
3,999 |
613 |
10,194 |
-12,134 |
-9,655 |
17,752 |
(e) Shares and Debentures of subsidiaries/ Holding |
41,981 |
24,383 |
14,938 |
23,811 |
22,389 |
-6,990 |
(f) Shares and Debentures of Other Indian Companies |
-49,510 |
1,05,831 |
-8,432 |
60,500 |
-44,115 |
42,769 |
(g) Others |
14,895 |
30,656 |
693 |
7,251 |
13,445 |
19,764 |
K. Receivables |
4,22,869 |
7,94,688 |
18,330 |
16,763 |
3,21,434 |
6,64,296 |
30. Loans and Advances |
3,91,751 |
7,67,475 |
16,486 |
18,040 |
3,11,974 |
6,50,872 |
(a) Subsidiary Companies |
11,203 |
27,120 |
-399 |
-35 |
11,225 |
26,503 |
(b) Holding Companies and Companies in the Same Group |
733 |
-663 |
745 |
-754 |
-124 |
-174 |
(c) Against Hire Purchase |
-39,578 |
58,312 |
608 |
543 |
651 |
-251 |
(d) Bills Discounted |
5,350 |
3,655 |
27 |
1,000 |
5,348 |
1,796 |
(e) Others |
4,14,043 |
6,79,051 |
15,505 |
17,285 |
2,94,875 |
6,22,999 |
31. Book Debts |
31,119 |
27,213 |
1,844 |
-1,277 |
9,460 |
13,424 |
(a) Sundry Debtors |
22,719 |
21,049 |
-2,297 |
2,825 |
2,858 |
939 |
(b) Dividend/ Interest Accrued |
2,826 |
7,639 |
1,571 |
-1,554 |
1,087 |
8,471 |
(c) Others |
5,574 |
-1,475 |
2,571 |
-2,548 |
5,516 |
4,014 |
L. Inventories |
22,319 |
8,944 |
14,776 |
-3,383 |
1,327 |
10,210 |
32. Government and Semi Government Securities |
7,572 |
2,485 |
745 |
-701 |
6,642 |
3,507 |
33. Industrial Securities |
13,480 |
6,140 |
13,101 |
-3,154 |
-5,349 |
6,670 |
34. Repossessed Goods on Hire Purchase |
-153 |
-27 |
-106 |
– |
3 |
3 |
35. Other Goods, Stores and Others |
1,420 |
345 |
1,036 |
472 |
31 |
30 |
M. 36. Gross Fixed Assets |
7,580 |
11,837 |
1,197 |
2,877 |
4,383 |
6,523 |
of which (a) Plant and Machinery Leased |
156 |
-3,737 |
431 |
-511 |
40 |
-196 |
(b) Equipments Leased |
-52 |
290 |
– |
– |
-20 |
-12 |
(c) Vehicles Leased |
-1,051 |
-596 |
-30 |
6 |
-13 |
-37 |
(d) Other Assets Leased |
195 |
-339 |
27 |
13 |
203 |
-2 |
N. 37. Other Assets |
-128 |
2,963 |
353 |
3,172 |
44 |
272 |
38. Total |
4,81,547 |
10,06,068 |
76,299 |
81,755 |
2,61,587 |
7,86,167 |
Note: Figures in brackets below the activitity name represents the number of companies in the activity.
– Nil or negligible |
Statement 5: Sources and Uses of Funds of the select Financial and Investmemnts Companies –
Activity-wise: 2009-10 and 2010-11 (Contd.) |
(` Million) |
Item |
Asset Finance |
Diversified |
Miscellaneous |
(78) |
(15) |
(187) |
2009-10 |
2010-11 |
2009-10 |
2010-11 |
2009-10 |
2010-11 |
| |
7 |
8 |
9 |
10 |
11 |
12 |
Internal Sources |
5,257 |
7,902 |
369 |
333 |
3,160 |
5,897 |
A. 1. Paid-up Capital |
– |
– |
– |
– |
4 |
39 |
B. Reserves and Surplus |
4,385 |
8,855 |
303 |
406 |
2,330 |
5,489 |
2. Capital Reserves |
1 |
40 |
– |
– |
89 |
335 |
3. Investment Allowance Reserve |
– |
– |
– |
– |
– |
– |
4. Sinking Funds |
-479 |
-30 |
– |
– |
8 |
-8 |
5. Other Reserves |
4,862 |
8,844 |
303 |
406 |
2,234 |
5,161 |
C. Provisions |
872 |
-953 |
66 |
-73 |
825 |
369 |
6. Depreciation |
-74 |
-894 |
47 |
-63 |
1,669 |
1,396 |
7. Taxation (net of advance of Income-tax) |
260 |
-813 |
18 |
-28 |
-1,171 |
-1,252 |
8. Dividends |
260 |
417 |
4 |
4 |
673 |
-166 |
9. Other current provisions |
352 |
117 |
-3 |
8 |
-476 |
100 |
10. Non-current provisions |
73 |
221 |
– |
6 |
130 |
292 |
External Sources |
69,391 |
90,593 |
982 |
1,300 |
64,502 |
32,121 |
D. Paid-up Capital |
1,061 |
2,809 |
365 |
1,898 |
8,447 |
14,542 |
11. Net issues |
106 |
523 |
319 |
816 |
5,085 |
4,517 |
12. Premium on Shares |
955 |
2,286 |
47 |
1,082 |
3,362 |
10,025 |
E. 13. Capital receipts |
– |
– |
– |
– |
210 |
1 |
F. Borrowings |
76,781 |
83,230 |
201 |
-81 |
17,185 |
148 |
14. Debentures @ |
35,093 |
1,437 |
-801 |
-350 |
-74 |
113 |
15. Loans and Advances |
39,616 |
80,939 |
989 |
223 |
17,616 |
-542 |
(a) From Banks |
24,948 |
83,129 |
999 |
21 |
4,595 |
6,493 |
(b) From Other Indian Financial Institutions |
-94 |
-256 |
5 |
-5 |
-256 |
94 |
(c) From foreign Institutional Agencies |
– |
– |
– |
– |
– |
– |
(d) From Government and Semi-government Bodies |
– |
– |
– |
– |
– |
– |
(e) From Companies |
13 |
770 |
-16 |
183 |
12,302 |
-9,846 |
(f) From Others |
14,749 |
-2,704 |
1 |
23 |
975 |
2,717 |
16. Deferred Payments |
– |
– |
– |
– |
2 |
-10 |
17. Public Deposits |
2,071 |
854 |
13 |
47 |
-359 |
587 |
G. Trade dues and other current Liabiliabilities |
-8,450 |
4,554 |
416 |
-517 |
38,661 |
17,430 |
18. Sundry Creditors |
1,468 |
1,610 |
224 |
-337 |
23,800 |
-305 |
19. Acceptances |
– |
– |
– |
– |
– |
– |
20. Liabilities to Companies |
– |
– |
– |
– |
-13 |
61 |
21. Advances/ Deposits from Customers, agents, etc. |
-3,360 |
264 |
7 |
1 |
-307 |
-737 |
22. Interest accrued on Loans |
117 |
-366 |
-5 |
-2 |
258 |
-256 |
23. Others |
-6,675 |
3,045 |
191 |
-180 |
14,922 |
18,666 |
H. 24. Miscellaneous Non-current Liabilities |
– |
– |
– |
– |
– |
– |
25. Total |
74,648 |
98,495 |
1,351 |
1,633 |
67,662 |
38,018 |
Statement 5: Sources and Uses of Funds of the select Financial and Investmemnts Companies –
Activity-wise: 2009-10 and 2010-11 (Concld.) |
(` Million) |
Item |
Asset Finance |
Diversified |
Miscellaneous |
(78) |
(15) |
(187) |
2009-10 |
2010-11 |
2009-10 |
2010-11 |
2009-10 |
2010-11 |
| |
7 |
8 |
9 |
10 |
11 |
12 |
I. Cash and Bank Balances |
12,505 |
107 |
127 |
-152 |
28,183 |
11,921 |
26. Deposits with Banks |
12,611 |
-45 |
151 |
-119 |
28,195 |
11,928 |
27. Cash in Hand |
-106 |
152 |
-24 |
-34 |
-12 |
-7 |
J. Investments |
986 |
7,646 |
38 |
274 |
11,026 |
649 |
Of which, Quoted Investments |
-2,223 |
-3 |
-17 |
– |
2,527 |
-6,405 |
28. Foreign Securities |
– |
– |
– |
– |
-310 |
98 |
29. Indian Securities |
986 |
7,646 |
38 |
274 |
11,335 |
551 |
(a) Government/ Semi-Government Securities |
162 |
13 |
1 |
4 |
76 |
-97 |
(b) Public Sector Undertakings |
1 |
27 |
-1 |
– |
239 |
-236 |
(c) Securities of Financial Institutions |
-9 |
-2 |
– |
– |
-20 |
2 |
(d) Mutual Funds |
-1,162 |
1,845 |
1 |
7 |
4,622 |
-6,857 |
(e) Shares and Debentures of subsidiaries/ Holding |
19 |
3,480 |
1 |
49 |
4,634 |
4,034 |
(f) Shares and Debentures of Other Indian Companies |
739 |
876 |
37 |
214 |
2,262 |
1,472 |
(g) Others |
1,236 |
1,408 |
– |
– |
-477 |
2,234 |
K. Receivables |
60,312 |
91,206 |
961 |
1,746 |
21,833 |
20,677 |
30. Loans and Advances |
61,608 |
93,383 |
804 |
1,565 |
878 |
3,615 |
(a) Subsidiary Companies |
183 |
-354 |
– |
– |
193 |
1,006 |
(b) Holding Companies and Companies in the Same Group |
– |
– |
1 |
33 |
112 |
231 |
(c) Against Hire Purchase |
-40,792 |
58,375 |
20 |
-29 |
-66 |
-325 |
(d) Bills Discounted |
1 |
585 |
-12 |
249 |
-13 |
24 |
(e) Others |
1,02,215 |
34,777 |
796 |
1,312 |
653 |
2,679 |
31. Book Debts |
-1,297 |
-2,177 |
157 |
181 |
20,954 |
17,062 |
(a) Sundry Debtors |
-298 |
102 |
158 |
160 |
22,298 |
17,023 |
(b) Dividend/ Interest Accrued |
-16 |
-1 |
7 |
27 |
178 |
696 |
(c) Others |
-983 |
-2,278 |
-8 |
-6 |
-1,521 |
-657 |
L. Inventories |
852 |
-249 |
59 |
-244 |
5,305 |
2,609 |
32. Government and Semi Government Securities |
– |
– |
– |
– |
185 |
-321 |
33. Industrial Securities |
884 |
-266 |
68 |
-246 |
4,776 |
3,136 |
34. Repossessed Goods on Hire Purchase |
-53 |
-41 |
4 |
11 |
– |
– |
35. Other Goods, Stores and Others |
21 |
58 |
-13 |
-8 |
344 |
-207 |
M. 36. Gross Fixed Assets |
-8 |
-245 |
155 |
12 |
1,853 |
2,669 |
of which (a) Plant and Machinery Leased |
-322 |
-1,452 |
32 |
-1,579 |
-25 |
– |
(b) Equipments Leased |
-11 |
-1 |
-21 |
-54 |
– |
357 |
(c) Vehicles Leased |
-991 |
-249 |
-14 |
-220 |
-3 |
-97 |
(d) Other Assets Leased |
-39 |
-23 |
4 |
-9 |
– |
-318 |
N. 37. Other Assets |
2 |
29 |
11 |
-4 |
-537 |
-506 |
38. Total |
74,648 |
98,495 |
1,351 |
1,633 |
67,662 |
38,018 |
Annex 1: Combined Income, Expenditure and Appropriation Accounts of the Select 1,344
Financial and Investment Companies- Activity-wise: 2008-09 to 2010-11 |
(` Million) |
Items |
2008-09 |
2009-10 |
2010-11 |
1 |
2 |
3 |
Income |
|
|
|
1. Financial Income |
5,13,491 |
5,72,730 |
6,94,349 |
A. Fund-based Income |
4,55,892 |
5,00,494 |
6,18,274 |
(a) Interest |
3,22,506 |
3,37,553 |
4,35,687 |
(i) On Loans and Advances |
2,53,647 |
2,70,174 |
3,44,607 |
(ii) Others |
68,858 |
67,379 |
91,079 |
(b) Dividends |
17,835 |
21,862 |
21,488 |
(c) Net Profit/ Loss in Share Dealings |
30,124 |
45,106 |
41,103 |
(d) Net Earnings from Hire Purchase Financing |
25,613 |
25,558 |
32,804 |
(e) Lease rentals |
9,055 |
8,971 |
17,721 |
(f) Other Fund-based Income |
50,758 |
61,444 |
69,472 |
B. Fee-based Income |
57,599 |
72,237 |
76,075 |
(a) Brokerage |
29,637 |
37,131 |
36,966 |
(b) Bill Discounting |
669 |
781 |
878 |
(c) Merchant Banking |
1,506 |
2,025 |
2,321 |
(d) Others fee-based |
25,788 |
32,300 |
35,909 |
2. Non-financial Income |
1,973 |
1,557 |
1,830 |
Of which: Rent |
599 |
625 |
768 |
3. Non-operating Surplus(+)/ Deficit(–) |
2,958 |
3,234 |
-789 |
4. Total (1+2+3) |
5,18,422 |
5,77,522 |
6,95,391 |
Expenditure and Appropriations |
|
|
|
5. Interest |
2,38,781 |
2,40,705 |
2,84,699 |
6. Salaries, Wages and Bonus |
40,635 |
46,606 |
52,152 |
7. Provident Fund |
2,201 |
1,980 |
2,572 |
8. Employees Welfare Expenses |
1,904 |
1,944 |
2,590 |
9. Managerial Remuneration |
1,810 |
1,646 |
1,948 |
10. Bad Debts # |
18,571 |
25,484 |
12,654 |
11. Other Expenses |
75,666 |
74,964 |
87,958 |
Of which: (a) Rent |
7,879 |
8,031 |
9,451 |
(b) Insurance |
562 |
457 |
508 |
(c) Advertisement |
3,080 |
2,596 |
3,954 |
12. Other Provisions (other than tax and depreciation) |
14,561 |
14,868 |
12,762 |
13. Operating Profits |
1,19,363 |
1,64,533 |
2,37,014 |
14. Depreciation Provision |
9,042 |
8,166 |
7,865 |
15. Earnings before Tax & Non-operating Surplus(+)/ Deficit(–) |
1,12,294 |
1,57,925 |
2,30,979 |
16. Non-operating Surplus(+)/ Deficit(–) |
2,958 |
3,234 |
-789 |
17. Earnings before Tax |
1,15,252 |
1,61,159 |
2,30,191 |
18. Less: Tax Provision |
43,503 |
57,162 |
73,666 |
19. Net Profits |
71,749 |
1,03,997 |
1,56,525 |
(a) Dividends |
24,387 |
35,764 |
42,625 |
(i) Ordinary |
23,855 |
35,390 |
42,155 |
(ii) Preference |
532 |
374 |
470 |
(b) Profits Retained |
47,362 |
68,233 |
1,13,900 |
20. Total (5 to 12 + 14+ 15 + 16) |
5,18,422 |
5,77,522 |
6,95,391 |
# Including provisions for bad debts |
Annex 2: Combined Balance Sheet of the Select 1,344 Financial and Investment Companies:
2008-09 to 2010-11 |
(` Million) |
Items |
2008-09 |
2009-10 |
2010-11 |
1 |
2 |
3 |
A. |
Share capital |
2,94,011 |
3,37,788 |
3,73,489 |
| |
1. Paid-up Capital |
2,93,962 |
3,37,736 |
3,73,436 |
| |
(a) Ordinary |
2,62,685 |
3,07,292 |
3,32,690 |
| |
Of which, Bonus |
15,336 |
17,874 |
18,462 |
| |
(b) Preference |
31,277 |
30,444 |
40,746 |
| |
2. Forfeited Shares |
48 |
53 |
54 |
B. |
Reserves and Surplus |
7,36,134 |
8,63,675 |
10,71,218 |
| |
3. Capital Reserves |
3,80,600 |
4,42,669 |
5,25,995 |
| |
Of which, Premium on Shares |
3,45,651 |
4,03,215 |
4,82,556 |
| |
4. Investment Allowance Reserve |
123 |
123 |
42 |
| |
5. Sinking Funds |
1,467 |
2,392 |
5,260 |
| |
6. Other Reserves |
3,53,944 |
4,18,490 |
5,39,921 |
C. |
Borrowings |
26,88,412 |
31,79,393 |
41,44,475 |
| |
7. Debentures @ |
9,75,308 |
11,18,846 |
14,73,627 |
| |
8. Loans and Advances |
14,65,490 |
17,55,644 |
23,48,480 |
| |
(a) From banks |
10,00,740 |
12,08,412 |
17,65,020 |
| |
Of which, Short-Term Borrowings |
6,74,574 |
5,02,588 |
7,55,502 |
| |
(b) From other Indian Financial Institutions |
1,06,036 |
1,12,423 |
1,20,387 |
| |
(c) From Foreign Institutional Agencies |
25,551 |
5,946 |
12,170 |
| |
(d) From Government and Semi-government Bodies |
6,500 |
14,759 |
10,449 |
| |
(e) From Companies |
66,458 |
71,369 |
61,475 |
| |
(f) From Others |
2,60,204 |
3,42,734 |
3,78,979 |
| |
9. Deferred Payments |
11 |
11 |
1,034 |
| |
10. Public Deposits |
2,47,603 |
3,04,892 |
3,21,335 |
| |
(Of total borrowings, debt) |
16,87,682 |
22,62,765 |
29,50,497 |
D. |
Trade Dues and Other Current Liabiliabilities |
3,07,236 |
3,47,861 |
4,08,315 |
| |
11. Sundry Creditors |
1,25,145 |
1,27,627 |
1,30,907 |
| |
12. Acceptances |
1 |
– |
– |
| |
13. Liabilities to Susidiaries & Holding Companies |
258 |
445 |
1,757 |
| |
14. Advances/ Deposits from Customers, Agents, etc. |
40,182 |
59,017 |
28,208 |
| |
15. Interest Accrued on Loans |
56,269 |
66,384 |
80,105 |
| |
16. Others |
85,380 |
94,387 |
1,67,338 |
E. |
Provisions |
1,33,224 |
87,536 |
1,19,442 |
| |
17. Taxation (Net of Advance of Income-Tax) |
61,804 |
– |
– |
| |
18. Dividends |
19,321 |
28,442 |
35,107 |
| |
19. Other Current Provisions |
46,351 |
41,459 |
45,158 |
| |
20. Non-current Provisions |
5,747 |
17,635 |
39,177 |
F. |
21. Miscellaneous non-current liabilities |
– |
– |
– |
| |
22. Total |
41,59,016 |
48,16,253 |
61,16,939 |
@ Includes privately placed debentures
– Nil or negligible |
Annex 2: Combined Balance Sheet of the Select 1,344 Financial and Investment Companies:
2008-09 to 2010-11 (Concld.) |
(` Million) |
Items |
2008-09 |
2009-10 |
2010-11 |
1 |
2 |
3 |
G. Cash and bank balances |
3,76,699 |
4,16,407 |
4,39,821 |
23. Deposits with banks |
3,69,811 |
4,09,509 |
4,31,591 |
24. Cash in hand |
6,888 |
6,898 |
8,230 |
H. Investments |
7,57,659 |
7,82,288 |
9,73,624 |
Of which, quoted investments |
1,20,947 |
1,88,627 |
1,57,267 |
25. Foreign Securities |
330 |
22 |
118 |
26. Indian Securities |
7,57,329 |
7,82,266 |
9,73,506 |
(a) Government/ semi-Government securities |
44,713 |
46,102 |
38,031 |
(b) Public sector undertakings |
6,011 |
4,383 |
7,608 |
(c) Securities of Financial Institutions |
2,436 |
5,811 |
18,080 |
(d) Mutual funds |
1,52,297 |
1,19,080 |
1,20,506 |
(e) Shares and debentures of subsidiaries/ holding |
1,76,711 |
1,84,965 |
2,86,672 |
(f) Shares and debentures of other Indian companies |
3,46,955 |
3,62,874 |
3,98,216 |
(g) Others |
28,208 |
59,050 |
1,04,392 |
I. Receivables |
29,14,846 |
34,58,287 |
45,06,935 |
27. Loans and advances |
28,15,079 |
33,30,300 |
43,15,616 |
(a) Subsidiary companies |
18,900 |
26,073 |
54,585 |
(b) Holding companies and companies in the same group |
5,150 |
2,423 |
1,760 |
(c) Against hire purchase |
2,42,674 |
2,06,273 |
2,81,852 |
(d) Others |
25,48,355 |
30,95,531 |
39,77,419 |
28. Book debts |
99,767 |
1,27,987 |
1,91,319 |
(a) Sundry debtors |
39,567 |
61,976 |
83,020 |
(b) Dividend/ Interest accrued |
20,958 |
23,957 |
31,119 |
(c) Deposits balances with Govt/ others |
18,367 |
24,748 |
21,449 |
(d) Others |
20,874 |
17,307 |
55,732 |
J. Inventories |
48,815 |
71,122 |
80,065 |
29. Government and semi government securities |
434 |
8,006 |
10,491 |
30. Industrial securities |
46,274 |
59,742 |
65,882 |
31. Repossessed goods on hire purchase |
444 |
291 |
264 |
32. Other goods, stores and others |
1,663 |
3,083 |
3,428 |
K. 33. Advance of income-tax (net of tax provision) |
– |
25,158 |
39,337 |
L. 34. Gross fixed assets |
82,981 |
89,415 |
1,01,740 |
of which (a) Plant and machinery leased |
8,614 |
8,770 |
6,389 |
(b) Equipments leased |
374 |
322 |
612 |
(c) Vehicles leased |
4,183 |
3,133 |
2,700 |
(d) Other assets leased |
641 |
865 |
497 |
M. 35. Less: Depreciation Provision |
32,538 |
35,405 |
36,530 |
N. 36. Net fixed assets |
50,443 |
54,009 |
65,210 |
Of which: assets leased |
5,089 |
3,414 |
2,304 |
O. 37. Other assets |
10,554 |
8,982 |
11,947 |
38. Total |
41,59,016 |
48,16,253 |
61,16,939 |
@ Includes privately placed debentures
-Nil or negligible
Note: this statements is derived from Annex 2. The figure have been adjusted for revaluation, etc.
Item A(1) represents capitalised reserves and forfeited shares. |
Annex 3: Sources and Uses of funds of the Select 1,344 Financial and Investment Companies:
2009-10 and 2010-11 |
(` Million) |
Item |
2009-10 |
2010-11 |
1 |
2 |
Internal Sources |
-764 |
1,40,724 |
A. 1. Paid-up Capital |
2,537 |
589 |
B. Reserves and Surplus |
64,693 |
1,20,944 |
2. Capital Reserves |
-779 |
-3,273 |
3. Investment Allowance Reserve |
– |
-81 |
4. Sinking Funds |
926 |
2,867 |
5. Other Reserves |
64,546 |
1,21,431 |
C. Provisions |
-67,993 |
19,192 |
6. Depreciation |
2,853 |
1,464 |
7. Taxation (net of advance of Income-tax) |
-86,963 |
-14,179 |
8. Dividends |
9,121 |
6,665 |
9. Other current provisions |
-4,892 |
3,700 |
10. Non-current provisions |
11,888 |
21,542 |
External Sources |
6,35,710 |
11,46,642 |
D. Paid-up Capital |
99,829 |
1,18,692 |
11. Net issues |
41,240 |
35,112 |
12. Premium on Shares |
58,589 |
83,579 |
E. 13. Capital receipts |
4,275 |
2,414 |
F. Borrowings |
4,90,981 |
9,65,082 |
14. Debentures @ |
1,43,538 |
3,54,781 |
15. Loans and Advances |
2,90,154 |
5,92,836 |
(a) From Banks |
2,07,672 |
5,56,607 |
(b) From Other Indian Financial Institutions |
6,388 |
7,963 |
(c) From foreign Institutional Agencies |
-19,605 |
6,224 |
(d) From Government and Semi-government Bodies |
8,259 |
-4,310 |
(e) From Companies |
4,911 |
-9,894 |
(f) From Others |
82,530 |
36,246 |
16. Deferred Payments |
– |
1,022 |
17. Public Deposits |
57,289 |
16,443 |
G. Trade dues and other current liabiliabilities |
40,625 |
60,454 |
18. Sundry Creditors |
2,482 |
3,280 |
19. Acceptances |
-1 |
– |
20. Liabilities to Companies |
187 |
1,312 |
21. Advances/ Deposits from Customers, agents, etc. |
18,835 |
-30,809 |
22. Interest accrued on Loans |
10,115 |
13,720 |
23. Others |
9,007 |
72,951 |
H. 24. Miscellaneous Non-current |
– |
– |
25. Total |
6,34,946 |
12,87,367 |
– Nil or negligible |
Annex 3: Sources and Uses of funds of the Select 1,344 Financial and Investment Companies:
2009-10 and 2010-11 (Concld.) |
(` Million) |
Item |
2009-10 |
2010-11 |
1 |
2 |
I. Cash and Bank Balances |
39,708 |
23,414 |
26. Deposits with Banks |
39,698 |
22,081 |
27. Cash in Hand |
10 |
1,332 |
J. Investments |
24,629 |
1,91,336 |
Of which, Quoted Investments |
67,681 |
-31,360 |
28. Foreign Securities |
-308 |
96 |
29. Indian Securities |
24,937 |
1,91,240 |
(a) Government/ Semi-Government Securities |
1,389 |
-8,071 |
(b) Public Sector Undertakings |
-1,627 |
3,224 |
(c) Securities of Financial Institutions |
3,375 |
12,270 |
(d) Mutual Funds |
-33,217 |
1,426 |
(e) Shares and Debentures of subsidiaries/ Holding |
8,254 |
1,01,707 |
(f) Shares and Debentures of Other Indian Companies |
15,920 |
35,342 |
(g) Others |
30,843 |
45,342 |
K. Receivables |
5,43,441 |
10,48,648 |
30. Loans and Advances |
5,15,220 |
9,85,316 |
(a) Subsidiary Companies |
7,173 |
28,512 |
(b) Holding Companies and Companies in the Same Group |
-2,727 |
-663 |
(c) Against Hire Purchase |
-36,402 |
75,580 |
(d) Bills Discounted |
5,350 |
3,655 |
(e) Others |
5,41,826 |
8,78,233 |
31. Book Debts |
28,221 |
63,332 |
(a) Sundry Debtors |
22,408 |
21,044 |
(b) Dividend/ Interest Accrued |
2,999 |
7,162 |
(c) Others |
2,813 |
35,126 |
L. Inventories |
22,306 |
8,944 |
32. Government and Semi Government Securities |
7,572 |
2,485 |
33. Industrial Securities |
13,468 |
6,140 |
34. Repossessed Goods on Hire Purchase |
-153 |
-27 |
35. Other Goods, Stores and Others |
1,420 |
345 |
M. 36. Gross Fixed Assets |
6,434 |
12,060 |
of which (a) Plant and Machinery Leased |
156 |
-2,381 |
(b) Equipments Leased |
-52 |
290 |
(c) Vehicles Leased |
-1,051 |
-433 |
(d) Other Assets Leased |
224 |
-367 |
N. 37. Other Assets |
-1,572 |
2,965 |
38. Total |
6,34,946 |
12,87,367 |
– Nil or negligible |
Explanatory Notes to Statements Due to rounding off of figures, the constituent items may not add up exactly to the totals. The growth rates of all the items and data on sources and uses of funds are adjusted for changes due to amalgamation of companies and revaluation, etc., wherever necessary. Financial Income comprises of income received by way of (a) interest, (b) dividends, (c) brokerage, (d) net profit/loss in share dealings, (e) net earnings from hire purchase financing and (f) lease rental, (g) bill discounting, (h) merchant banking/underwriting and (i) other financial income. Non-Financial Income comprises of income received by way of (a) rent, (b) sales and (c) other non-financial income. Income includes non-operating surplus/ deficit but excludes transfers from reserves outstanding at the end of the previous year and amount carried forward at the end of the previous year. Non-operating surplus/ deficit comprises (a) profit/ loss on account of sale of fixed assets, etc. (b) provisions no longer required written back, (c) insurance claims realised and (d) income/ expenditure relating to the previous years and such other items of non-current nature. Profit/ loss on sale of financial investments is included in net profit/ loss in share dealings. Total expenditure comprises interest payments, remuneration to employees, managerial remuneration, bad debts (written off or provided for), other expenses, depreciation provision and other provisions. Remuneration to employees comprises (a) salaries, wages and bonus, (b) provident fund and (c) employees’ welfare expenses (including gratuity, etc.). Tax provision includes provisions for current tax, wealth tax, fringe benefit tax, corporate dividend tax and other tax. Operating profits are profit before depreciation provision and tax, however non-financial income and non-operating surplus/deficit are excluded. Dividend payment includes deferred dividends. Retained profits comprises transfers to reserves and profit/ loss carried to balance-sheet. Ordinary paid-up capital includes deferred shares. Capital reserves include profit on sale of investments and fixed assets. Other reserves include profits retained in the form of various specific reserves and profit/ loss carried to balance sheet. Equity or Net worth comprises (a) paid-up capital, (b) forfeited shares and (c) all reserves and surplus. Debentures include privately placed debentures with financial institutions. Debt comprises (a) all borrowings from Government and semi-Government bodies, financial institutions other than banks, and from foreign institutional agencies, (b) borrowings from banks against mortgages and other long term securities, (c) borrowings from companies and others against mortgages and other long term securities and (d) debentures, deferred payment liabilities and public deposits. Trade dues and other current liabilities-others include share application money. Internal Sources: These are own sources comprising capitalised reserves, retained profits, depreciation provision and other provisions. External Sources: These are other than own sources comprising funds raised from capital markets, borrowed funds, trade dues and other current liabilities and miscellaneous non-current liabilities.
|