 IST,
IST,


Performance of Non-Government Non-Banking Financial and Investment Companies: 2014-15
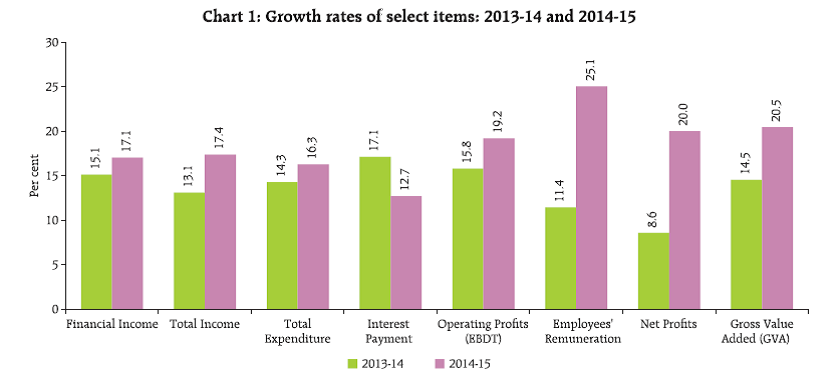
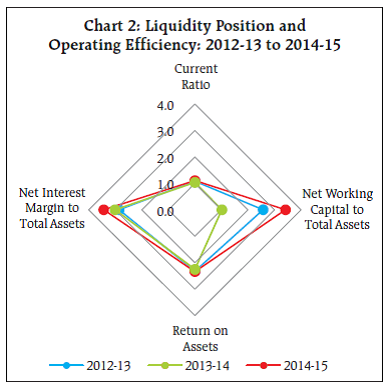
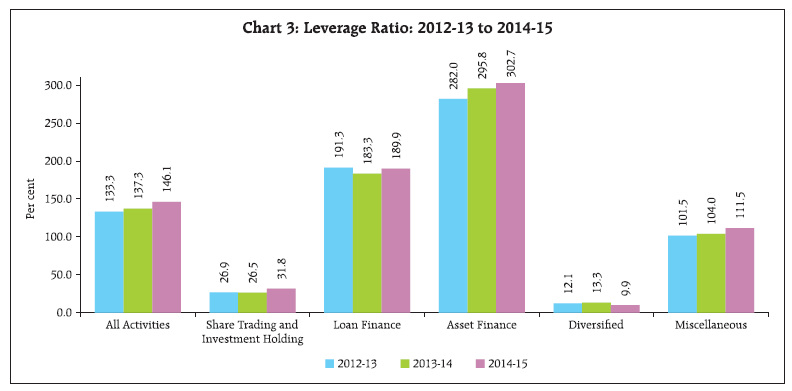
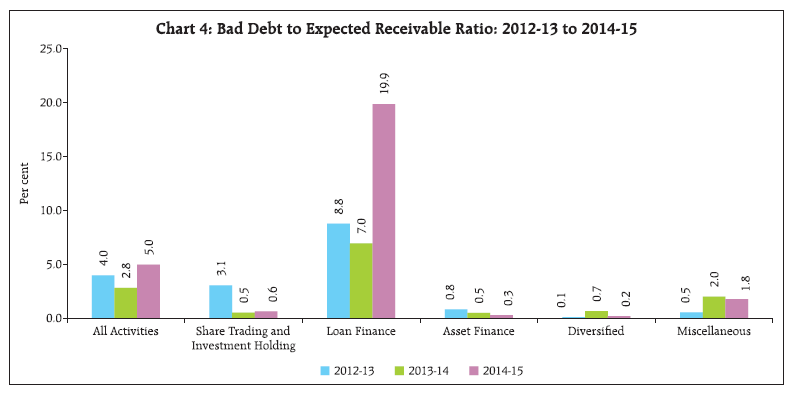
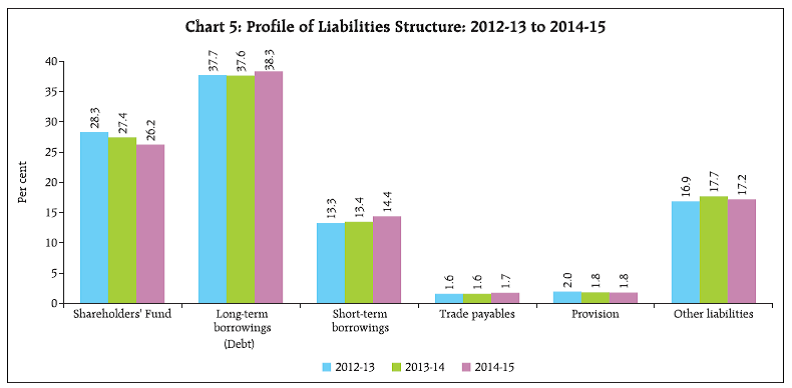
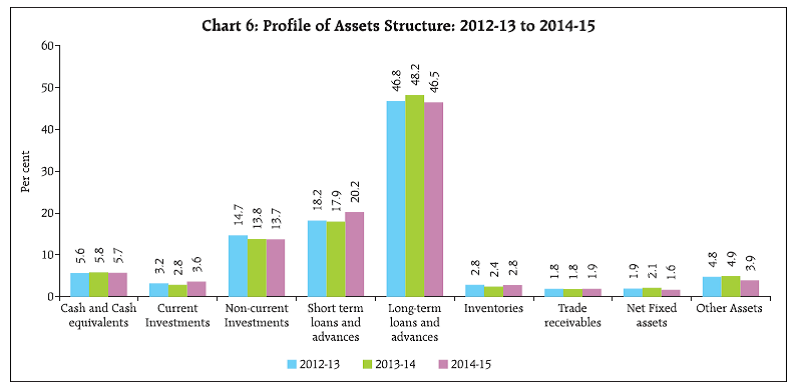
An analysis of financial performance of select 23,293 non-government non-banking financial and investment companies (NGNBF&I) for the year 2014-15, based on their audited annual accounts showed that the overall performance of NGNBF&I companies had improved during 2014-15 as compared to the previous year. Gross value added of NGNBF&I companies grew at significantly higher rate in 2014-15 as compared to the previous year. Financial income witnessed higher growth rate during 2014-15 as compared to the previous year, mainly contributed by higher interest income. Growth rate of operating profits (EBDT) as well as net profit increased significantly in 2014-15 as compared to the previous year. Also, the operating profit margin, return on assets and return on shareholders’ equity increased in 2014-15 as compared to the previous year. However, leverage and bad debt to expected receivables ratios increased in 2014-15 as compared to the previous year. The share of short-term and long-term borrowings in total equity and liabilities increased during 2014-15 as compared to the previous year. Correspondingly, shareholders’ fund declined gradually over the three years period. On the assets side, share of short-term loans and advances in total assets increased during 2014-15, whereas the share of long-term loans and advances along with non-current investment declined in 2014-15. The select NGNBF&I companies continued to rely mainly on external sources for funds in business expansion; however their share in total sources of funds declined marginally during 2014-15. The share of funds mobilised through debt finance increased in 2014-15. The funds were used predominantly for expanding their investment and short term loans and advances portfolios. This article presents an analysis of the performance of non-government non-banking financial and investment (NGNBF&I) companies (excluding insurance and banking companies) for the financial year 2014-15, based on the audited annual accounts of 23,293 companies which closed their accounts during the period April 2014 to March 2015. Of these, data pertaining to 22,899 companies are based on Ministry of Corporate Affairs (MCA)1 systems Extensible Business Reporting Language (XBRL) and Form AOC-4 (Non-XBRL) platform, data for 363 companies are as collated by Department of Statistics and Information Management (DSIM) from Department of Non-Banking Supervision (DNBS), Regional Offices of the Reserve Bank of India, while the data for the remaining 31 companies are obtained from other sources (not included in the select NGNBF&I of MCA and DSIM database). A comparative picture on performance of these companies during the last three years period i.e., from 2012-13 to 2014-15 has been assessed in this article. The detailed data for select 23,293 companies for the study year 2014-15 along with explanatory notes have been made available in the Data Release section of the Reserve Bank of India website in March 2016. As per provisional estimate of population paid-up capital (PUC) supplied by Ministry of Corporate Affairs (MCA), Government of India (GoI), the select 23,293 NGNBF&I companies accounted for 77.8 per cent of total PUC of all NGNBF&I as on March 31, 2015. Identification of NGNBF&I companies were based on National Industrial Classification (NIC) 2004 code and they were further classified into five major activity groups, viz., (1) Share Trading and Investment Holding, (2) Loan Finance, (3) Asset Finance, (4) Diversified and (5) Miscellaneous (including Chit Fund and Mutual Fund companies). In terms of PUC, the composition of select 23,293 NGNBF&I companies showed that ‘Share Trading and Investment Holding’ has the largest share followed by ‘Loan Finance’ and ‘Asset Finance’ companies. However, ‘Loan Finance’ companies dominated the sample in terms of financial parameters viz., financial income and total net assets during 2014-15 (Table 1). 1. Growth Rates: Gross Value Added improved significantly 1.1 Gross value added (GVA) of select NGNBF&I companies increased significantly by 20.5 per cent in 2014-15 as against 14.5 per cent registered in 2013-14. The improvement in GVA was mainly on account of significant growth in operating profit along with employees’ remuneration during 2014-15. (Chart 1 and Statement 1). 1.2 Financial income of the select 23,293 NGNBF&I companies witnessed a growth of 17.1 per cent in 2014-15 as against 15.1 per cent in 2013-14. This growth in financial income was mainly driven by higher interest income during the year. However, dividend income contracted significantly by 31.7 per cent in 2014-15 from 2.5 per cent growth registered in 2013-14. The increase in financial income had resulted in significant growth in total income, which grew at 17.4 per cent in 2014-15 as compared to 13.1 per cent in 2013-14 (Chart 1 and Statement 1). 1.3 Total expenditure on the other hand increased at lower rate as compared with total income, resulting in higher operating profit (EBDT) growth of 19.2 per cent in 2014-15 as against 15.8 per cent in 2013-14. Significant reduction in the growth rate of interest payment was seen in 2014-15. Interest expenses grew at lower rate of 12.7 per cent in 2014-15 as against 17.1 per cent in 2013-14 (Chart 1). 1.4 Dividend payment contracted by 7.8 per cent during 2014-15 as compared 17.1 per cent growth recorded in the previous year, leading to higher growth rate in the retained profit during 2014-15 (Statement 1). 1.5 Growth rate of total borrowings increased to 19.1 per cent in 2014-15 from 12.5 per cent in 2013-14. However, the growth in borrowings from banks had moderated to 11.7 per cent in 2014-15 from 12.0 per cent in the previous year. It was also observed that the investment (short and long term investment together) had increased significantly by 19.9 per cent in 2014-15 from 4.5 per cent witnessed in the previous year (Statement 1). 1.6 Among the activity groups, ‘Loan Finance’ and ‘Miscellaneous’ companies, witnessed significant increase in GVA during 2014-15 as compared to the previous year (Statement 1). 2. Liquidity Position and Operating Efficiency: Net Working Capital and Net Interest Margin Improved 2.1 The liquidity position of select NGNBF&I companies to meet its short-term obligations as measured by current ratio (ratio of current asset to current liability) increased marginally to 1.1 in 2014-15 from 1.0 in the previous year. Further, solvency ratio (measured as a ratio of operating profit to total outside liabilities) and net working capital (measured as current assets minus current liabilities expressed as a percentage of total assets) also improved to 3.5 per cent and 3.4 per cent in 2014-15, respectively, from 3.4 per cent and 1.0 per cent in 2013-14 (Chart 2 and Statement 2). 2.2 On the operational side, the select NGNBF&I companies employed their assets more efficiently in 2014-15 as compared to the previous year. The net interest margin expressed as a percentage of total assets had gone up by 3.4 per cent in 2014-15 as compared to 3.0 per cent in 2013-14 (Chart 2 and Statement 2). 3. Profitability Ratios: Operating Profit margin as well as RoA and RoE improved 3.1 The operating profit margin, measured as a ratio of operating profits to financial income of select NGNBF&I companies increased marginally to 29.4 per cent in 2014-15 from 28.8 per cent in the previous year. Among the activity groups, ‘Share Trading and Investment Holding’, ‘Loan Finance’ and ‘Diversified’ companies witnessed increase in operating profit margin during 2014-15 as compared to the previous year (Statement 2). 3.2 Return on assets (RoA) (measured as a ratio of net profits to total net assets) and return on equity (RoE) (measured as a ratio of net profit to net worth) of select NGNBF&I companies increased gradually to 2.3 per cent and 8.9 per cent, respectively, in 2014-15 from 2.2 per cent and 8.2 per cent in 2013-14. All the activity groups, except ‘Miscellaneous’ companies witnessed a marginal increase in RoA and RoE during 2014-15 as compared to the previous year (Statement 2). 3.3 The dividend payout ratio (measured as a ratio of dividends paid to net profits) declined considerably to 22.3 per cent in 2014-15 from 29.1 per cent recorded in the previous year. All the activity groups, except ‘Miscellaneous’ companies witnessed decrease in dividend payout ratio during 2014-15 as compared to the previous year (Statement 2). 4. Vulnerability: Leverage and Bad Debt to Expected Receivables Ratios had increased 4.1 The select NGNBF&I companies continue to witness gradual increase in leverage ratio (measured as a ratio of debt to equity) from 133.3 per cent in 2012-13 to 146.1 per cent in 2014-15. The leverage ratio of ‘Asset Finance’ companies was at significantly high level during the three years period as compared to other activity groups and had gone up more than 300.0 per cent in 2014-15 (Chart 3). 4.2 Though the overall performance of select NGNBF&I companies in terms of their liquidity position and operational efficiency had improved in 2014-15 as compared to the previous year, their bad debt to expected receivable2 ratio had gone up to 5.0 per cent in 2014-15 from 2.8 per cent in 2013-14, which is a drain on their profits. This increase in bad debt to expected receivable ratio is primarily on account of ‘Loan Finance’ companies (Chart 4 and Statement 2). 5. Income and Expenditure: Share of Interest Income in Total Income increased and share of Interest Expenses in Total Expenditure declined 5.1 The fund based income continued to play a dominant role in generating income for NGNBF&I companies as compared to the fee-based income. The share of interest income, which is the main source of fund-based income for NGNBF&I companies, in total income increased to 72.1 per cent during 2014-15 from 70.8 per cent witnessed in the previous year. This increase in share of interest income during the year was observed for all the activity groups, except for ‘Loan Finance’ companies, which experienced marginal declined in 2014-15 as compared to the previous year (Statement 3). 5.2 On the expenditure side, the share of interest expenses in total expenditure of select NGNBF&I companies declined from 62.2 per cent in 2013-14 to 60.3 per cent in 2014-15. However, the shares of employees benefit expenses (Salaries, Wages and Bonus plus Provident Fund plus Employees Welfare Expenses) in total expenditure increased during 2014-15. This increase in the share of employees benefit expenses was witnessed in all the activity groups, except for ‘Share Trading and Investment Holding’ companies (Statement 3). 6. Liabilities Structure: Share of Shareholders’ Funds declined gradually but share of Short and Long term Borrowings increased 6.1 The share of shareholders’ funds in total equity and liabilities witnessed a gradual decline from 28.3 per cent in 2012-13 to 26.2 per cent in 2014-15 (Chart 5). Similar trends were also witnessed for reserve and surplus as well as share capital. The decline in the share of shareholders’ funds in total equity and liabilities during 2014-15 was witnessed among all the activity groups (Statement 4). 6.2 The capital structure of select NGNBF&I companies showed that the share of short-term and long-term borrowings in total equity and liabilities increased to 14.4 per cent and 38.3 per cent, respectively, in 2014-15 from 13.4 per cent and 37.6 per cent in 2013-14. Further, the share of long-term loans from banks also increased to 15.7 per cent in 2014-15 from 14.4 per cent registered in 2013-14 (Chart 5 and Statement 4). 6.3 An increase in the share of long-term borrowings in total equity and liabilities was seen among all activity groups, except for ‘Diversified’ companies, which declined to 5.9 per cent in 2014-15 from 8.4 per cent in 2013-14. For ‘Share Trading and Investment Holding’, ‘Loan Finance’ and ‘Miscellaneous’ companies, the share of both short-term and long-term borrowings in total equity and liabilities increased during 2014-15 (Statement 4). 7. Assets Pattern: Share of Short-term Loans and Advances increased while that of Long-term Loans and Advances as well as Non-current Investment in Total Assets declined 7.1 The composition of assets for select NGNBF&I companies showed that loans and advances (inclusive of both short and long-term loans and advances) constituted more than 60.0 per cent of the total assets. The share of long-term loans and advances in total assets had gone down to 46.5 per cent during 2014-15 from 48.2 per cent in 2013-14, whereas the share of short-term loans and advances had increased to 20.2 per cent in 2014-15 from 17.9 per cent in the previous year. The increase in the share of short-term loans and advances in total assets was seen among all activity groups during 2014-15, except for ‘Miscellaneous’ companies (Chart 6 and Statement 5). 7.2 The share of non-current investments in total assets declined gradually to 13.7 per cent in 2014-15 from 14.7 per cent in 2012-13. This gradual decline in the share of non-current investment in total assets was witnessed among all the activity groups, except for ‘Miscellaneous’ companies (Chart 6 and Statement 5). 7.3 However, the share of current investments in total assets increased to 3.6 per cent from 2.8 per cent in 2013-14. Further, the share of cash and cash equivalents in total assets declined marginally to 5.7 per cent in 2014-15 from 5.8 per cent in 2013-14 (Chart 6). 8. Sources of Funds: Share of Fund raised through Debt Finance in Total Sources of Funds increased 8.1 With larger role of short-term and long-term borrowings in total equity and liabilities structure of select NGNBF&I companies (covering more than 50.0 per cent in total equity and liabilities), the external sources continued to play a major role in expanding the business. However, the share of fund mobilised through external sources in total sources of funds declined marginally to 84.2 per cent in 2014-15 as against 84.8 per cent recorded in 2013-14. The decline in the share of external sources of funds in total sources of funds was observed among all the activity groups, except for ‘Asset Finance’ companies (Statement 6). 8.2 The fund raised through debt finance (both short-term and long-term borrowings) increased during the year. The share of funds mobilised from short-term and long-term borrowings in total sources of funds increased to 20.3 per cent and 42.6 per cent, respectively, in 2014-15 from 14.8 per cent and 36.9 per cent in 2013-14. This increase in the share of funds mobilised through short-term and long-term borrowings was mainly on account of funds raised through other short-term loans and advances along with long-term bond/ debenture and term loans from banks. The share of fund raised through term loans from banks in total sources of funds increased significantly to 24.4 per cent in 2014-15 from 6.4 per cent in the previous year (Statement 6). 8.3 The share of internal sources of funds in total sources of funds increased marginally to 15.8 per cent in 2014-15 from 15.2 per cent in the previous year, which was largely contributed by the increase in the share of reserve and surplus during 2014-15. The increase in the share of internal sources of funds in total sources of funds was observed only for ‘Asset Finance’ companies, among the activity groups (Statement 6). 9. Uses of Funds: Short-term loans financing and Investment pick-up in business activity 9.1 The short-term and long-term loans and advances constituted around 70.0 per cent in total uses of funds. The share of short-term loans and advances extended by select NGNBF&I companies in total uses of funds increased significantly to 34.7 per cent in 2014-15 from 15.9 per cent recorded in 2013-14, whereas the share of long-term loans and advances in total uses of funds declined to 34.9 per cent in 2014-15 from 59.6 per cent registered in the previous year. Further, the share of non-current investments in total uses of funds improved to 13.0 per cent in 2014-15 from 6.7 per cent in 2013-14 (Statement 7). 9.2 An increase in the share of short-term loans and advances in total uses of funds during 2014-15 was witnessed among all the activity groups, except for ‘Miscellaneous’ companies. While, decline in the share of long-term loans and advances in total uses of funds was seen for ‘Share Trading and Investment Holding’, ‘Asset Finance’ and ‘Miscellaneous’ companies. For ‘Loan Finance’ companies, share of long-term loans and advances in total uses of funds increased to 70.0 per cent in 2014-15 from 61.5 per cent in 2013-14 (Statement 7). 10. Performance of Chit Fund and Mutual Fund Companies: Operating Profit margin, RoA and RoE improved 10.1 In contrast to the improvement observed in the financial performance of the select NGNBF&I companies at aggregate level, the financial income for select 1,465 Chit Fund and Mutual Fund companies grew at lower rate of 9.0 per cent during 2014-15 as against 10.4 per cent registered in previous year. However, their total income grew at a higher rate of 11.1 per cent in 2014-15 as compared to 9.4 per cent in 2013-14 (Table 2). 10.2 The total expenditure of select Chit Fund and Mutual Fund companies increased by 6.6 per cent in 2014-15 as compared to 10.5 per cent in 2013-14. As a result of lower total expenditure growth as compared with total income, operating profits of select Chit Fund and Mutual Fund companies grew at much higher rate of 17.8 per cent in 2014-15 as compared to 5.2 per cent in the previous year. Further, net profits of select Chit Fund and Mutual Fund companies expanded significantly by 46.2 per cent in 2014-15 after contracting by 3.2 per cent during 2013-14 (Table 2). 10.3 Similar to the trend at aggregate level, the leverage ratio (debt to equity ratio) of select Chit Fund and Mutual Fund companies increased gradually over the last three years. However, operating profit margin, RoA and RoE of select Chit Fund and Mutual Fund companies improved in 2014-15 after slipping marginally in the previous year (Table 2). 10.4 The share of borrowings in total net assets declined to 15.5 per cent in 2014-15 from 17.8 per cent in 2013-14, however the share of borrowings from banks in total borrowings by select Chit Fund and Mutual Fund companies increased marginally to 15.1 per cent in 2014-15 from 14.4 per cent in 2013-14 (Table 2). 11. Concluding Observations 11.1 The aggregate results shows that the overall performance of the select 23,293 NGNBF&I companies had improved in 2014-15. Gross value added (GVA) along with total income had accelerated in 2014-15 as compared to the previous year. Total expenditure grew at lower rate as compared with total income, leading to significant growth in operating profit (EBDT) during 2014-15. The growth in interest expenses, which constituted around 60.0 per cent of total expenditure, had moderated in 2014-15 as compared to the previous year. 11.2 Further, the liquidity position and operating efficiency of select NGNBF&I companies had improved in 2014-15. However, leverage ratio and bad debt to expected receivables ratio increased in 2014-15. 11.3 The shares of both short-term and long-term borrowings in total equity and liabilities of select NGNBF&I companies increased in 2014-15 as compared to the previous year, whereas the share of shareholders’ funds in total equity and liabilities declined gradually over the three years period. On the assets side, share of short-term loans and advances in total assets increased, while share of long-term loans and advances as well as non-current investments declined in 2014-15. 11.4 The select NGNBF&I companies continued to rely mainly on external sources for their business expansion, though their share decreased marginally in 2014-15. The share of funds raised through debt finance increased in 2014-15 as compared to the previous year. Select NGNBF&I companies used their funds predominantly in expanding their investment and short-term loans and advances, portfolios in 2014-15.
* Prepared in the Company Finances Division (CFD) of the Department of Statistics and Information Management, Reserve Bank of India, Mumbai. The previous article was published in October 2015 issue of the Reserve Bank of India Bulletin, which covered 18,225 non-government non-banking financial and investment companies during 2013-14. 1 The CFD has been receiving corporate data from MCA, which collects corporate sector statistics, i.e., annual balance sheet and profit and loss accounts data, through two mutually exclusive systems viz., Extensible Business Reporting language (XBRL) and Form AOC-4 (Non-XBRL) platform. Under XBRL based system, corporate with PUC ₹ 5 crore and above or having turnover ₹100 crore and above or listed companies submit their complete annual accounts, whereas through ‘Form AOC-4 system, data on select variables from annual accounts of remaining companies are submitted. 2 Expected receivable is defined as bad debt plus receivables and bad debt include provision for doubtful debt. | |||||||||||||||||||||||||||||||||||||||||||||||||||||||||||||||||||||||||||||||||||||||||||||||||||||||||||||||||||||||||||||||||||||||||||||||||||||||||||||||||||||||||||||||||||||||||||||||||||||||||||||||||||||||||||||||||||||||||||||||||||||||||||||||||||||||||||||||||||||||||||||||||||||||||||||||||||||||||||||||||||||||||||||||||||||||||||||||||||||||||||||||||||||||||||||||||||||||||||||||||||||||||||||||||||||||||||||||||||||||||||||||||||||||||||||||||||||||||||||||||||||||||||||||||||||||||||||||||||||||||||||||||||||||||||||||||||||||||||||||||||||||||||||||||||||||||||||||||||||||||||||||||||||||||||||||||||||||||||||||||||||||||||||||||||||||||||||||||||||||||||||||||||||||||||||||||||||||||||||||||||||||||||||||||||||||||||||||||||||||||||||||||||||||||||||||||||||||||||||||||||||||||||||||||||||||||||||||||||||||||||||||||||||||||||||||||||||||||||||||||||||||||||||||||||||||||||||||||||||||||||||||||||||||||||||||||||||||||||||||||||||||||||||||||||||||||||||||||||||||

شارك هذه الصفحة:


بھارت موبائل ایپلی کیشن کے ریزرو بینک کو انسٹال کریں اور تازہ ترین خبروں تک فوری رسائی حاصل کریں!
ہماری ایپ انسٹال کرنے کے لیے QR کوڈ اسکین کریں۔


صفحے پر آخری اپ ڈیٹ:


