
Private Corporate Investment: Growth in 2015-16 and Prospects for 2016-17 - ربی - Reserve Bank of India


Private Corporate Investment: Growth in 2015-16 and Prospects for 2016-17
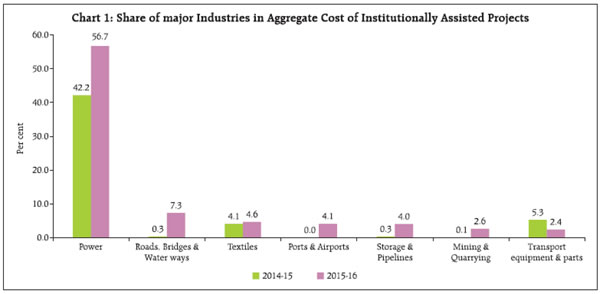
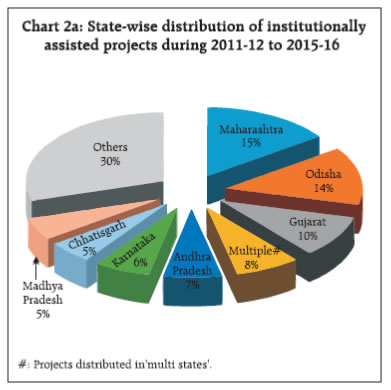
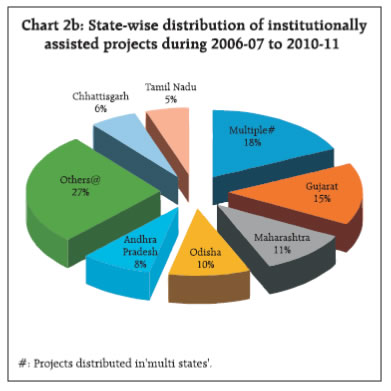
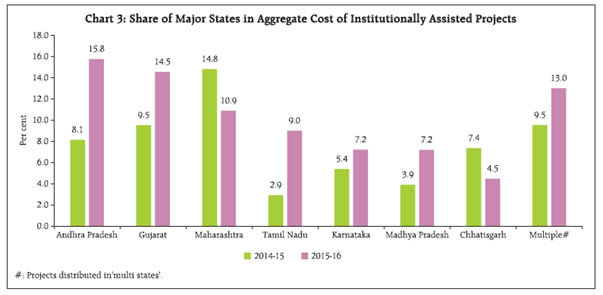
This article analyses the trend in investment intentions of private companies and joint business sectors, which provide a measure of short - term changes in business sentiments. The investment intention is gauged on the basis of cost of private corporate projects financed by select banks/Financial Institutions (FIs)**, through External Commercial Borrowings (ECBs) /Foreign Currency Convertible Bonds (FCCBs) or Initial Public Offerings (IPOs). Project financed by select banks / Financial Institutions in 2015- 16 signalled marginal improvement in investment sentiment in comparison with 2014-15 but funds raised through ECBs/FCCBs declined. In 2015-16, altogether, 706 companies made investment plans in projects with an aggregate cost of ₹1,387 billion, as compared with (revised) investment intentions in 828 such projects at an aggregate cost of ₹1,456 billion in 2014-15. Private corporate projects financed by banks / FIs in 2015- 16 were mainly in the infrastructure industries such as ‘Power’, ‘Roads, Bridges & Waterways’, ‘Ports & Airports’ and ‘Storage & Pipelines’. Such investments were also made in ‘Textiles’, ‘Transport Equipment & Parts’ and ‘Mining & Quarrying’ industries. On the other hand, ‘Telecommunication’ industry had dominated share in the projects supported by ECBs/FCCBs. Mega projects (₹50 billion and above) assisted by banks/FIs have fallen continuously - its share in total cost of such projects declined from 57.5 per cent in 2009 -10 to a low of 5.7 per cent in 2015-16. The Capital Expenditure(CapEx) likely to be incurred in any year can be estimated from the time phasing plans of the projects sanctioned financial assistance in that year or any earlier year. Investments of the private corporate sector financed by banks/FIs, ECBs/FCCBs or IPOs have been falling since 2011-12, however, the same have increasingly been supported through private placement of debt and Foreign Direct Investment (FDI) routes. CapEx by the private corporate sector, estimated at ₹1,512 billion in 2015-16 was 24.7 per cent lower than the revised estimate for 2014-15. Further, in order to maintain even this lower level of aggregate CapEx in 2016-17, an amount of ₹838 billion needs to be spent from the new projects to be sanctioned financial assistance in 2016-17. 1. Introduction Investment is considered as a key to enhance the productive capacity of an economy. Sustainable economic growth takes place when the Capital Expenditure (CapEx) is undertaken for new projects, or for expansion, modernisation or diversification of business activity. CapEx is incurred when a business entity either buys fixed assets or adds value to existing fixed assets with a useful life that extends beyond an accounting year. Information on CapEx investment intentions of the companies in private and joint business sector helps to assess the likely short-term changes in business sentiment. This article captures investment intentions of companies in private and joint business sector based on the financing details of such investments. The phasing plans furnished by companies indicate the likely level of CapEx that would have been made during 2015-16. The CapEx of pipeline projects is also estimated for the following year (2016-17). The rest of the article is organised in five sections. Section 2 briefly presents the approach including methodology, coverage and the limitations. Section 3 sketches the nature of new projects planned by the corporates in 2015-16. It covers all projects where funds have been raised through banks/ Financial Institutions (FIs), External Commercial Borrowings (ECBs) /Foreign Currency Convertible Bonds (FCCBs) or Initial Public Offerings (IPOs). However, due to the paucity of detailed data, analysis at disaggregated levels according to size-class, industrial sector, location/ State and purpose have been made only for institutionally assisted projects. Section 4 deals with estimates of CapEx envisaged by the corporate sector during 2015-16 and in the subsequent years. Section 5 looks into the trends in other sources of financing of corporate investment in projects such as private placement of debt and Foreign Direct Investment (FDI). Finally, section 6 presents an outlook for corporate investment for the year 2016-17 based on current economic scenario. 2. The Approach – Methodology, Coverage and Limitations The approach followed in this article is based on a methodology proposed by Dr. C. Rangarajan in his article titled ‘Forecasting CapEx in the Corporate Sector’ published in the December 13, 1970 issue of the “Economic and Political Weekly” and subsequent studies published by various authors in this direction. The details of investment (i.e., CapEx) intentions of the companies in a year along with phasing details also obtained from responding banks / FIs. This information is analysed to capture the CapEx that would be made in various years during the implementation of such projects and is juxtaposed with the CapEx envisaged from pipeline projects captured in previous years. From this, the likely level of CapEx in any year is calculated. Projects financed through other sources such as ECBs / FCCBs / IPOs are also considered. Sufficient care is taken to include the project only once, even if it is financed through more than one channel. The data for projects financed through ECBs / FCCBs is obtained from Form - 83 submitted to the Reserve Bank of India (RBI) by companies and information on funds raised by companies through IPOs is obtained from the Securities and Exchange Board of India (SEBI). Projects not financed through any of the above mentioned channels or size lower than ₹100 million are not covered in this study. Moreover, projects where the private ownership is 51 per cent or above are only considered and projects undertaken by Trusts, Central & State Governments, Educational Institutions, and Financial Institutions etc. are not included. The estimate of CapEx made in this study is largely based on projects in the Private Corporate Sector that were financially assisted by banks/FIs. Such data are obtained from Banks/ FIs, which include various components such as ‘Total Project Cost’, ‘Phasing Details’ together with information on ‘Purpose’, ‘Industry’ and ‘Location’ of the project. However, the assessment of corporate investment is based on the assumption that the companies would largely stick to their plans of envisaged expenditure outlined in their proposals. It may also be noted that estimates of corporate investment presented in this article are ex ante and differ in scope and methodology from the ex-post estimates of corporate fixed investment available in National Accounts Statistics (NAS). 3. Projects Planned during 2015-16 During the financial year 2015-16, 41 banks and FIs, who are actively involved in project finance, reported sanctioning of financial assistance for 352 projects with aggregate project cost of ₹954 billion. In addition, 314 companies contracted ECBs/FCCBs in 2015-16 to the extent of ₹388 billion and 40 companies proposed raising an investment of ₹45 billion by issue of domestic equity during 2015-16, which did not avail of finances from the responding banks/FIs. Thus, altogether, 706 companies made investment plans in 2015-16 aggregating ₹1,387 billion as against the investment intentions of 830 companies totalling ₹1,459 billion in 2014-15 (which stands revised to ₹1,456 billion by 828 companies, due to cancellation / revision). 3.1 Project finance by banks and FIs went up Investment scenario looked a tad better in 2015-16 considering the aggregate cost of projects that received financial sanction from banks and FIs. In the year 2015- 16, 352 projects were financed through Banks and FIs with an aggregate investment intention of ₹954 billion in comparison with 326 projects worth ₹873 billion in 2014-15. The phasing details of fresh sanctions in 2015- 16 indicated that around 41.6 per cent (₹397 billion) of the total proposed expenditure was planned to be incurred in the year of sanction, and another 30.9 per cent (₹295 billion) was to be spent in the next year (2016-17). The data submitted by banks revealed that an amount of ₹146 billion (15.3 per cent) was proposed to be spent beyond the year 2016-17. In the previous year’s study, an amount equivalent to 13.7 per cent was proposed to be spent cumulatively beyond two years from the period of sanction. Around 12 per cent of total project cost which received financial sanction in 2015-16 was already spent in the previous years, i.e., in 2013-14 and 2014-15 (Table 1). 3.1.1 Industrial Pattern of Projects – uptick in the share of infrastructure projects An analysis of the industrial pattern of projects revealed that ‘Power’ sector continued to dominate the investment scenario with a share of 56.7 per cent in the total cost of projects. Sectors such as ‘Roads, Bridges & Waterways’, ‘Ports & Airports’ and ‘Mining & Quarrying’ also recorded a rise in their share in 2015-16, while other major industries such as ‘Metals’, ‘Cement’, ‘Construction’ and ‘Hotel & Restaurants’ contributed less compared with the previous year. It may be noted that the share of ‘Roads, Bridges & Waterways’ sector has grown to approximately 7.3 per cent of the total project cost in 2015-16 from a negligible share in 2014- 15. Likewise, the share of ‘Storage & Pipelines’ sector rose to 4.0 per cent from 0.3 per cent share in the previous year. The infrastructure sector (comprising of ‘Power’, ‘Roads, Bridges & Waterways’, ‘Ports & Airports’, and ‘Storage & Pipelines’) accounted for 72.7 per cent of the total project cost in 2015-16, which was higher as compared with the previous year. The year 2015-16 also witnessed an upsurge in the number of infrastructure projects at 114, compared with 73 projects in the previous year (Chart 1 and Annex - I). 3.1.2 Size-wise Pattern of Projects – high value projects dwindled in 2015-16 Although, overall cost of projects in 2015-16 has grown by 9.5 per cent over the previous year, the growth has come only from small value projects, with cost less than ₹10 billion each. The share of high value projects (₹10 billion and above) in 2015-16 has reduced with a share of 44.5 per cent in the total project cost as against 59.8 per cent in the previous year. It is also observed that share of mega projects (more than ₹50 billion) has fallen since 2009 -10 and reached a low of 5.7 per cent in 2015-16 (Annex-II). 3.1.3 State-wise Pattern of Projects – Reflecting industry preference Location of projects changes from year to year depending on various factors such as accessibility of raw material, nature of project, availability of skilled labour, adequate infrastructure, market size, growth prospects, suppliers and demand for the products etc. Projects which have been distributed over a number of states were captured in the category of ‘multi states’ projects in this article. The spatial pattern of investment data for last five years i.e., 2011-12 to 2015-16, showed that over 50 per cent of the aggregate project cost during the period has been destined to Maharashtra, Odisha, Gujarat, Andhra Pradesh and Karnataka (Chart 2a). Comparing with the pattern for the previous five year period i.e. 2006-07 to 2010-11, it is observed that the share of ‘multi states’ projects was more in that period. Further, the top four states remained the same with a change in the ordering in terms of their share (Chart 2b). Andhra Pradesh, Gujarat, Maharashtra, Tamil Nadu, Karnataka and Madhya Pradesh together accounted for 64.6 per cent of cost of institutionally assisted projects in 2015-16. ‘Power’ projects dominated in all these states except in Maharashtra, where expansion and modernisation of ‘Ports & Airports’ topped the list of projects followed by ‘Power’. ‘Multi states’ projects were also mostly in the ‘Power’ sector. Besides, projects in ‘Textiles’ sector were taken up primarily in Gujarat and Tamil Nadu; ‘Roads, Bridges & Water ways’ were undertaken in Madhya Pradesh and Karnataka and ‘Transport equipment’ and ‘Coke & Petroleum products’ have been taken up in the states of Maharashtra and Chhattisgarh respectively (Chart 3). 3.1.4 Purpose - wise Pattern of Projects: Investments in new projects improved The purpose of the projects is classified into four groups such as ‘New’, ‘Expansion/Modernisation’, ‘Diversification’ and ‘Others’. A substantial improvement has been noticed 2015-16 with respect to ‘New’ projects which accounted for the largest share at 74.6 per cent of the total cost of projects in 2015-16, as against 39.7 percent share in 2014-15. Though the number of projects in the group of ‘Expansion and Modernisation’ slackened to 64 in 2015-16 as against 92 in the previous year, their share of the project cost remained at similar level (Annex - IV). 3.2 Project funding through ECBs (including FCCBs) declined in 2015-16 In addition to the projects which received financial assistance from banks/FIs, 314 private sector companies raised funds through ECBs/FCCBs for the purpose of CapEx, in 2015-16. These companies mobilised funds amounting to ₹388 billion to be spent on their projects. The corresponding figure for 2014-15 was higher at 478 and ₹572 billion respectively (Table 3). Major share (33.6 per cent) of the total amount mobilised was accounted for by ‘Telecommunication’ services compared with 8.6 per cent in the previous year. 3.3 Contribution of IPOs/FPOs/ Rights Issues improved positively During the financial year 2015-16, amount raised through IPOs for CapEx purpose has climbed over the previous year, along with the number of companies raising funds through IPOs. 40 non-government non-financial companies raised ₹45 billion through public/ rights issues to fund their CapEx, in comparison with ₹11 billion raised by 24 companies in 2014-15. These projects did not receive assistance from banks/FIs/ECBs/ FCCBs (Table 4). 4. Envisaged CapEx during 2015-16 4.1 Envisaged CapEx on projects financed by banks/FIs declined Capital expenditure on a project is generally spread over multiple years. Companies are required to indicate the envisaged plan for such expenditure when applying for financial assistance from banks/FIs. The likely investment of private corporate sector in a given year is arrived at by suitably aggregating the envisaged CapEx intended by companies on projects that were sanctioned assistance in various years up to that year. The data so consolidated are presented in Table 2. When horizontally read, it shows the CapEx that was expected to take place on projects sanctioned assistance in a particular year. The column totals indicate likely CapEx in a particular year covering sanctions in various years upto that year (and sometimes beyond). Although, fresh project investments by companies improved in 2015-16 over the previous year, the CapEx to be spent during the year declined. It is observed that CapEx of ₹600 billion would have been made during 2015-16 on projects sanctioned by banks/FIs prior to 2015-16. In addition, a sum of ₹397 billion is estimated to be spent during 2015-16 on projects receiving financial sanction in 2015- 16. Thus, the aggregate CapEx planned to be incurred in 2015-16 amounts to ₹997 billion, which showed a decline of 26.7 per cent over that of the previous year, continuing the trend observed since 2011-12 (Table 2). As regards the projects funded through ECBs/ FCCBs, it is observed that a CapEx of ₹212 billion was expected to be spent during 2015-16 based on projects sanctioned prior to 2015-16, and an additional sum of ₹290 billion was likely to be spent on projects sectioned during the year. Thus, aggregate CapEx planned to be incurred in 2015-16 amounted to ₹502 billion, reflecting a reduction of 21.8 per cent compared with that of the previous year (Table 3). 4.3 Envisaged CapEx on projects funded through IPOs/ FPOs/Rights Issues improved As regards the funds raised through IPOs/ Follow on Public Offers (FPOs) /Rights Issues prior to 2015-16 CapEx of ₹7 billion was planned to be utilised in 2015- 16. Additionally, a sum of ₹6 billion was to be spent in 2015-16, from the funds raised during the year. Thus the aggregate CapEx planned to be incurred in 2015-16 from funds raised through this route amounted to ₹13 billion which is nearly double the amount of the previous year (Table 4). 4.4. Envisaged CapEx in aggregate declined sharply Considering the combined figures as indicated in Para 4.1, 4.2 and 4.3, it is estimated that a total CapEx of ₹1,512 billion would have been incurred by the companies in 2015-16. Of this, ₹693 billion was planned to be spent by the companies on the fresh projects in 2015-16. The total CapEx planned to have been spent in the year 2015-16 reflects a sharp decline of 24.7 per cent over the previous year. The corresponding decline in the year 2014-15 was 25.2 per cent (Table 5). 5. Finances through Private Placements, FDI and other sources rise further Over the last several years, private corporates are also utilising sources other than the ones covered above for project finances including private placement of debt and FDI. Data on the mobilisation of funds through private placement of debt during the last five years shows an upward trend since 2013-14. Projects funded through private placements of debts in 2015-16 stood at ₹1,175 billion, reflecting an increase of 20.6 per cent over the previous year (Table 6).
The total FDI inflows in equity, re-invested earnings and other capital aggregated US$ 55 billion in 2015-16 indicating an increase of 23 per cent over the previous year. FDI inflows has risen continuously since 2012-13 (Table 7). However, the investment intentions of companies raising funds exclusively through private placements of debenture/ bonds, FDI or funding through other internal sources have not been considered as information on their end-use and the spending pattern over the years is not readily available. 6. Outlook on Investment for 2016-17 As per the methodology indicated in this article, envisaged CapEx in 2016-17 would be the summation of pipeline expenditure on the projects, which were taken up prior to that year and the new capital spending proposals expected to come up in the year 2016-17. Accordingly, the CapEx planned for 2016-17 amounted to ₹674 billion (₹535 billion from projects financed by banks/FIs, ₹108 billion from drawals from ECBs/ FCCBs and ₹31 billion from funds raised through Domestic Equity Issues), if the companies stick to their investment plans. In order to maintain the level of CapEx envisaged in 2015-16, a CapEx of ₹838 billion would have to come from new investment intentions of the private corporate sector in 2016-17. Although, uncertainty about the revival of the demand cycle would weigh on the investment decisions by the private corporates, the efforts made by the Government in improving ease of doing business in India may have a positive impact. Improvement in the performance of the corporate sector including its leverage gives reasons to be optimistic for the year ahead (RBI Financial Stability Report, June 2016). Moreover, progress in clearance of stalled projects and revival of government projects during 2015-16, as revealed from CMIE database, may increase the confidence of investors. High value projects financed by banks witnessed a repeated decline in the past few years and the same trend may be expected to continue for a couple of quarters. Due to the cleaning up of the balance sheets undertaken by banks, they may not be able to lend aggressively in near future. However, corporates may still be able to raise funds from rest of the sources (including domestic and foreign capital market) at reasonable rates if the economic environment is conducive. New policy initiatives by the government on FDI is expected to strengthen the recent trend of higher FDI inflows across the sectors. High value spectrum auction recently announced by the Government is likely to attract large investment in ‘Telecommunication’ industry. It is being opined that the pay revision of government employees may revive domestic demand, which may accelerate the growth momentum. Further, adequate monsoon is expected to boost the agricultural production and raise rural demand. These factors may help in turning around the investment outlook in the near future.
* Prepared in the Corporate Studies Division of the Department of Statistics and Information Management, Reserve Bank of India. The previous study titled ‘Corporate Investment: Growth in 2014-15 and Prospects for 2015-16’ was published in the September 2015 issue of the Reserve Bank of India Bulletin. ** All public sector banks, major private sector and foreign banks, those who deploy a sizable portion of their credit limits for the purpose of funding of projects of private corporate sector and FIs who are actively involved in project financing namely Infrastructure Development Finance Company (IDFC), Industrial Financial Corporation of India (IFCI), Life Insurance Corporation (LIC), Power Finance Corporation (PFC), Rural Electrification Corporation Of India (REC) and Export-Import Bank of India. |
|||||||||||||||||||||||||||||||||||||||||||||||||||||||||||||||||||||||||||||||||||||||||||||||||||||||||||||||||||||||||||||||||||||||||||||||||||||||||||||||||||||||||||||||||||||||||||||||||||||||||||||||||||||||||||||||||||||||||||||||||||||||||||||||||||||||||||||||||||||||||||||||||||||||||||||||||||||||||||||||||||||||||||||||||||||||||||||||||||||||||||||||||||||||||||||||||||||||||||||||||||||||||||||||||||||||||||||||||||||||||||||||||||||||||||||||||||||||||||||

Share this page:


بھارت موبائل ایپلی کیشن کے ریزرو بینک کو انسٹال کریں اور تازہ ترین خبروں تک فوری رسائی حاصل کریں!


