 IST,
IST,


State of the Economy
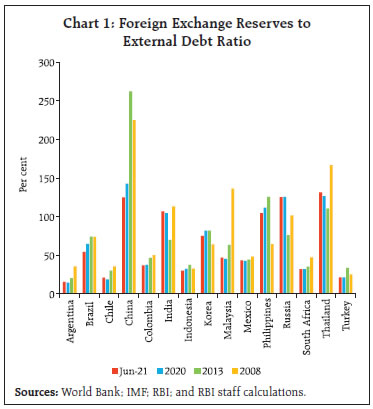
The global economic outlook remains shrouded in uncertainty, with headwinds from multiple fronts. In India, the recovery gained strength, though the speed and pace of improvement remains uneven across different sectors of the economy. Indicators of aggregate demand posit a brighter near-term outlook than before. On the supply side, the Rabi season has set in early on a positive note on the back of a record Kharif harvest and manufacturing is showing improvement in overall operating conditions, while services are in strong expansion mode. Overall monetary and credit conditions stay conducive for a durable economic recovery to take root. Introduction Since the last print of this article in October 2021, the economy is gradually healing amidst an uncertain and volatile global environment, battered by supply chain and logistics disruptions, inflation shocks and geo-political tensions. Incoming high frequency indicators show that the recovery is taking hold in several spheres, though some others are still lagging behind. With the gradual uptick in confidence, mobility indicators have edged up. The job market is exhibiting signs of ebullience on the back of uptick in business optimism and faster pace of vaccination. India’s merchandise exports have staged a smart turnaround, with surging double digit growth for the eighth consecutive month in a row. Collections under the goods and services tax (GST) have marked their second highest level in October since its introduction on the back of better tax administration and ongoing economic recovery. The issuance of e-way bills has been the highest in their history, which bodes well for GST collections going forward. After exhibiting moderation in the month of September 2021, power consumption has registered an uptick despite supply side constraints. The headline manufacturing purchasing managers’ index (PMI) recorded expansion for the fourth consecutive month in October with anticipation of an improvement in demand conditions. The services sector is convalescing with the headline PMI rising to a decadal high in the same month. With attractive offers by developers amidst the festival season, property registrations have also surged. Supported by the decadal low interest rates, softening inflation and a modest current account surplus, the Indian economy is poised to regain the ground lost to the pandemic and re-emerge as among the fastest growing countries in the world. Set against this backdrop, the remainder of the article is structured into five sections. Section II sketches the rapidly evolving developments in the global economy. The evolution of the domestic economy is laid out in Section III. Section IV evaluates the domestic financial conditions, while the last Section sets out concluding remarks. Global economic activity is shedding momentum with supply chain disruptions turning more protracted than previously anticipated. Lockdowns, labour shortages, disruptions to logistics networks, and capacity constraints have resulted in big increases in freight costs and delivery times. As shown by the IHS Markit suppliers’ delivery times index, delivery times in the US and the European Union (EU) have hit record highs since late 2020 (Chart 1). Supply constraints across sectors and economies have exacerbated the surge in energy prices and inflation risks, propelling more central banks to resort to policy normalisation, even as the global recovery remains uneven and frail. In addition, a widening vaccine divide amidst slow inoculation rates has kept most developing countries on the back foot, accentuating the risks of a delayed turnaround in the global economy (Chart 2a). With this prolonged health crisis, most emerging market economies (EMEs) will likely bear lasting scars of the pandemic, undermining their growth rates which were already exhibiting a downtrend following the rebound from the global financial crisis (Chart 2b). 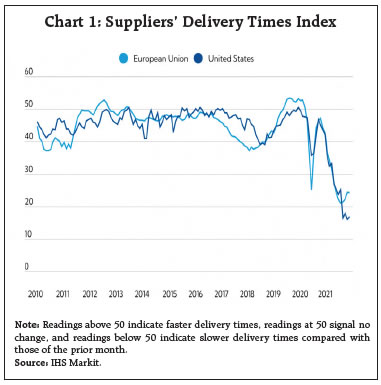 US GDP growth nosedived to 2.0 per cent (q-o-q, SAAR1) in Q3:2021 from 6.7 per cent in Q2. Resurgence in infections together with supply shortages weighed heavily on consumption and production activity, while fall in government assistance payout, residential fixed investment and exports added further to the downside. For China, growth momentum lost its pace in Q3, with the economy expanding at 4.9 per cent (y-o-y) vis-a-vis 7.9 per cent in Q2 as factory activity took a major hit amidst multiple headwinds. The Euro area, unlike its peers, sustained the recovery in Q3, growing by 9.1 per cent (q-o-q, SAAR) on top of 8.7 per cent in Q2, primarily on the back of strong domestic demand and exports. The global composite PMI accelerated to a three-month high in October with stronger upturn in services sector offsetting weaker expansion in manufacturing activity. Services activity strengthened across business, consumers and financial categories, underpinned by strong new order intakes. Growth in manufacturing, on the other hand, remained subdued amidst substantial input shortages, rising cost inflation and stalling export trade (Chart 3). 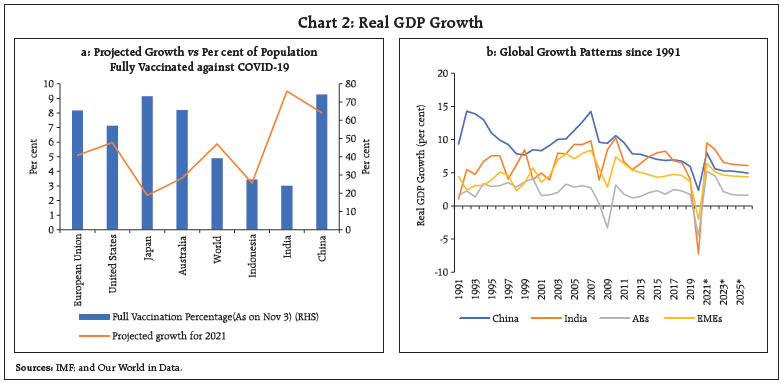 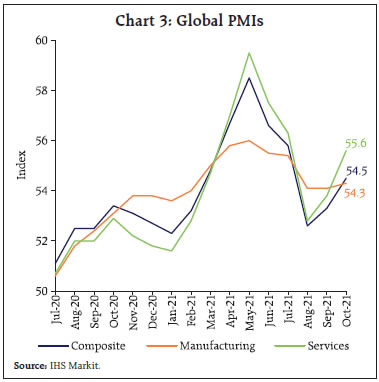 The United Nations Conference on Trade and Development (UNCTAD) in its October release, highlighted that the global trade exhibited a strong recovery in H1:2021, surpassing its pre-pandemic level of 2019 and is likely to sustain the growth in H2:2021. Accordingly, it projects the global trade value in 2021 to be about 20 per cent and 28 per cent higher than what was recorded in 2019 and 2020, respectively. The trade recovery, however, remains uneven with smaller economies struggling to catch up with the pace of exports growth in their larger counterparts. On average, goods exports of smaller economies are still 25 per cent below pre-pandemic levels. Granular data for monthly merchandise trade volume indicate that y-o-y growth decelerated for the fourth consecutive month in August, albeit at a slower pace, as monthly momentum turned positive post its decline in July (Chart 4a). The Baltic Dry Index, a measure of shipping charges for dry bulk commodities, scaled a 13-year high in early October, before sliding sharply by almost 50 per cent in November so far, following losses in large and medium-sized vessel segments (Chart 4b). The Bloomberg commodity price index maintained its uptrend in October, primarily mirroring soaring energy prices before exhibiting some corrections in November so far (Chart 5a). The World Bank’s October edition of the Commodity Markets Outlook estimated average energy prices in 2021 to be 80 per cent higher than in 2020, and to remain elevated through at least the first half of 2022. Spurred by robust demand recovery and the early onset of winter, Brent crude oil price [nearly] hit a three-year high in October as persistent shortfall in supply amidst surging demand kept the oil market tight (Chart 5b). With the Organization of the Petroleum Exporting Countries (OPEC) plus sticking to its plan of gradual, monthly production increases of 400,000 barrels per day, crude prices extended gains in November. Also driving up the prices is a switch to crude oil from natural gas and coal for power generation as prices of the latter skyrocketed in recent months due to worsening supply crunch in Europe and Asia (Chart 5c). Coal and gas price rally, however, cooled off since end-October amidst improving supply conditions. Gold prices firmed up since October, though with sporadic instances of corrections, recouping its September losses mostly on safe haven demand (Chart 5d). Base metal prices, on the other hand, traded lower since mid-October on easing demand and supply worries following the signs of China’s slowdown and its intervention to limit coal price rally (Chart 5e). Food price index rose for the third consecutive month in October, marking its highest level since July 2011, primarily led by scaling vegetable oil and cereal prices (Chart 5f). 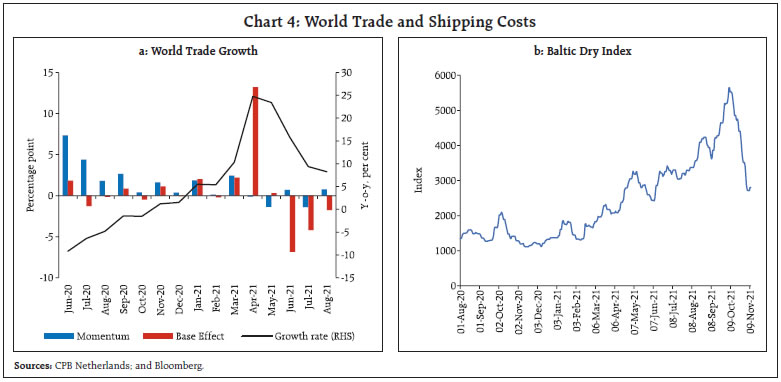 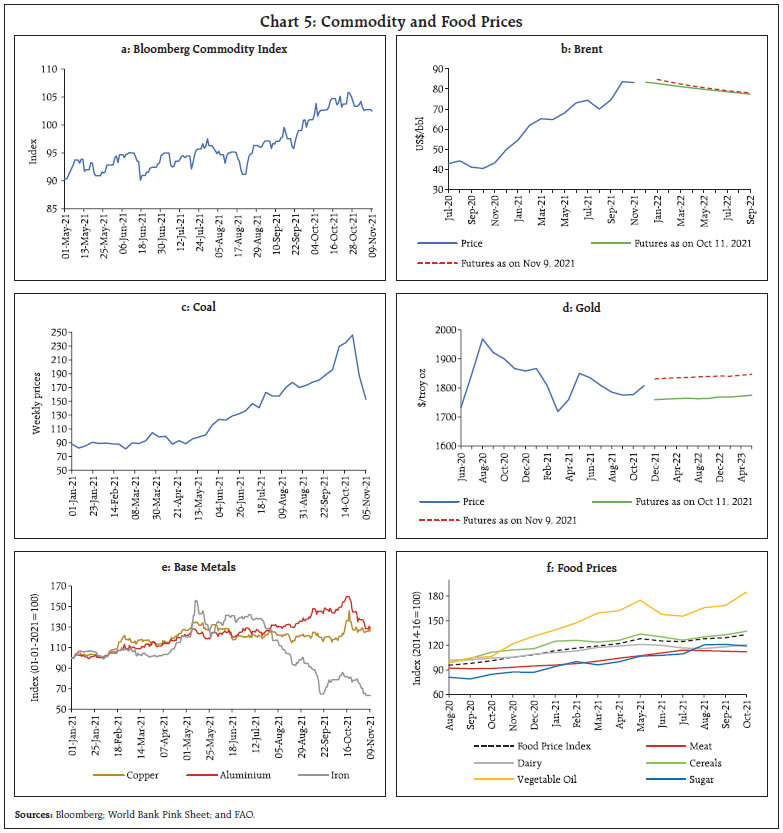 The surge in energy prices is emblematic partly of supply chain disruptions and partly of structural bottlenecks. Surging energy prices have caused a spike in inflation in many countries, though many consider it transient as supply adjusts to the demand when economies open up fully. This has ignited a spate of sell-offs in equities, particularly in the EU as inflation fears are on the rise, pushing bond yields higher. Extreme volatility in energy markets may persist unless investment in clean power is tripled in the next decade. As per the latest estimate by the International Energy Agency (IEA, World Energy Outlook, October 2021), investment in oil and gas is aligned with the target for net zero emissions by 2050 but spending on renewable power is only a third of the future requirement. In this backdrop, green finance instruments have a key role to play in mobilising private capital to tackle climate change. Accordingly, issuance of green bonds has been picking up across jurisdictions (Chart 6). Inflation continues to ratchet up across advanced and some emerging market economies. Mirroring the multi-decade high inflation prints in some of the major constituent economies, headline inflation in the Euro area shot up to 4.1 per cent in October, driven by high energy costs and tax hikes. In the US, CPI inflation jumped to a 31-year high of 6.2 per cent in October, while Fed’s preferred measure of inflation [measured by the personal consumption expenditure (PCE) price index data] continued to rule at a 30-year high and edging up to 4.4 per cent in September, as energy and food prices continue to spiral. In the UK, however, inflation eased marginally to 3.1 per cent in September mainly due to a favourable base effect (Chart 7a). Among major BRICS economies, inflation in Russia continued its upward trajectory, climbing to 8.1 per cent in October, its highest level since January 2016. In Brazil, inflation inched up further to 10.7 per cent in October, staying in double digits for second consecutive month. In China, consumer price inflation, after easing for four successive months, increased to 1.5 per cent in October primarily due to rising cost of non-food items, while producer price inflation continued to mount, hitting a 26 year high amidst soaring raw material costs (Chart 7b).  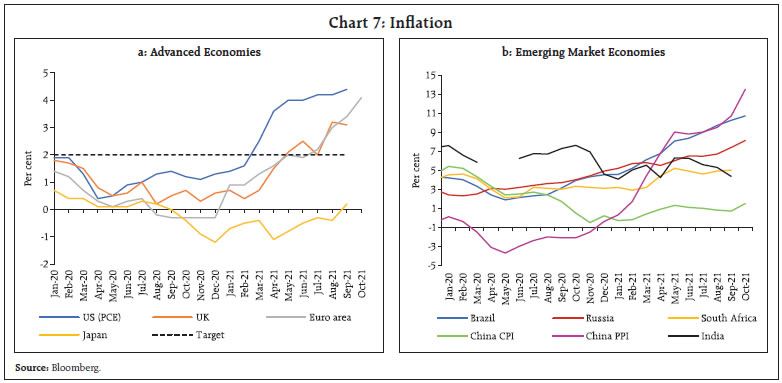 Financial markets remained on tenterhooks amidst heightened uncertainty and accentuated risks. Following a weak start, stock markets in advanced economies (AEs) regained momentum through the rest of October posting net gains for the month which extended into November so far. (Chart 8a). Underpinned by upbeat corporate earnings results, the US S&P 500 rallied hitting fresh peaks in November. EME stock indices, on the other hand, continued to lag, primarily reflecting China’s slowdown and other country-specific factors. The US 10-year bond yields hit a high of 1.7 per cent in mid-October before retreating subsequently. Short-term yields, however, being more sensitive to interest rate expectations, leaped faster, flattening the yield curve across most economies (Chart 8b). The US dollar remained largely range-bound amidst mixed incoming data for the economy (Chart 8c). EME currencies strengthened since the latter part of October in part due to renewed capital inflows (Chart 8d). On the policy front, a distinct shift towards unwinding of pandemic-led stimulus is taking hold as inflation worries are rumbling more clearly than before (Chart 9a). The US Fed, in its November meeting, announced the tapering of its asset purchases at a pace of US$ 15 billion per month beginning mid-November. From the current pace of monthly purchase of US$ 80 billion of Treasury securities and US$ 40 billion of agency mortgage-backed securities (MBS), the taper will be of US$ 10 billion in Treasury securities and US$ 5 billion in agency MBS. The Bank of Canada in its October meeting left its policy rate unchanged but ended its weekly bond-buying programme of C$ 2 billion. The Reserve Bank of Australia also dumped its policy of yield curve control as a signal to act against a post-pandemic surge in prices. The Monetary Authority of Singapore tightened its monetary policy by allowing the Singapore dollar (S$), in nominal effective terms, to appreciate mildly, while the Czech Republic effected its fourth rate hike at a much higher magnitude of 125 basis points (bps) (Chart 9b). The European Central Bank (ECB), on the other hand, held on to its accommodative policy stance in October, while continuing with asset purchases at a moderately lower pace in Q4 than Q2 and Q3, as was decided in its September meeting. The Bank of England too, kept its policy rate and asset purchase programme unchanged in its November meeting, confounding market expectations of a rate hike. Among the EMEs, Brazil remains the most hawkish central bank, raising its policy rate for the sixth time since March and at a much higher magnitude of 150 bps – the highest hike in almost 20 years – taking the total cumulative increase in 2021 to 575 bps. Russia too, effected its sixth consecutive rate hike but at a lesser magnitude of 75 bps, for a cumulative increase of 325 bps in 2021. Among other EMEs, Hungary raised rates by 15 bps, its fifth consecutive hike in 2021, while Chile effected its third consecutive rate hike at a higher magnitude of 125 bps in October. Poland increased rate for the second consecutive month in November by 75 bps. In a sharp departure, Turkey cut its policy rate by 200 bps, its second rate cut in a row, which took the total cumulative rate change for the year to (-)100 bps. 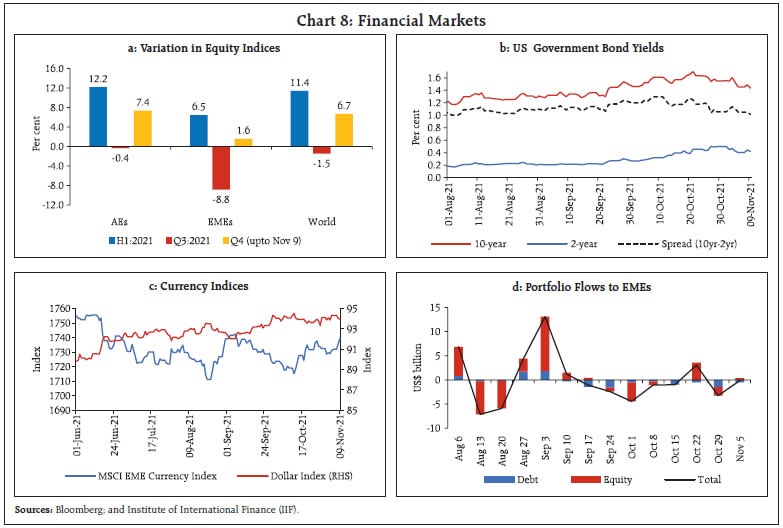 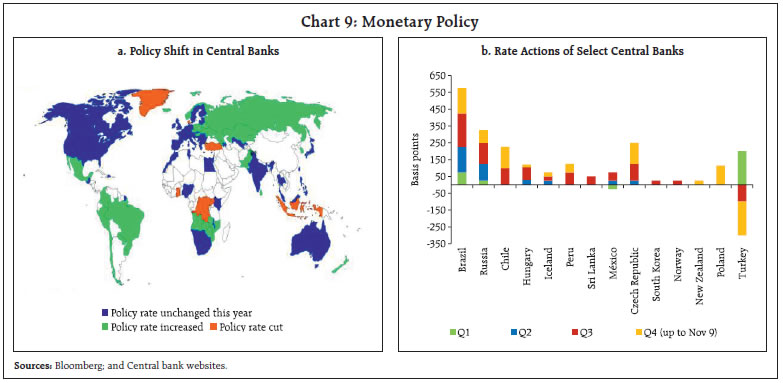 Global economic outlook remains shrouded in uncertainty with headwinds stemming from multiple fronts corralling together at a time when many economies are still struggling and are at nascent stage of their recovery. Growing likelihood of policy normalisation by major central banks to quell fast rising inflation may tighten financial conditions and stutter the ongoing growth impulses. India stands resolute in its quest for speedy revival, though the speed and pace of recovery remains uneven across different sectors of the economy. The outlook remains overcast by the future course of pandemic and global supply disruptions. The domestic situation seems to have brightened on the back of considerable dip in fresh infections and rapid progress in inoculations. An important milestone was struck on October 21, 2021 as the total number of vaccines administered crossed the 100-crore mark. With over 31 per cent of the adult population fully vaccinated, the 7-day moving average (MA) for vaccination by the close of October stood well above 60 lakhs. The 7-day moving average of daily new cases plummeted to 11,491 on November 10, 2021 from 19,938 a month ago. The active cases comprise just 0.41 per cent of total infections, the lowest ever since March 2020, while the national COVID-19 recovery rate was marked at 98.25 per cent (Chart 10a and 10b). 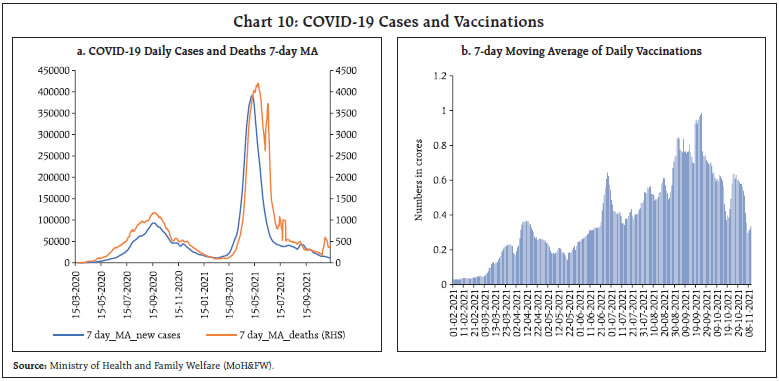 With the onset of the festival season, Google and Apple mobility indices recorded a marked improvement during October-November. Google mobility index for retail and recreation activities normalised for the first time since the onset of the pandemic, and mobility around grocery and pharmacy, parks and transit stations surged beyond the pre-pandemic baseline. Apple mobility index, also remained elevated propelled by an increase in activity across all major cities (Chart 11a and 11b). Electricity generation in the first ten days of November remained comparable to those recorded a year ago as well as over pre-pandemic November 2019 (Chart 11c). According to the Central Electricity Authority, the coal stocks at thermal power plants in the country have improved to seven days (November 8, 2021) as compared with four days a fortnight ago. The average daily stock at these plants has increased to 13.28 million tonnes as compared with 7.3 million tonnes on October 10, 2021. This has led to a softening of electricity spot prices on the India Energy Exchange (IEX) (Chart 12). 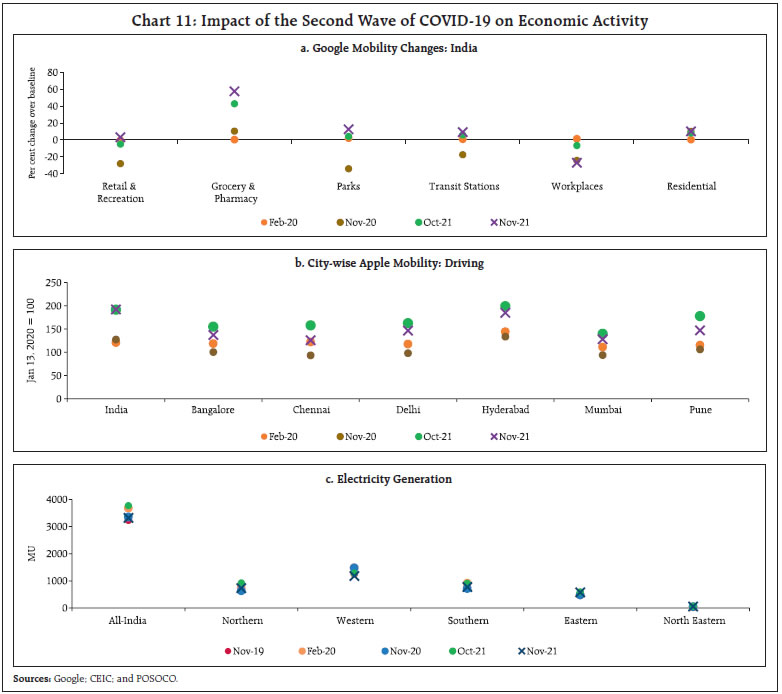 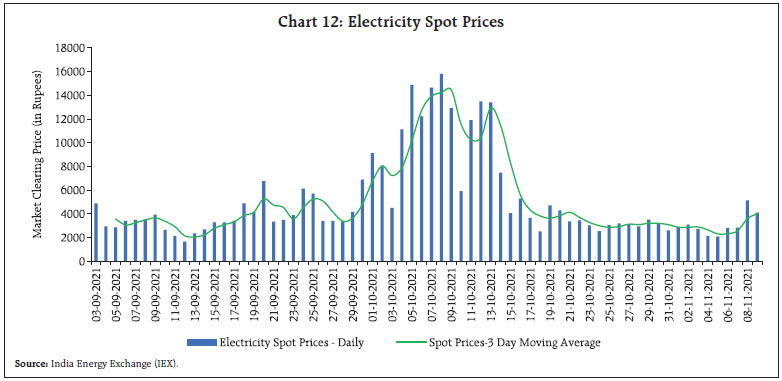 Aggregate Demand The indicators of aggregate demand posit an improvement in several spheres. Mirroring the improved economic activity and movement of goods transport, the E-way bill generation in October 2021 surpassed the pre-pandemic levels of February 2020 and posted a sequential improvement (Chart 13a). Mimicking the above trend, toll collections were up sharply by 75.1 per cent y-o-y in October 2021 (Chart 13b). The outcome of improved mobility - both passenger and goods - was reflected in a surge in fuel consumption in October. The consumption of petrol touched the pre-pandemic levels, while aviation turbine fuel (ATF) and diesel consumption exhibited sequential improvement (Chart 14a). 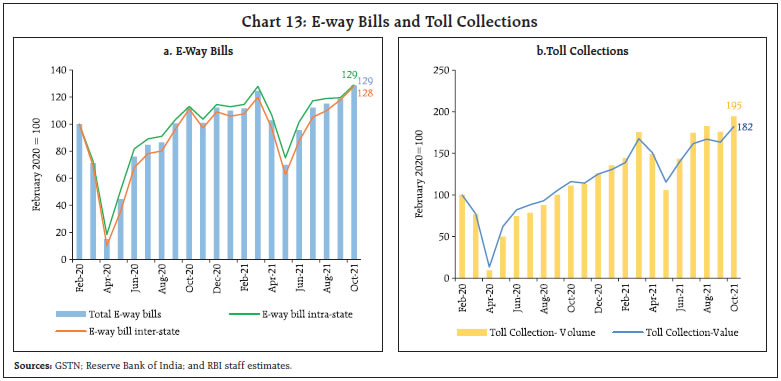 The global supply disruptions weighed on the domestic automobile sector, which continues to reel under supply shortages of semiconductor chips in October. The supply bottlenecks thwarted festival season sales, and in sync, retail sales of motor vehicles and vehicle registrations moderated. The decline in registrations was led by non-transport vehicles even as demand for transport vehicles improved on a y-o-y basis (Chart 14c). Within the vehicles segment, tractor sales remained the lone bright spot with a robust growth of 8.2 per cent (over October 2019) in October. Sales of two-wheelers and motorcycles remained buoyant on a sequential basis (Chart 14d). Turning to the services sector, railways freight traffic registered a growth of 8.4 per cent y-o-y on top of a high base of 15.4 per cent growth recorded a year ago (Chart 15a). Notwithstanding shipping hurdles and container shortages globally, port traffic manifested a sequential improvement in October (Chart 15b). The construction sector is yet to catch up with its February 2020 levels as both steel consumption and cement production trailed below the baseline. Over the corresponding pre-pandemic month in 2019, however, cement production posted a robust growth while steel consumption growth stayed modest (Chart 16). The aviation sector - both passenger and cargo traffic - has picked up since August 2021, with the cargo segment outperforming passenger traffic. 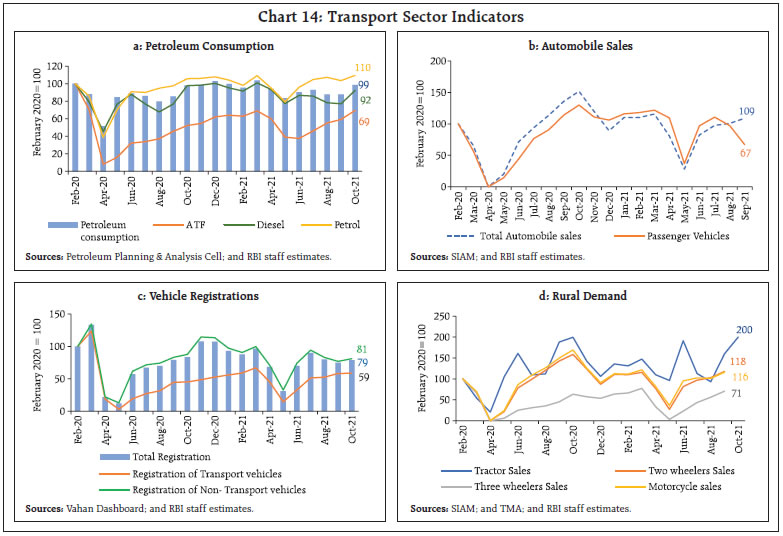 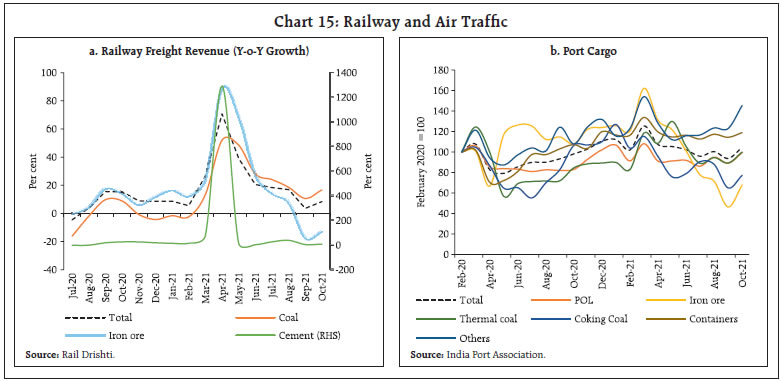 In November, daily domestic airport footfalls2, averaged 5.5 lakh per day during the first nine days, an increase of 18.3 per cent over the corresponding period in October. International airport footfalls also improved by 8.9 per cent m-o-m. Riding on the back of the festival season, sales of fast-moving consumer goods (FMCG) surged through October 2021. As per the household survey of the Centre for Monitoring Indian Economy (CMIE), labour participation rate stayed resilient at 40.41 per cent in October, marginally moderating from 40.66 per cent in September (12 month high). Unemployment rate worsened marginally to 7.8 per cent from 6.9 per cent a month ago (Chart 17). 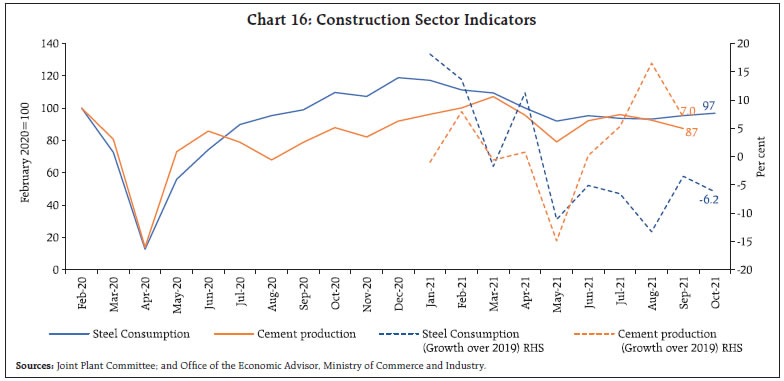 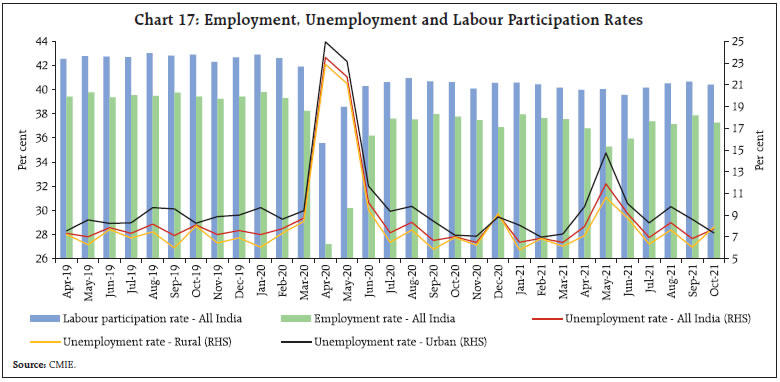 Organised sector labour market data, as captured by the Employees’ Provident Fund Organisation (EPFO) and the Employees’ State Insurance Corporation (ESIC), present a mixed picture (Chart 18). As per CMIE’s employment statistics, the labour market recovery is almost complete with the number of workers employed in September-October approaching the levels seen in 2019 (Chart 19). The employment segment of the PMI released by the IHS Markit portrays a mixed picture across manufacturing and services sectors. Employment in the manufacturing sector contracted marginally, while that in the services sector strengthened further to 51.5 in October 2021 from 50.4 in September (Chart 20). 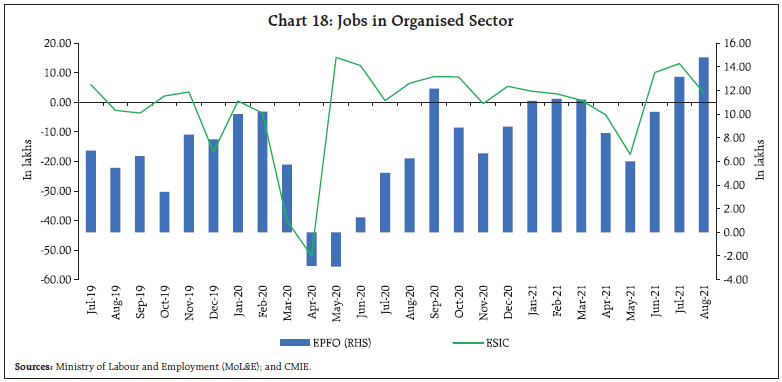 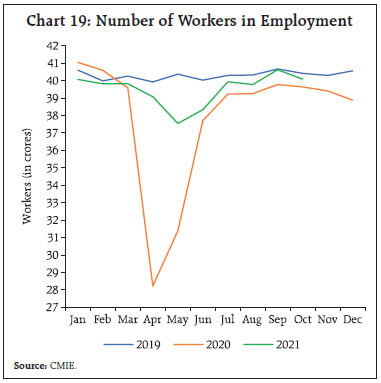 India’s merchandise exports of US$ 35.5 billion posted a sharp rebound by 42.3 per cent y-o-y in October 2021. During April-October 2021, merchandise exports were 54.5 per cent higher over the same period a year ago and 25.5 per cent higher over the pre-COVID period (Chart 21a and 21b). 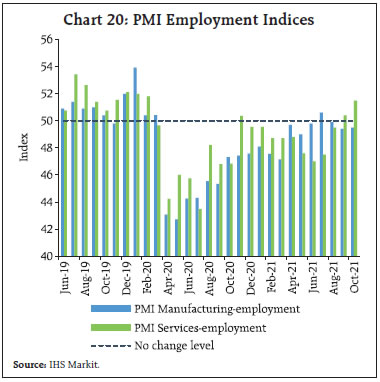 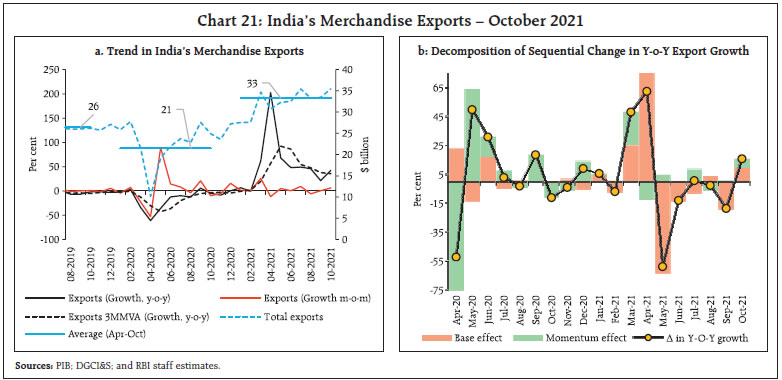 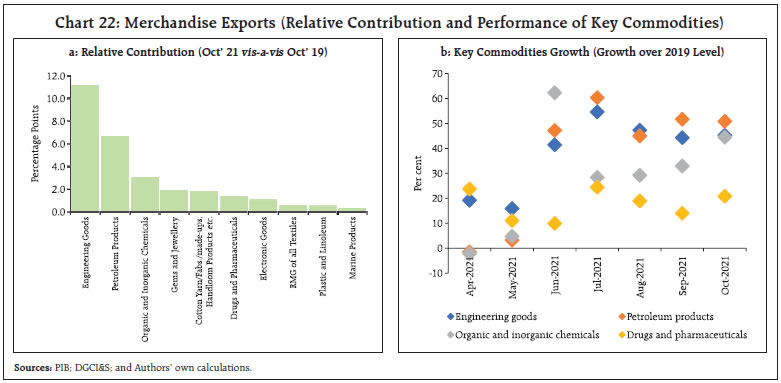 Export growth remained broad-based as all ten major commodity groups accounting for more than 80 per cent of exports recorded an expansion above their pre-COVID levels (Chart 22a). The buoyant external demand for engineering goods, petroleum products and chemicals bolstered export growth (Chart 22b). Engineering goods exports crossed the US$ 9 billion mark for the fifth consecutive month in October 2021, supported by record exports of automotive products (Chart 23). India resumed the supply of COVID-19 vaccines to Nepal, Bangladesh, Myanmar and Iran and plans to supply 20 million doses to the GAVI3 and the COVAX alliance by year-end. At G20 summit, India announced to supply 5 billion COVID vaccine doses by 2022. Thus, pharma exports are slated to receive a major boost. 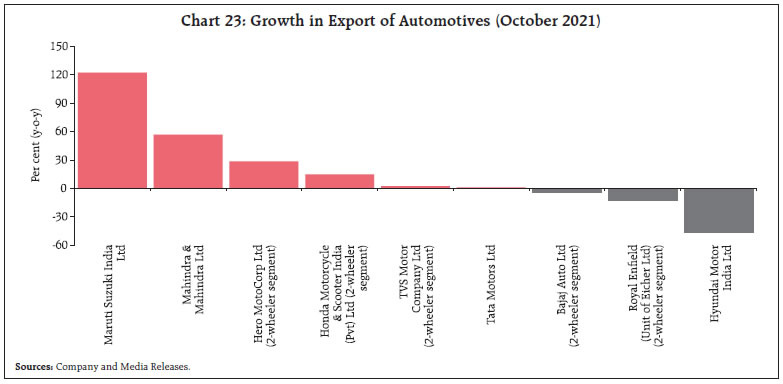 The UNCTAD, in its latest estimates, pegged export value in ocean-based industries4 at US$ 2.5 trillion. The time is opportune for India to expand its marine exports. At present, marine exports constitute only around 2 per cent of India’s total exports. With the natural competitive advantage of having one of the longest coastlines suitable for fishing, India needs to seize the opportunity in the ocean economy. Moreover, India’s marine exports have shown strong growth momentum in October. India’s textile exports have recorded double-digit growth for the last two months over the pre-pandemic level. As per the Confederation of Indian Industry (CII)’s analysis, textile industry is set to grow to US$ 65 billion by 2026 from US$ 36 billion in 2019. The Government’s approval to set up seven mega integrated textile region and apparel parks (PM-MITRA) in the next five years bodes well for textiles exports. India’s merchandise imports remained above US$ 55 billion for the second consecutive month, reflecting a strong underlying momentum in domestic economic activity (Chart 24a and 24b). Merchandise imports were 78.7 per cent higher in April-October 2021 over a year ago and 15.8 per cent higher than the pre-pandemic level. Robust import demand was powered by petroleum products, gold, electronic products and coal (Chart 25). All ten major commodity groups comprising more than three-fourth of imports recorded an expansion over the pre-COVID level, reflecting broad-based uptick in domestic demand. The record imports of electronic goods for the second consecutive month reflects strong domestic demand, driven by ongoing mega sales organised by major e-commerce companies amidst the festival season. The purchase of coal, coke and briquettes has increased significantly from its pre-COVID level, given the low level of domestic coal-stock positions (Chart 26a). The non-oil non-gold imports exhibited a resounding growth for the fifth consecutive month (Chart 26b). 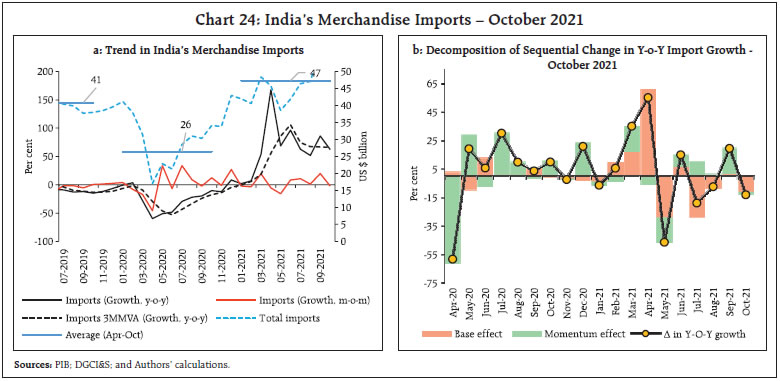 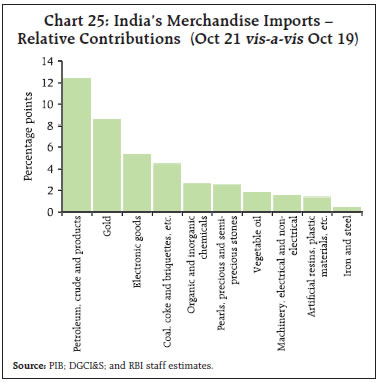 India’s services exports recorded double digit growth for the seventh consecutive month in September 2021, largely driven by stronger revenues of major IT companies securing large overseas deals amidst robust global demand for their digital transformation offerings and core software services. Provisional data suggest that net services exports at US$ 8.5 billion in September 2021 were 17.8 per cent up from the level a year ago. Fiscal position for H1:2021-22 indicates that buoyant tax revenues helped to contain the Centre’s fiscal deficit at 35.0 per cent of budget estimates (BE), even while incurring higher expenditure (Chart 27). Tax revenues improved across the board, with direct taxes marking a growth of 83.7 per cent over 2020-21 and indirect taxes rising by 48.4 per cent during the period (Chart 28).5 On the disinvestment front, receipts have improved vis-à-vis 2020-21, but are still short of 2019-20 levels. Although only 5.2 per cent of the budgeted disinvestment target of ₹1.75 lakh crore has been achieved so far, the sale of Air India has marked a turning point in the disinvestment programme of the government. The GST collections (Centre plus states) hit a growth of 23.7 per cent y-o-y to reach ₹1.3 lakh crore in October, the second highest since the introduction of GST (Chart 29). During the month, revenues from import of goods were 39 per cent higher and the revenues from domestic transactions (including import of services) were 19 per cent higher compared with a year ago. The comfortable revenue position of the government has enabled it to incur higher expenditure – both capital and revenue expenditure accelerated by 38.3 per cent and 6.3 per cent over 2020-21, respectively.6 The growth in capital expenditure was led by the Ministry of Road Transport and Highways, which has exhausted 68.2 per cent of its budgeted capital expenditure for 2021-22 (Chart 30). The upbeat fiscal scenario has also enabled the Centre to slash excise duty on fuel. 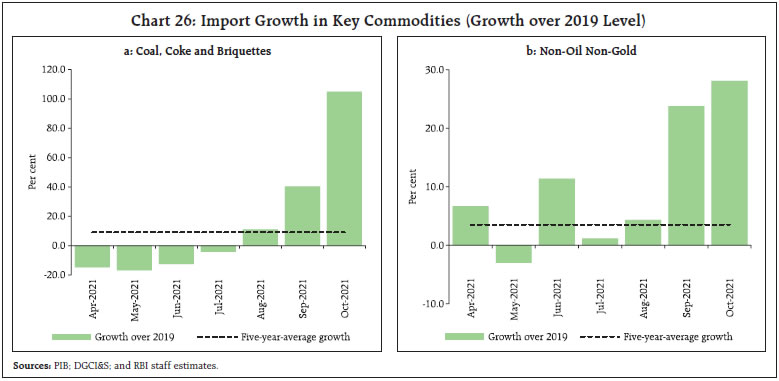 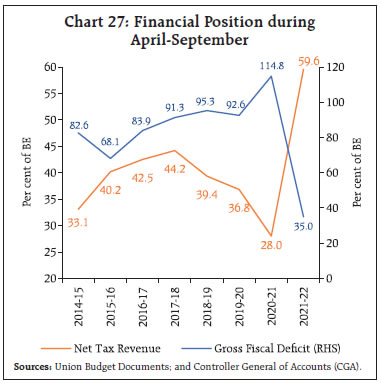 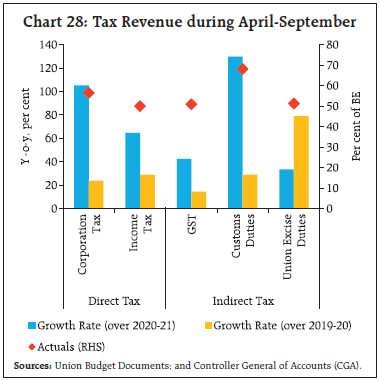 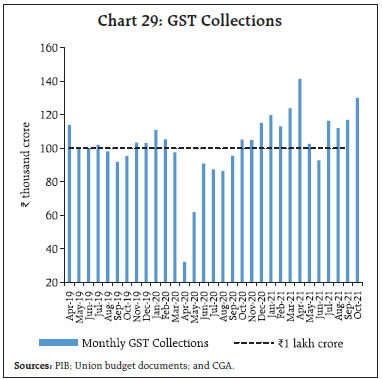  The quality of expenditure has improved, with the revenue expenditure to capital outlay ratio (RECO) showing a marked improvement in H1:2021-22 relative to its trend level (Chart 31). States’ capital expenditure has also surged during April-August, spurred by an impressive growth in tax revenues. States’ revenue position is expected to improve further with the release of ₹44,000 crore on October 28 by the Centre, under the back-to-back loan facility in lieu of GST compensation cess. With this, the Centre has transferred the entire amount of ₹1.59 lakh crore that was to be released to states in 2021-22 on a back-to-back loan basis, without resorting to additional borrowing. Combined with the compensation based on actual cess collection (estimated at more than ₹1 lakh crore for 2021-22), the total GST compensation to states is expected to be around ₹2.59 lakh crore in 2021-22. 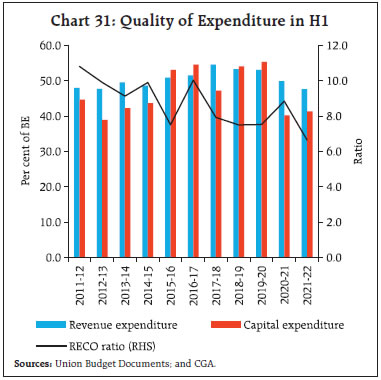 During April-August 2021, there has been a robust growth in both own tax revenue and own non-tax revenue receipts of the states as compared with the same period a year ago (Chart 32).7 As the Central government is comfortably placed to achieve its tax revenue collection target for 2021-22 (Chart 33), it is expected that the higher mop-up of the central government tax revenue will translate into higher tax devolution to states in H2:2021-22.8 This may cushion states’ fiscal position and conveniently place them towards achieving their budgeted fiscal deficit target. Following the Central government’s reduction in excise duties, the majority of the states and UTs have also reduced their value added tax (VAT) in the range of ₹1.8 to ₹10.0 per litre in petrol and ₹2.0 to ₹7.0 per litre in diesel. Overall, the decrease in petrol and diesel prices may positively impact consumption and private investment.   Aggregate Supply Record horticulture crops production9 during 2020-21 is expected to bolster the availability of vegetables and fruits. Total horticultural crop production at 331.1 million tonnes (with recent upward revision of 0.4 per cent over the 2nd AE for 2020-21), marked a growth of 3.3 per cent over the final estimates (FE) of 2019-20 (Chart 34). The record production in horticulture crops was led by an increase in area under cultivation by 4.2 per cent over 2019-20. Component wise, the area under onion has exhibited the highest growth of 14.5 per cent, followed by potato and tomato. Vegetable production expanded by 4.8 per cent over 2019-20 (FE), led by a sharp increase in production of all the three key vegetables – potato (11.7 per cent), onion (2.8 per cent) and tomato (2.5 percent). The production of fruits also increased by 0.9 per cent. 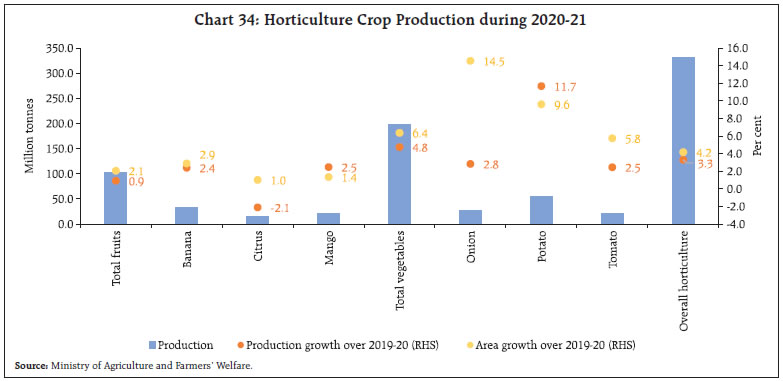 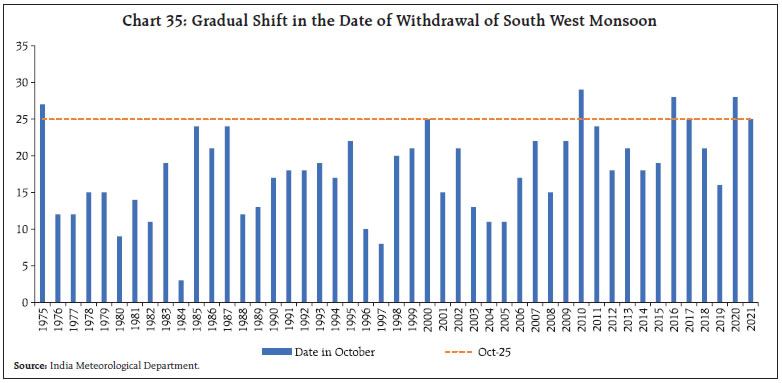 The south-west monsoon (SWM) this year withdrew from the entire country on October 25,2021 the – 7th most delayed monsoon withdrawal since 1975 (Chart 35). Interestingly, five10 out of these seven years of late withdrawal were in the recent decade. Simultaneously, with the setting in of north easterly winds in the lower tropospheric levels, the north-east monsoon (NEM) also commenced with 29 per cent higher rainfall over its long period average (LPA) as on November 9, 2021 (Chart 36a). The delayed withdrawal of the SWM created congenial soil moisture and reservoir water storage conditions, enabling the early start of rabi sowing this year. The rabi crop acreage11 stood at 91.6 lakh hectares as on November 5, 2021, up by 6.3 per cent over its level a year ago on account of higher sowing of oilseeds (mainly rapeseeds and mustard) (Chart 36b). Early start of rabi sowing also seems to explain in part the fall in work demanded under the Mahatma Gandhi National Rural Employment Guarantee Scheme (MGNREGS) by 17.4 per cent y-o-y and 16.9 per cent on m-o-m basis in October 2021 (Chart 36c). In the industrial sector, the headline manufacturing PMI improved to 55.9 in October from 53.7 a month ago, pointing to the strongest improvement in overall operating conditions since February. An improvement in demand and uptick in global sales led firms to scale up production and employ more inputs. PMI services rose sharply to 58.4 in October, from 55.2 in September, signalling the strongest rate of expansion in ten and a half years, on the back of surge in new business. Moreover, Business Expectations Index (BEI) for services that had entered into the contraction zone in July 2021 for the first time in a year, reverted strongly in September-October (Chart 37).  The services sector recorded a strong growth y-o-y as indicated by an improvement in trade, hotels, transport, communication and issuance of e-way bills (Table 1). 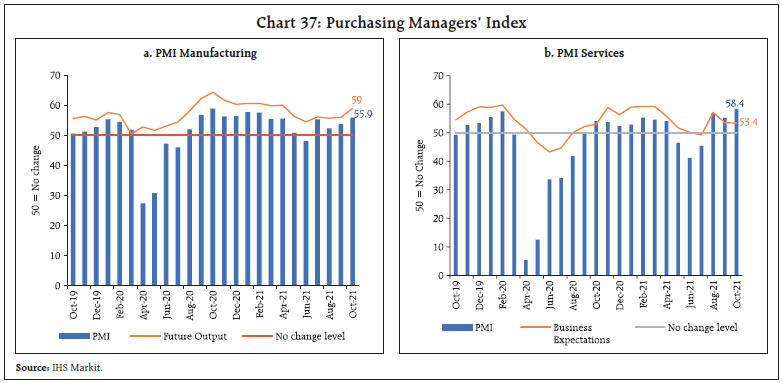 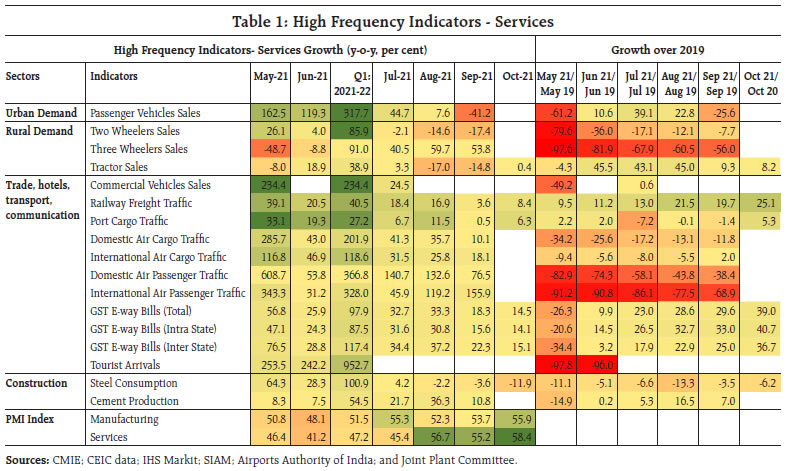 Inflation Headline CPI inflation (year-on-year) for the month of October 2021 edged up to 4.5 per cent from 4.3 per cent a month ago, as per the data released by the National Statistical Office (NSO) on November 12, 2021 (Chart 38). In spite of favourable base effects, a steep rise in price momentum (month-on-month change in prices in the current month) by 141 bps more than offset favourable base effects (month-on-month change in prices a year ago) of 128 bps, resulting in headline inflation increasing by 13 bps between September and October. Food prices drove the sharp pick-up in overall CPI price momentum. Among constituents, food and beverages inflation increased to 1.8 per cent in October from 1.6 per cent in September. Even though the large favourable base effects of 204 bps could have resulted in a substantial decline in food inflation, a spike in vegetable prices pushed up food inflation by 21 bps in October. Prices of cereals moved out of deflation. On the other hand, eggs prices moved into deflation and a softening of inflation was observed in meat and fish, pulses, spices and non-alcoholic beverages. Edible oils inflation, in spite of some moderation, remained elevated. Food (with a weight of 45.86 per cent in the CPI basket) contributed only 19 per cent of headline inflation in October (Chart 38b). Fuel inflation edged up further by 72 bps in October to scale an all-time high inflation rate of 14.3 per cent (in the 2012=100 base year series) (Chart 38a). Increase in LPG and kerosene prices primarily led the pick-up. CPI fuel (weight of 6.84 per cent in the CPI basket) contributed around 20 per cent of headline inflation in October (Chart 38b). CPI inflation excluding food and fuel12 or core inflation remained elevated at 5.9 per cent in October (Chart 38a). While inflation in clothing and footwear, household goods and services, transport and communication and personal care and effects sub-groups increased, inflation in recreation and amusement, and health registered moderation. 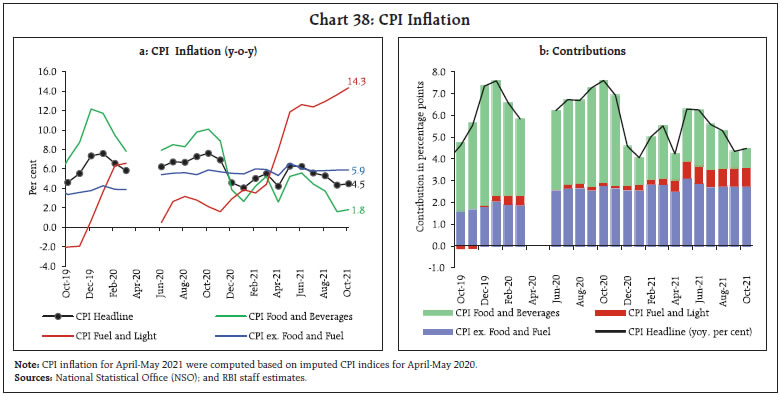 High frequency food price data from the Ministry of Consumer Affairs, Food and Public Distribution (Department of Consumer Affairs) for November so far (November 1-12, 2021) showed an uptick in cereal prices. In case of pulses, masoor and moong prices registered increases, but the price of tur declined. Edible oils prices witnessed mixed movements, with prices of refined edible oils (like sunflower oil) registering a decline. Among key vegetables, prices of tomatoes and onions have seen sharp increases in November so far, with tomato prices inching up higher than levels a year ago (Chart 39). On November 3, 2021 the Central Government announced reduction in excise duties on petrol and diesel by ₹5 per litre and ₹10 per litre, respectively. On November 4, 2021 the average pump prices for petrol in four major metros declined to ₹105.01 per litre (from ₹110.76 per litre on November 3, 2021) and for diesel to ₹90.51 per litre (from ₹102.30 per litre on November 3, 2021). In November so far (November 1-12, 2021), 25 State Governments and UTs have also reduced VATs on petrol and diesel – in the range of around ₹10 per litre to ₹3 per litre in case of petrol and in the range of around ₹9.5 per litre to ₹2 per litre in case of diesel. While kerosene price edged up sharply, LPG prices were kept unchanged in the first half of November (Table 2). Input costs pressures, as reflected in the PMIs, increased across manufacturing and services in October, with cost conditions turning more adverse in manufacturing. The number of services firms that increased selling prices rose in October. Manufacturing firms, on the other hand, registered muted output price increases. 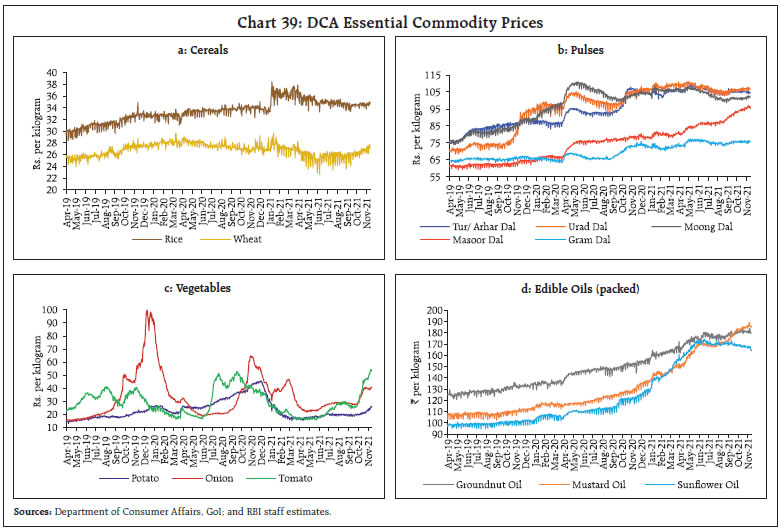 System liquidity remained in large surplus, though average daily net absorption under the liquidity adjustment facility (LAF) moderated from ₹8.1 lakh crore in the first half to ₹7.5 lakh crore in the second half of October 2021 through November 2021 (up to November 10). Amongst the drivers of liquidity, moderation resulted mainly from the build-up of government cash balances and step up in currency in circulation in the wake of the festival season. As the Reserve Bank stepped up liquidity absorption through the variable rate reverse repo (VRRR) auctions (both main and fine-tuning operations), the amount absorbed under the fixed rate repo declined (Chart 40).  Higher cut-offs in the VRRR auctions amidst moderation in surplus liquidity nudged the trajectory of money market rates upwards. The cut-offs for main VRRR auction on October 8, October 22 and November 3 for the enhanced amount of ₹4.0 lakh crore, ₹4.5 lakh crore and ₹5 lakh crore were placed at 3.99 per cent, while the weighted average rate on the accepted bids in these auctions inched up to 3.65 per cent, 3.91 and 3.95 per cent, respectively. Similarly, under the fine-tuning operations conducted on October 20, 26, November 2 and 9, the cut-off rates were placed at 3.95 per cent, 3.99 per cent and 3.95 per cent each, respectively. In its October 8 policy, the Reserve Bank had announced the possibility of complementing the 14-day VRRR with the 28-day VRRR. Accordingly, the Reserve Bank conducted the first 28-day VRRR auction of the year on November 2. This auction elicited warm response as reflected in the bid-cover ratio of 3.4 with the cut-off rate and the weighted average rate standing at 3.97 per cent and 3.95 per cent, respectively. As a result, the weighted average reverse repo rate (for both fixed and variable rate reverse repos) firmed up and stood at 3.80 per cent on November 9, 2021 (Chart 41). 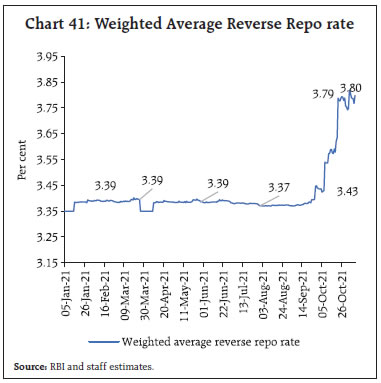 Rates in the overnight segment – the weighted average call rate (WACR), the tri-party repo rate and the market repo rate – hovered around the reverse repo rate with sporadic instances of hardening. In the outer term money market segment, 3-month T-bill rate, certificates of deposit (CDs) and commercial paper - NBFCs (CP-NBFCs) rates hardened in sync with the weighted average reverse repo rate, with their spreads over the reverse repo rate ruling at 17 bps, 27 bps and 81 bps, respectively, during the latter part of October and first half of November (Chart 42). Bond yields extended their hardening bias in October, however, yields trended lower in November in line with softening of the US treasury yields (Chart 43). Positive domestic developments like excise duty cuts with its softening impact on inflation too fuelled the rally in bond market. The 10-year G-sec yield closed at 6.34 per cent on November 10, softening from a peak of 6.39 per cent at end-October. Mirroring the momentum in G-sec yields, corporate bond yields too softened in early November after showing a hardening bias in October 2021 (Chart 44).   The overall monetary and credit conditions remained conducive in support of the economic recovery. Reserve money (RM), excluding the first-round impact of the cash reserve ratio (CRR) restoration, expanded by 9.7 per cent y-o-y as on November 5, 2021 (17.8 per cent a year ago) with currency in circulation - the largest component of RM - growing at a similar pace (20.3 per cent a year ago) (Chart 45). On the other hand, money supply (M3) grew by 9.7 per cent as on October 22, 2021 (11.6 per cent a year ago) on the back of a robust deposit mobilisation by banks. The aggregate deposits increased by 9.9 per cent, while the growth in scheduled commercial banks’ (SCBs’) credit to the commercial sector accelerated to 6.8 per cent (5.2 per cent a year ago). 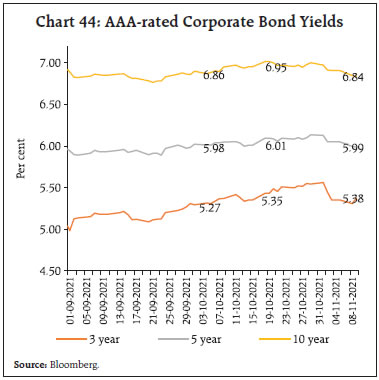 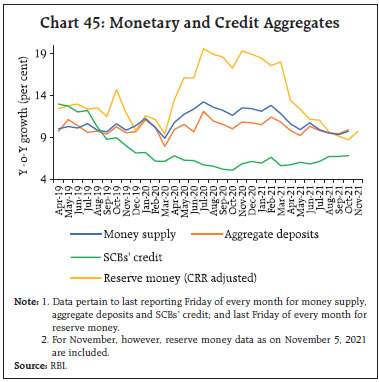 In the credit segment of financial markets, transmission to lending and deposit rates has shown consistent improvement ever since the introduction of the external benchmark system in October 2019. The transmission improved significantly post March 2020 owing to abundant surplus liquidity. The median term deposit rate on fresh deposits13 moderated by 154 bps through March 2020 to October 2021 (Table 3). The asymmetry, however, persists in transmission to deposit rates across tenors with maximum pass-through discernible for shorter tenor deposits of up to 1 year maturity (181 bps) and the least for longer tenor deposits of maturity above 3 years (108 bps). Across domestic banks, private banks have exhibited higher pass-through to term deposit rates compared to their public sector counterparts (Chart 46). 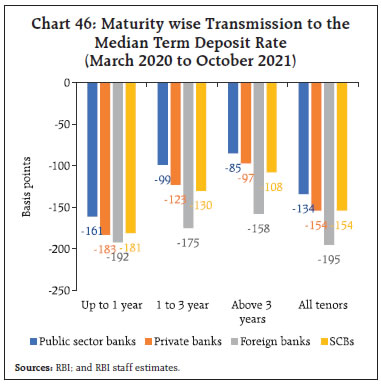 Through March 2020 to October 2021, the one-year median marginal cost of funds-based lending rate (MCLR) of SCBs softened cumulatively by 105 bps. The reduction in the cost of funds for SCBs bodes well for overall transmission to lending rates. Consequently, weighted average lending rates on new loans extended by SCBs eased across sectors like agriculture, industry, commercial real estate, micro small and medium enterprises (MSMEs) and personal loans such as housing and vehicles. The interest rates on housing loans – personal as well as commercial – continue to stay at historical lows, which augurs well for the revival of the housing sector with its attendant backward and forward linkages with the Indian economy14. Consequently, the low interest rates have facilitated the households to reduce their burden of loan servicing. The Indian equity markets scaled record highs multiple times during the first half of October 2021, buoyed by strengthening signs of recovery in economic activity, strong demand outlook ahead of the festive season and the Reserve Bank’s announcement of status quo in its policy repo rate alongside continued accommodative stance of monetary policy (Chart 47). The markets, however, pared some of the gains in the second half of the month amidst accelerated profit bookings following mixed Q2 corporate earnings results and concerns over stretched valuations. Furthermore, weak global cues such as elevated commodity prices and contagion risks of the corporate debt crisis in China also dampened market sentiments. Overall, the BSE Sensex gained 0.3 per cent in October. Markets started on a positive note in November buoyed by signals of rapidly improving economic outlook following expansion of India’s manufacturing and services PMI and increase in GST collections for October 2021. The BSE Sensex has gained 1.8 per cent in November so far (up to 10th). 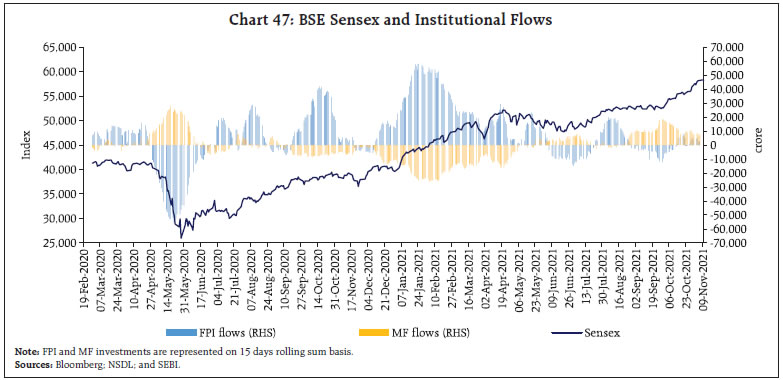 The Indian equity market has outperformed major equity indices in 2021 so far (up to 9th) (Chart 48a). The spectacular gains have raised concerns over overstretched valuations with a number of global financial service firms turning cautious on Indian equities. Traditional valuation metrics like price-to-book value ratio, price-to-earnings ratio and market-capitalisation to GDP ratio stayed above their historical averages. The yield gap (difference between 10-year G-sec yield and 12-month forward earnings yield of BSE Sensex) at 2.47 per cent has far outstripped its historical long-term average of 1.65 per cent, (Chart 48b). 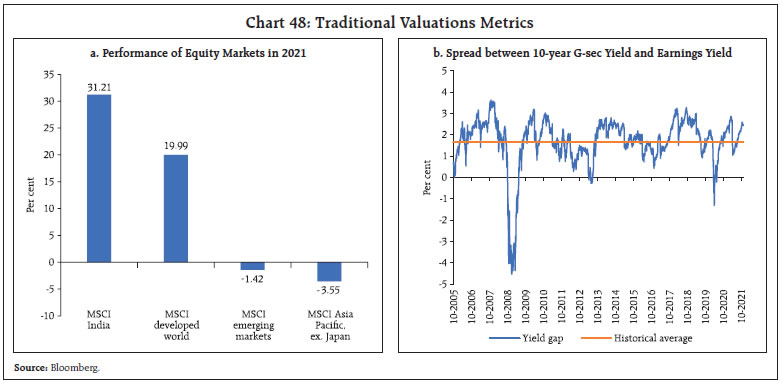 Despite widespread concerns over valuations, it is noteworthy that the percentage holding of private promoters in companies listed on NSE increased by nearly 50 basis points to 44.90 per cent at end-September 2021 from 44.42 per cent at end-June 2021 (Chart 49). Empirical research shows a positive relationship between promoter ownership and firm value (Kumar et al.)15. Steadily increasing promoters’ shareholding reflects confidence on the part of the promoters about their business prospects and comfort with ongoing valuations. While domestic economic indicators are improving, concerns over uneven global growth, elevated commodity prices, supply disruptions and fears of withdrawal of monetary support in major AEs over inflationary concerns have imparted volatility in portfolio flows.  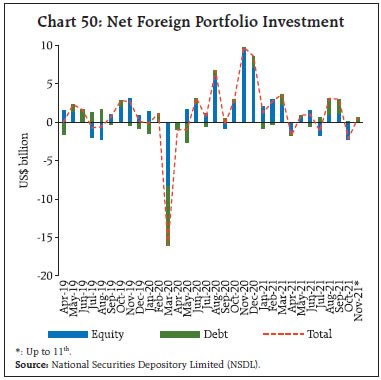 Foreign portfolio investors (FPIs) turned net sellers in the domestic equity market in October (Chart 50), though they remained net purchasers in the debt market in contrast to their EME peers. Net disbursements of external commercial borrowings (ECB) to India remained strong in September 2021. While ECB net inflows, including inter-company borrowings, were of the order of US$ 6.4 billion during April-September 2021 as compared with net outflows of US$ 1.7 billion a year ago, net disbursements excluding repayments and inter-company borrowings amounted to US$ 3.8 billion as against net repayment of US$ 4.3 billion a year ago. Foreign exchange reserves stood at US$ 640.9 billion on November 5, 2021 (Chart 51), providing a cover equivalent to 14 months of imports projected for 2021-22. Scaling back of pandemic-related stimulus programme amidst uncertainty over persistent inflationary pressures in AEs, particularly the US, have reignited some fears of taper tantrum. However, major EMEs are better prepared this time to face any external shocks due to low current account deficits, and external financing requirements, and higher foreign exchange reserves (Annex 1). 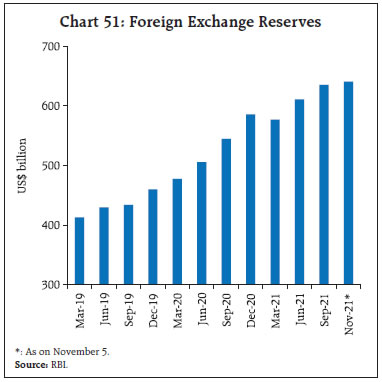 The Indian rupee (INR) depreciated against the US dollar in October by 1.8 per cent (m-o-m), amidst net sell-off in the equity market and concerns over rising crude oil prices. This was reflected in the movement of the INR in terms of the 40-currency real effective exchange rate (REER) index, which depreciated by 0.1 per cent over its level a month ago (Chart 52a and 52b). Payment Systems Riding on the back of the festival season, digital transaction value through the Real Time Gross Settlement (RTGS) system stepped up in October, with y-o-y growth accelerating over the previous month. On the retail side too, transaction values and volumes through all major payment systems demonstrated robust growth (Table 4), mirroring online festival season sales. Early figures for November also corroborate growth of transactions over the same period last year. A recent report suggests that Indian shoppers may have been transacting digitally more frequently during this festival season than a year ago16. The Reserve Bank proposed an increase in the per-transaction limit for the Immediate Payment Service (IMPS) from ₹2 lakh to ₹5 lakh on October 8, 2021. This mode exhibited robust m-o-m growth in October, hitting an all-time high of more than 43 crore transactions, worth a total of ₹3.7 lakh crore. The National Electronic Toll Collection (NETC) system also posted record figures since its inception, pointing at a return to normalcy in road traffic movement. The Unified Payments Interface (UPI) scaled a new high, with transaction values at ₹7.7 lakh crore in October (₹6.5 lakh crore a month ago), with almost 100 per cent growth (y-o-y). UPI transaction volumes surpassed 421 crore, mirroring similar growth in their values. Overall, the growth momentum in digital transactions over the past few months indicates that the economy is gradually shaking off the shackles of the second wave of the pandemic. 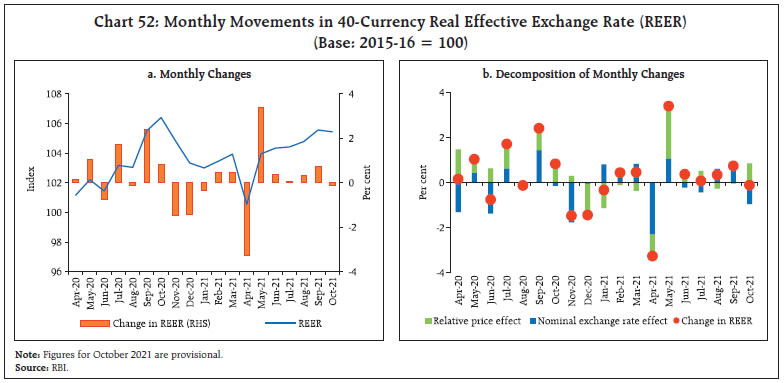 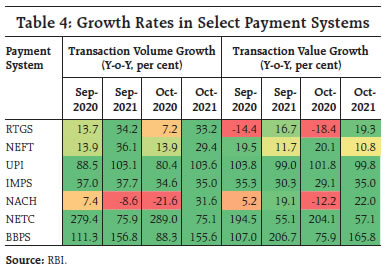 For enhanced financial inclusion through digital modes, the Reserve Bank had launched a pilot on offline digital payments in 2020, under which small transactions up to ₹200 could be made in offline mode. Such offline payments allow the receiver to accept payments without an internet connection, up to a certain cumulative threshold. Once an internet connection is established, the transactions are reconciled with the payment system operator. Ascertaining the success and safety of this pilot, the Reserve Bank has decided to release a nationwide framework for implementing offline retail digital payments, which can work through cards, wallets and mobile devices. Another major initiative towards digital financial inclusion has been the Reserve Bank’s announcement to deploy geo-tagging technology on existing payment acceptance infrastructure, which can help in targeting areas with inadequate infrastructure for focussed policy action under the Payments Infrastructure Development Fund (PIDF) scheme. On the innovation front, the Reserve Bank has proposed the theme “Prevention and Mitigation of Financial Frauds” as the fourth cohort of the Regulatory Sandbox17. This will enable the use of technology to cut down the lag between the occurrence and detection of frauds, strengthen the fraud governance structure and minimise response time to address fraudulent activities. V. Conclusion As set out in foregoing sections, the Indian economy is clearly differentiating itself from the global situation, which is marred by supply disruptions, stubborn inflation and surges of infections in various parts of the world. The global economic outlook remains clouded by uncertainty with headwinds from multiple fronts at a time when many economies are still struggling with nascent recoveries. There is a risk of faster policy normalisation by major central banks leading to tightening of financial conditions and stifling of growth impulses. Domestically, there have been several positives on the COVID-19 front, in terms of reduced infections and faster vaccinations. Mobility is rapidly improving, the job market is recouping and overall economic activity is on the cusp of a strengthening revival. Overall monetary and credit conditions stay conducive for a durable economic recovery to take root. Annex 1: Review of EME Preparedness against External Shocks
* This article has been prepared by Kunal Priyadarshi, Sarthak Gulati, Shashidhar M. Lokare, Rajeev Jain, Vineet Kumar Srivastava, Barkha Gupta, Jessica Anthony, Krishna Mohan Kushawaha, Shashi Kant, Satyam Kumar, John V. Guria, Manu Sharma, Prashant Kumar, Rishabh Kumar, Siddhant Kujur, Somnath Sharma, Avnish Kumar, Rajas Saroy, Asish Thomas George, Deba Prasad Rath and Samir Ranjan Behera. Views expressed in this article are those of the authors and do not necessarily represent the views of the Reserve Bank of India. 1 Quarter on quarter, seasonally adjusted annualised rate. 2 Includes both departing and arriving passengers. 3 Gavi is an international organisation – a global vaccine alliance, bringing together public and private sectors with the shared goal of saving lives and protecting people’s health by increasing equitable and sustainable use of vaccines. 4 Ocean-based industries include shipping, fishing, offshore wind, and marine biotechnology. 5 Over 2019-20, direct and indirect taxes recorded an increase of 27.1 per cent and 30.5 per cent, respectively. 6 Growth of 22.3 per cent and 7.3 per cent over 2019-20, respectively. 7 Average share of own tax revenue of the states in their total revenue receipts is around 46.2 per cent, while the devolution of taxes from Centre to states is around 26.4 per cent in the last 5 years (2016-17 to 2020-21). 8 The Fifteenth Finance Commission has set the tax devolution to states at 41 per cent of the total divisible pool. 9 As per the Third Advance Estimate (3rd AE) of Horticulture Production for 2020-21 released by the Department of Agriculture, Cooperation and Farmers Welfare on October 29, 2021. 10 Viz., 2010, 2016, 2017, 2020 and 2021. 11 As per the Ministry of Agriculture and Farmers’ Welfare. 12 CPI excluding food and fuel is worked out by eliminating the groups ‘food and beverages’ and ‘fuel and light’ from the headline CPI 13 representing average card rates across all tenors 14 The significant reduction in interest rates on personal housing loans and loans to commercial real estate sector augurs well for the economy, as these sectors have extensive backward and forward linkages and are employment intensive (Governor’s Monetary Policy Statement, August 6, 2021). 15 Kumar, Naveen, and J. P. Singh. “Effect of board size and promoter ownership on firm value: some empirical findings from India.” Corporate Governance: The international journal of business in society (2013). 16 https://indianexpress.com/article/technology/tech-news-technology/indian-consumers-prefer-digital-payments-over-cash-but-failed-transactions-worry-users-study-7589966/ 17 /en/web/rbi/-/press-releases/statement-on-developmental-and-regulatory-policies-52368 |

شارك هذه الصفحة:


بھارت موبائل ایپلی کیشن کے ریزرو بینک کو انسٹال کریں اور تازہ ترین خبروں تک فوری رسائی حاصل کریں!
ہماری ایپ انسٹال کرنے کے لیے QR کوڈ اسکین کریں۔


صفحے پر آخری اپ ڈیٹ:


